Evaluation of the On-Campus Dining Service Using Importance-Performance Analysis
Hyun-Woo Joung
Nutrition, Hospitality, and Retailing Texas Tech University
Dong-Soo Lee
Nutrition, Hospitality, and Retailing Texas Tech University
Hak-Seon Kim
Dedman School of Hospitality Management Florida State University
Joo Ahn
Nutrition, Hospitality, and Retailing Texas Tech University
and
Lynn Huffman
Nutrition, Hospitality, and Retailing Texas Tech University
ABSTRACT
University foodservice is one of the largest sectors of the foodservice industry, and the college-student market is getting larger. Therefore, it is important that university foodservice needs to be monitored periodically and improved comprehensively in order to retain students as satisfied customers for on-campus foodservice. The objectives of the current study were to explore the importance and performance/satisfaction of on-campus dining service consumers, to investigate the importance-performance difference between patron and non-patron customers, and to examine the difference between gender groups. The study compared the respondents’ perceived importance and performance ratings of the dining service quality attributes using IPA. The IPA grid illustrated that food quality and sanitation fell into the Quadrant II (Keep up the Work); price into the Quadrant III (Low Priority); and service and environment into the Quadrant IV (Possible Overkill). However, according to IPA of comparison of patron versus non-patron groups and gender groups, the service attribute was allocated differently.
INTRODUCTION
University foodservice is one of the largest sectors of the foodservice industry (Lam & Heung, 1998; Andaleeb & Caskey, 2007), and the college-student market is getting larger (College & University, 1997; Kim, Moreo, &Yeh, 2004; Knutson, 2000). According to the National Center for Education Statistics (2010), the number of college and university students is projected to increase from an estimated 14.6 million in 1998 to 17.5 million by the year 2010, an increase of 20%. These figures indicate that there is a huge demand for university foodservice by students and staff on campuses. Moreover, given the projected growth in the college and university foodservice market, evaluating on-campus foodservice became essential (Knutson, 2000) because potential customers, students, faculty, and staff, will go to an off-campus if the on-campus providers do not meet customers’ needs and wants (Eckel, 1985). Therefore, maintaining food and service quality and attracting their potential customers are the on-campus foodservice providers’ main consideration. Therefore, it is important that university foodservice needs to be monitored periodically and improved comprehensively in order to retain students as satisfied customers for on-campus foodservice. In order the foodservice managers to satisfy customers effectively, it is worthwhile to investigate how important customers consider quality attributes. However, there are few studies on evaluating on-campus dining service customers’ perceived importance and performance/satisfaction levels.
Purpose of the Study
The objectives of the current study are to explore the importance and performance/satisfaction of on-campus dining service consumers, to investigate the importance-performance difference between patron and non-patron customers, and to examine the difference between gender groups. For the empirical study, customers who utilize the on-campus food court less than twice per week are defined as non-patron, and the others are defined as patron (Kim, 2007).
Importance-Performance Analysis
Importance-Performance Analysis (IPA), introduced by Martilla and James (1997), has become a popular managerial tool to identify the strengths and weaknesses of products and services, and is frequently used in hospitality and tourism research (Hollenhorst, Olson, & Fortney, 1992; Chu & Choi, 2000; Oh, 2001; Matzler, Bailom, Hinterhuber, Renzl, & Pichler, 2003; Zhang & Chow, 2004). Figure 1 illustrates importance-performance analysis grid. The Y-axis reports the respondents’ perceived importance, and the X-Y-axis represent the respondents’ perceived performance (Chu & Choi, 2000).
Importance
Adapted from “An importance-performance analysis of hotel selection factors in the Hong Kong hotel industry: A comparison of business and leisure travelers” by R.K.S. Chu and T. Choi, 2000,
Management, 21, 363-377.
Research Instruments
A self-administered questionnaire was developed about the quality attributes offered by
adopted from previous studies (Kim, 2007; Joung, Kim, Choi, Kang, & Goh, 2010) to fit the current study setting.
asked questions about the use of the campus food court and were then asked importance levels of five factors: food quality, pr
they rated the perceived satisfaction/performance of the questionnaire consisted of
Study Sample and Data Collection The data were collected at university. The target population w
dined at the food court. The survey was collected fro
to measure respondents’ perceived satisfaction/performance levels, the 5 was used ranging from 1 (strongly dis
respondents’ importance levels,
importance of the five quality attributes rather than 5 Figure 1
mportance-Performance Analysis Grid
performance analysis of hotel selection factors in the Hong Kong hotel industry: A comparison of business and leisure travelers” by R.K.S. Chu and T. Choi, 2000,
METHODOLOGY
administered questionnaire was developed to measure respondents’ perception quality attributes offered by on-campus food court. The questionnaire items were
(Kim, 2007; Joung, Kim, Choi, Kang, & Goh, 2010)
to fit the current study setting. The questionnaire consisted of three parts. Respondents were questions about the use of the campus food court and were then asked to rate the perceived importance levels of five factors: food quality, price, sanitation, service, and environment. Then the perceived satisfaction/performance of five factors mentioned above. The third part
consisted of socio-demographic information.
Study Sample and Data Collection
The data were collected at the university on-campus food court at a large West . The target population were customers who have purchased food for take out dined at the food court. The survey was collected from November 2009 to March
o measure respondents’ perceived satisfaction/performance levels, the 5-point Liker
anging from 1 (strongly dissatisfied) to 5 (strongly satisfied). In order to rate respondents’ importance levels, on the other hand, they made a judgement of the relative importance of the five quality attributes rather than 5-point Likert-type scale. A
performance analysis of hotel selection factors in the Hong Kong hotel industry: A comparison of business and leisure travelers” by R.K.S. Chu and T. Choi, 2000, Tourism
to measure respondents’ perception The questionnaire items were (Kim, 2007; Joung, Kim, Choi, Kang, & Goh, 2010) and modified . Respondents were to rate the perceived ice, sanitation, service, and environment. Then five factors mentioned above. The third part
at a large West Texas food for take out and/or m November 2009 to March 2010. In order point Likert-type scale ). In order to rate hey made a judgement of the relative type scale. All respondents
were provided 10 stickeres to distribute among the five factors: food quality, price, sanitation, service, and environment. If they considered that all five factors are equally important, they would logically assign two stickers to each dimension. However, if they considered one factor is more important than others, they could assign more stickers to the particular factor.
Data Analysis
Descriptive statistics were used to describe the respondents’ demographic profile and to calculate the respondents’ importance and satisfaction/performance levels by using frequency, mean, and standard deviation. Mean scores rating respondents’ importance and satisfaction/performance levels about five quality attributes were computed for the importance-performance analysis. Then, the mean scores were plotted on the IPA grid. The data were split into patron versus non-patron and into male versus female for further analysis.
RESULTS AND DISCUSSION Sample Profile
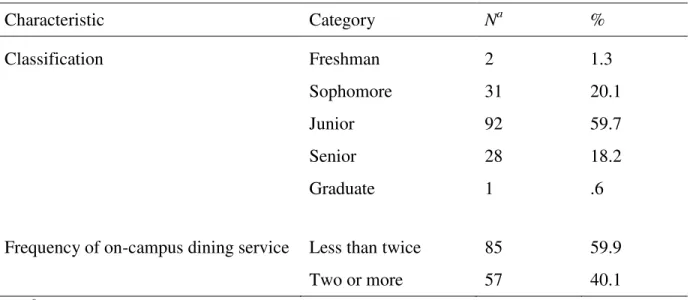
Table 1 presents the respondents’ demographic characteristics. Results showed that 41.6% (n = 64) were male and 58.4% (n = 90) were female. The average age was 21.52 years old, and the majority (81.8%) of the age group was from 20 to 25 years old (n = 125). Regarding the classification, 99.4% of respondents were under graduate students: more than half (59.7%) of them were juniors, followed by sophomores, seniors, and freshman. Respondents who utilized on-campus dining service less than twice accounted for about 60% (n = 85).
Table 1
Socio-Demographic Characteristics of the Sample (N = 156)
Characteristic Category Na % Gender Male 64 41.6 Female 90 58.4 Age Under 20 18 11.9 20 - 25 125 81.8 26- 30 6 4.2 Above 30 3 2.1
Table 1 (continued) Characteristic Category Na % Classification Freshman 2 1.3 Sophomore 31 20.1 Junior 92 59.7 Senior 28 18.2 Graduate 1 .6
Frequency of on-campus dining service Less than twice 85 59.9
Two or more 57 40.1
Note: a Sample size was decrease due to missing data
Overall Importance-Performance Analysis
The mean scores and standard deviations of the respondents’ perceived importance and satisfaction/performance levels of the five quality attributes (Table 2). Then, the results were plotted in the IPA grid (Figure 2). According to Zhang and Chow (2004), the grand means of importance and satisfaction/performance were used for the placement of the axes on the grid.
Table 2
Perceived Importance and Performance of Respondents’ Quality Attributes (N = 156)
Attributes Importance Performance Mean (SDa) Mean (SDa) Food Quality 2.74 (.78) 3.72 (.68) Price 1.84 (1.04) 3.01 (.95) Sanitation 2.15 (.85) 3.65 (.72) Service 1.61 (.66) 3.66 (.90) Environment 1.59 (1.02) 3.92 (.74)
Overall IPA for the
The most important attribute among five factors was food quality ( followed by sanitation (M = 2.15
1.59). In contrast, respondents were the most satisfied with environment ( by food quality (M = 3.72), service (
According to the IPA (Figure 2)
Quadrant II (Keep up the Work), one attribute (price) in Quadrant III (Low Priority), and two attributes (service and environment) in Quadrant IV (Possible
Comparison of Patron versus Non
To examine different types of customers
performance/satisfaction levels were calculated for each subsamples: patron versus non (Table 3). The importance-performance grid positions were allocated
and performance/satisfaction grand means for each subsample (Joppe, Martin, & Waalen, 2001). The importance-performance grid for patron and non
no attribute in Quadrant I (Concentrate Here) for either group. Among food quality and sanitation attributes
attributes were rated above average in both perceived importance and performance for both groups. These results conveys that food court dining service is performing well in the two attributes above. The only quality attribute loaded
attribute. It was rated as low importance and low performance for both patron and non groups.
Figure 2
Overall IPA for the Respondents on the Food Court
The most important attribute among five factors was food quality (
2.15), price (M = 1.84), service (M = 1.61), and environment ( respondents were the most satisfied with environment (M = 3.92
), service (M = 3.66), sanitation (M = 3.65), and price (
), two attributes (food quality and sanitation) were identified in Quadrant II (Keep up the Work), one attribute (price) in Quadrant III (Low Priority), and two attributes (service and environment) in Quadrant IV (Possible Overkill).
Patron versus Non-Patron in IPA
To examine different types of customers in the sample, means of
were calculated for each subsamples: patron versus non
performance grid positions were allocated based upon the importance grand means for each subsample (Joppe, Martin, & Waalen, 2001). performance grid for patron and non-patron is presented in Figure 3.
no attribute in Quadrant I (Concentrate Here) for either group. Among five quality attributes, food quality and sanitation attributes were identified in Quadrant II (Keep up the Work). These attributes were rated above average in both perceived importance and performance for both groups. These results conveys that food court dining service is performing well in the two
nly quality attribute loaded in Quadrant III (Low Priority) . It was rated as low importance and low performance for both patron and non
The most important attribute among five factors was food quality (M = 2.74) and ), and environment (M = M = 3.92), followed ), and price (M = 3.01). , two attributes (food quality and sanitation) were identified in Quadrant II (Keep up the Work), one attribute (price) in Quadrant III (Low Priority), and two
means of importance and were calculated for each subsamples: patron versus non-patron upon the importance grand means for each subsample (Joppe, Martin, & Waalen, 2001). patron is presented in Figure 3. There was quality attributes, p up the Work). These attributes were rated above average in both perceived importance and performance for both groups. These results conveys that food court dining service is performing well in the two in Quadrant III (Low Priority) was price . It was rated as low importance and low performance for both patron and non-patron
Perceived Importance and Performance of Respondents’ Quality Attributes between Attributes Importance Patrona Mean (SD) Food Quality 2.72 (.80) Price 1.68 (1.05) Sanitation 2.12 (.80) Service 1.77 (.66) Environment 1.67 (1.12) Note: a N = 57, b N = 85
IPA for the P
Table 3
Perceived Importance and Performance of Respondents’ Quality Attributes between Patron and Non-Patron
Importance Performance Non-Patronb Patron Mean (SD) Mean (SD) 2.73 (.78) 3.68 (.74) 1.89 (1.04) 3.00 (.94) 2.24 (.90) 3.60 (.80) 1.51 (.61) 3.51 (1.02) 1.53 (.96) 3.86 (.77) Figure 3
Patron (above) and the Non-Patron (below)
Perceived Importance and Performance of Respondents’ Quality Attributes between
Performance Non-Patron Mean (SD) 3.74 (.66) 2.95 (.97) 3.66 (.68) 3.70 (.78) 3.96 (.73)
The performance level of the price attribute is relatively low, but food court operators should not be overly concerned because respondents do not perceive this attribute to be very important. There was one attribute, environment, considered as Possible Overkill in Quadrant IV. This attribute was rated as low importance, but high performance. This indicated that customers who go to the on-campus food court were highly satisfied with the food court environment even though they did not perceive the environment attribute important. Only one attribute, service, was allocated in a different Quadrant between patron and non-patron groups: Quadrant III for patron group and Quadrant IV for non-patron group. This attribute was considered as low important, but non-patron group was highly satisfied with the service attribute but the patron group was not.
Comparison of Male versus Female in IPA
In order to test gender difference in the sample, importance and performance levels of each group were assessed: male versus female (Table 4). The grand means of each subgroup were used for the importance-performance grid positions.
Table 4
Perceived Importance and Performance of Respondents’ Quality Attributes between Male and Female
Attributes
Importance Performance
Malea Femaleb Male Female
Mean (SD) Mean (SD) Mean (SD) Mean (SD)
Food Quality 2.69 (.83) 2.78 (.75) 3.69 (.77) 3.74 (.61) Price 1.89 (1.07) 1.79 (1.01) 3.09 (.97) 2.93 (.93) Sanitation 2.00 (.80) 2.28 (.87) 3.66 (.78) 3.66 (.69) Service 1.63 (.65) 1.60 (.67) 3.54 (.96) 3.72 (.86) Environment 1.75 (1.13) 1.47 (.93) 3.92 (.86) 3.92 (.66) Note: a N = 64, b N = 90
The importance-performance grid for male and female is depicted in Figure 4, showing similar trends with the overall IPA. There was no attribute in Quadrant I (Concentrate Here) for either male or female groups. Two attributes, food quality and sanitation, were allocated in Quadrant II (Keep up the Work). These two attributes were perceived high importance and high performance for both groups. These results indicated that food court dining service is performing well in the two attributes above.
IPA for
One attribute, price, is loaded in Quadrant III (Low Priority). It was rated as low importance and low performance for both
attribute is relatively low, operators do not really care about this issue because cu
to on-campus food court do not perceive this attribute to be very important. The environment attribute was allocated in Quadrant IV (Possible Overkill) for both gender groups. This attribute was rated as low importance, but high performance.
customers were highly enough satisfied with the food court environment even though they did not perceive the environment attribute important. Lastly, the service attribute was different in both gender groups: Quadrant III for
though the service attribute was considered as low important, female group was highly satisfied with the service attribute, but the
Figure 4
IPA for Male (above) and Female (below).
is loaded in Quadrant III (Low Priority). It was rated as low nd low performance for both groups. Although the performance level of this attribute is relatively low, operators do not really care about this issue because cu
campus food court do not perceive this attribute to be very important. The environment attribute was allocated in Quadrant IV (Possible Overkill) for both gender groups. This attribute was rated as low importance, but high performance. This implies that both male and female customers were highly enough satisfied with the food court environment even though they did not perceive the environment attribute important. Lastly, the service attribute was different in t III for the male group and Quadrant IV for the female group. Even though the service attribute was considered as low important, female group was highly satisfied
the male group was not.
is loaded in Quadrant III (Low Priority). It was rated as low groups. Although the performance level of this attribute is relatively low, operators do not really care about this issue because customers who go campus food court do not perceive this attribute to be very important. The environment attribute was allocated in Quadrant IV (Possible Overkill) for both gender groups. This attribute This implies that both male and female customers were highly enough satisfied with the food court environment even though they did not perceive the environment attribute important. Lastly, the service attribute was different in female group. Even though the service attribute was considered as low important, female group was highly satisfied
CONCLUSION AND IMPLICATION
This study categorized five quality attributes of dining service: food quality, price, sanitation, service, and environment. The study then compared the respondents’ perceived importance and performance ratings of the dining service quality attributes using IPA. The IPA grid illustrated that food quality and sanitation fell into Quadrant II (Keep up the Work); price into Quadrant III (Low Priority); and service and environment into Quadrant IV (Possible Overkill). However, according to the IPA of comparison of patron versus non-patron groups and gender groups, the service attribute was allocated differently.
In practical terms, the IPA technique has divided and categorized five quality attributes into an IPA grid. Once customers’ requirements are clearly identified and understood, the university on-campus dining service operators are more likely to do better job and to provide better service to their customers. Furthermore, knowing how customers perceive the quality attributes in the dining service can be a means to achieve a competitive advantage and to differentiate themselves from competitors.
The major drawback of this study is the inability to generalize findings to the entire university foodservice because data of the current study were collected only in West Texas. By conducting a nationwide survey in the future, the findings could be validated and strengthened.
REFERENCES
Andaleeb, S.S. & Caskey, A. (2007). Satisfaction with food services: Insight from a college Cafeteria. Journal of Foodservice Business Research, 10(2), 51-65.
Chu, R.K.S., & Choi, T. (2000). An importance-performance analysis of hotel selection factors in the Hong Kong hotel industry: A comparison of business and leisure travelers. Tourism Management, 21, 363-377.
College & University. (1997). Food Management, 32(10), 32-45.
Eckel, P.J. (1985). College & university foodservice management standards (Vol.6): AVI Publishing Company.
Hollenhorst, S., Olson, D., & Fortney, R. (1992). Use of importance-performance analysis to evaluate state park cabins: The case of the West Virginia State park system. Journal of Park and Recreation Administration, 10(1), 1-11.
Joppe, M., Martin, D.W., & Waalen, J. (2001). Toronto’s image as a destination: A comparative importance-satisfaction analysis by origin of visitor. Journal of Travel Research, 39, 252-260.
Joung, H.-W., Kim, H.-S., Choi, E.-K., Kang, H.-O., & Goh, B. (2010, January). University foodservice in South Korea: A study of comparison between university operated restaurant and external foodservice contractors. Paper presented at The 15th Annual Graduate Student Research Conference in Hospitality and Tourism, Washington D.C. Kim, H.-S. (2007). Development of a multiple-item scale for measuring students’ satisfaction
with university foodservice (Master’s thesis). Seoul National University, Seoul, South Korea.
Kim, Y.-S., Moreo, P.J., & Yeh, R.J.M. (2004). Customers’ satisfaction factors regarding university food court service. Journal of Foodservice Business Research, 7(4), 97-110. Knutson, B. J. (2000). College students and fast food – How students perceive restaurant brands.
Cornell Hotel and Restaurant Administration Quarterly, 41(3), 68-74.
Lam, T.C.Y. & Heung, V.C.S. (1998). University foodservice in Hong Kong: A study of consumers’ expectations and satisfaction levels. Journal of College & University Foodservice, 3(4), 3-12.
Martilla, J.A., & James, J.C. (1977). Importance-performce analysis. Journal of Marketing, 41(1), 77-79.
Matzler, K., Bailom, F., Hinterhuber, H.H., Renzl, B., & Pichler, J. (2004). The asymmetric relationship between attribute-level performance and overall customer satisfaction: A reconsideration of the importance-performance analysis. Industrial Marketing Management, 33, 271-277.
National Center for Education Statistics. (2010). Projections of Education Statistics to 2010. Revrieved from http://nces.ed.gov/pubs2000/2000071.pdf
Oh, H. (2001). Revisiting importance-performance analysis. Tourism Management, 22, 617-627. Zhang, H.Q., & Chow, I. (2004). Application of importance-performance model in tour guides’
performance: evidence from mainland Chinese outbound visitors in Hong Kong. Tourism Management, 25, 81-91.