Procedia Computer Science 00 (2010) 000–000
Science
www.elsevier.com/locate/procediaInternational Conference on Computational Science, ICCS 2010
Credit card customer analysis based on panel data clustering
Guangli Nie
a,b, Yibing Chen
b,c, Lingling Zhang
a,b*, Yuhong Guo
ca Research Center on Fictitious Economy and Data Science, CAS, Beijing 100190, China b Graduate University of Chinese Academy of Sciences, Beijing 100190, China
cDepartment of Information Technology, University of International Relations, Beijing 100091, China dCollege of Information Science and Technology, University of Nebraska at Omaha, Omaha, NE 68182, USA
Abstract
In this paper, we propose a new distance measurement which can be used in panel data clustering. The distance as we designed can be calculated with weight and without weight. If users put more attention on recent data, a heavier weight can be assigned to the recent data. We use real panel data of a commercial bank’s credit card to examine the performance of our new distance measurement. The results show that our distance measurement can reflect the information of different periods and panel data can be used to cluster to find new knowledge. This study discovers different knowledge structure from the traditional econometrics analysis with the help of data mining algorithms.
panel data; data mining; clustering; credit card churn analysis
1. Introduction
A longitudinal, or panel data set is one that follows a given sample of individuals over time, and thus provides multiple observations on each individual in the sample [1]. The advantage of this data structure has been proved by a lot of studies[2].Panel data sets have been increasingly used in economics to analyze complex economic phenomena and the relationship between factors[3]. In the traditional econometric analysis, the results of the analysis are linear regression.
Knowledge discovery from database (KDD) which is also named data mining is a process to extract knowledge from large amount of data[4]. As the augment of the size of enterprise and the data, data mining as a way to make use of the data and an efficient method of business intelligence becomes more and more necessary[5-7]. In the traditional data mining, the data used is in cross section form. One individual in the sample only has one row to reflect the information of the individual. This fact ignores a lot of information hidden behind the data and limits the application of data mining[8].
* Corresponding author. Tel.: +86+10+82680697; fax: +86+10+82680697.
E-mail address: [email protected] (G.Nie), [email protected](C.Chen), [email protected](L.Zhang), [email protected](Y.Guo)
c
⃝2012 Published by Elsevier Ltd.
Procedia Computer Science 1 (2012) 2489–2497
www.elsevier.com/locate/procedia
1877-0509 c⃝2012 Published by Elsevier Ltd.
doi:10.1016/j.procs.2010.04.281
Open access under CC BY-NC-ND license.
Now that, the panel data can store a lot of information, we should deeply analyze panel data with the help of data mining algorithms. To the best of our knowledge, there are rare studies related to panel data mining until now. The adequate knowledge hidden behind the panel data should be fully analyzed. The data mining idea and algorithms can be applied to panel data to find knowledge which is different from the regression knowledge discovered by the traditional linear regression.
In this paper, the clustering which is an unsupervised data mining members is used to analyze the panel data. Because the existing distance measurements of clustering algorithms are suitable to the traditional data, we propose a new distance measurement. There are two basic types of clustering algorithms: partitioning and hierarchical algorithms[9]. We applied the mature density-based clustering algorithm which is named DBSCAN to find knowledge different from regression knowledge. DBSCAN algorithm is proposed in 1996 and has been improved by a lot of researches[10].
Banks are very important sectors in the development of economy. The unknown future behaviors of the customers are quite important to CRM. It becomes increasingly important for the bank to predict their customers’ future decision then the banks can take corresponding actions early[11]. Thanks to the development of information technology, many banks have stored a large amount of data. Analyzing the data stored in the database can help the managers make the right marketing decision and pinpoint the right customers to market. Credit card holders are important group customers to the banks. It is also important to cluster the holders into several clusters to manage the customers respectively. In this paper, the new distance measurement we proposed is used in the panel data clustering and applied into the credit card holder clustering.
The rest of the paper is organized as follows. The literature review related to panel data and clustering is
introduced in Section 2. Section 3 introduces the distance measurement in panel data clustering. The data used in the study is described in Section 4, and the modelling process and results are presented in Section 5. The conclusions are introduced in the last section.
2. Panel data and clustering review
Panel data which is also called time-series cross-section data are characterized by having repeated observations on fixed units, such as states or nations. The number of units analyzed would typically range from about 10 to 100, with each unit observed over a relatively long time period (often 20 to 50 periods). Ordinary least squares (OLS) and the generalized least squares (GLS) are the two most frequently used estimation methods. In particular, models for panel data often allow for temporally and spatially correlated errors, as well as for heteroscedasticity. Parks proposed a method for dealing with these problems based on GLS. The use of this method can lead to dramatic underestimates of parameter variability in common research situations[12].
In the study of traditional econometrics, the knowledge structure gotten from the analysis is fixed. This is a standard panel data model as follows.
'
, ,
yi,t D*iȕiXi tui t, i }}1, N U 1,}}T. (1)
,
i t
x
is a k-dimensional vector of predetermined variables. whereThere are three types of restrictions can be posed on above equation in the traditional econometrics models[1]. The three different forms are listed as follows.
H1: Regression slope coefficients are identical, and intercepts are not.
'
, ,
yi,t Di*ȕXi tui t, i }}1, , ,N t }}1, ,T.
T
(2) H2: Regression intercepts are the same, and the slope coefficients are not.
'
, , ,
yi t D*ȕiXi tui t, i }}1, , ,N t }}1, , .(3) H3: Both slope and intercept coefficients of the regression are the same.
'
, ,
yi,t D* ȕ Xi tui t, i }}1, , ,N t }}1, ,T. (4)
Data mining is an application-driven technique[13, 14]. It has been widely used in many applications, from tracking criminals to analyzing information for supermarkets, from developing community knowledge for a business to cross selling, and detecting the customer churn.
In the traditional clustering of data mining, the structure of the data used in the analysis is cross section type. All the values of the variables of the examined objectives are in one row. Except for the time series analysis, the time information of the data mining is ignored. At present, most clustering researches are also relied on cross section data.
To the best of our knowledge, there are few researches which apply the data mining idea to the panel data analysis. Zheng applied panel data clustering to discount rate of B stock in China[15]. However, this research is still confined to the econometrics analysis.
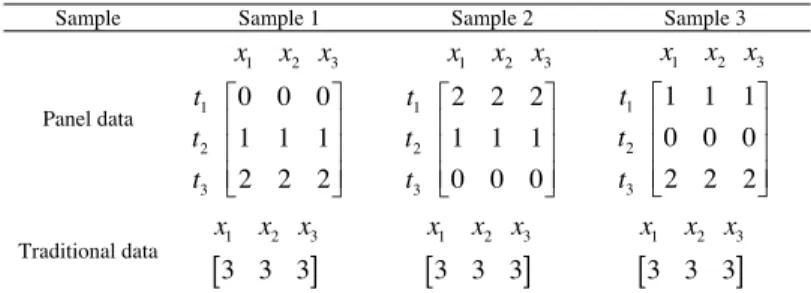
Here we use matrixes to demonstrate the shortcoming of the existing data clustering based on cross section data. There are three samples in table 1 which include sample 1, sample 2 and sample 3.
Table 1. An example of a table
Sample Sample 1 Sample 2 Sample 3
1 2 3 1 2 3 1 1 1 0 0 0 2 2 2 x x x t t t ª º « » « » « » ¬ ¼ 1 2 3 1 2 3 0 0 0 1 1 1 2 2 2 x x x t t t ª º « » « » « » ¬ ¼ 1 2 3 1 2 3 2 2 2 1 1 1 0 0 0 x x x t t t ª º « » « » « » ¬ ¼ Panel data
>
@
1 2 3 3 3 3 x x x>
@
1 2 3 3 3 3 x x x>
@
1 2 3 3 3 3 x x x Traditional data 1, 2, 3 xAssumed the data is related to the churn analysis of credit card holders. In the matrixes, x x denote the variables and t t t1, ,2 3 denote the time period of the analysis respectively. If x1 denotes the transaction times of a
card holder, we can see that sample 1 used the card increasingly and sample 2 used the card decreasingly. The trend of sample one is increasing and the trend of sample two is decreasing. However, if we use the cross section data in the traditional form, the sum or the average of the variable will be used i.e. the traditional data will be used to analyze. The traditional data of the three samples are the same. Hence, the change trend of the variables will be ignored. This is a very serious shortcoming of the traditional data mining analysis which ignores the trend change of in time horizon of the samples. In order to overcome the shortcoming, we will propose a new measurement method of distance which is the most important factor considered in the process of clustering to cluster the panel data.
3. Panel data clustering
The traditional data clustering algorithms which use coefficients to reflect the difference of the cross section cannot be used to discover knowledge from a large amount of cross sections. Data mining has the advantage to analyze large amount of samples. Hence, we apply the traditional data mining algorithms to the mature panel data structure.
As mentioned, in this paper we propose a clustering algorithm based on the traditional density algorithm named DBSCAN. The new distance measurement can overcome the shortcoming of the traditional distance measurement.
In order to avoid the effect of extreme value, all the values of the primal matrixes should be scaled between a maximum and minimum value according to the following formula and then used to calculate the distance.
' min ( _ max _ min ) _ min
max min
A
A A
A A
v
v new new new
A
(5)
According to above equation, we can normalize the example we designed in table 1 between 0 and 1 as follows.
1 2 3 1 2 3 0 0 0 0.5 0.5 0.5 1 1 1 x x x t t t ª º « » « » « » ¬ ¼ 1 2 3 1 2 3 0 0 0 1 1 1 2 2 2 x x x t t t ª º « » « » « » ¬ ¼ can be normalized as
We use a matrix M to store the distance between sample i and sample j and the value of the matrix can be gotten based on equation 6. 2 , ( , , , ,) 1, , , 1, , i j i k t j k t m x x i N }} K }}N (6)
Where denote the value of matrix which stores the information of distance. k,t denote variable and the time period of the samples of the dataset respectively.
,
i j
m
Taking the toy data in table 1 for example, the matrix of sample 1 and sample 2 can be calculated as follows.
1 2 3 1 1,2 2 3 0 0 0 0.5 0.5 0.5 1 1 1 x x x t t t ª º « » « » « » ¬ ¼ M 1 2 3 1 2 3 1 1 1 0.5 0.5 0.5 0 0 0 x x x t t t ª º « » « » « » ¬ ¼ 1 2 3 1 2 3 1 1 1 0 0 0 1 1 1 x x x t t t ª º « » « » « » ¬ ¼ =
If all of the periods of the samples are treated equally, then we can simply calculate the sum of all of the value of the matrix and calculate the average. Equation 7 is the formula which will be used to measure the distance.
, 1 1 ( , ) 1, , , 1, , , 1, , , 1, , T K t k t k dis i j x k }} K t }}T i }} N j }}
¦ ¦
(7) NIf the more recent sample is regarded as more important, we weight the distance at different period differently.
, 1 1 ( , ) 1, , , 1, , , 1, , , 1, , T K t t k t k dis i j w x k }}K t }}T i }} N j }}
¦ ¦
(8) NHow to calculate the weight of the variables is still a confusing issue. The weight can be assigned by the users. If the recent data of the time series is regarded more important, we can use different weight to reflect the difference by assigning the recent data larger weight. In this paper, we propose a method to assign the weight by following equation 8. Following weight equation can put more importance on the recent data and make sure that the sum of the weight of all periods is 1.
t
w
1 1, t T t t w t t¦
ĂĂT (9) 5 /(1 2 3 4 5) 1/ 3 t wFor example, if there are five time series, the weight of fifth period would be . This equation is only an example, if the users of the algorithms have different preference, they can assign the weight by different criteria.
4. Research Data
4.1. Data Source
In ICCS2009, we introduced the classification of credit card holders to predict the churn[16]. In that study, we wrote “all transactions are aggregated at the customer level. One customer may have several cards, but the object to predict is the customer, thus it is quite necessary to aggregate the data at the customer level.” We used extreme variables to aggregate the records to customer level. We must process in that way, because we cannot use panel data to discover knowledge. In order to overcome this shortcoming, we combine panel data which is a well studied data structure in econometrics and density based data clustering algorithm which is also a mature data mining
technologies with a long history.
The data used in this study is from a major China commercial bank and the data is extracted from a data warehouse of that bank. All of the data is organized at the level of customer. No matter in which branch the customer open the account, the data warehouse can identify the customer by name and identification number of the customer. All of the customers in the warehouse are indexed by a unique customer number. The data warehouse records all the past change of the card. Take the balance of the card for example, once the balance of the card changed, there will be one more row to keep the new balance and the last balance is still kept.
In this study, we want to cluster the customers by the behaviors of the card holders. We have a table with 5.6 million rows to record the transaction details of all the customers from January, 2005 to April, 2008. So, we designed
variables related to the behaviors to measure the distance of the card holders. The transactions which are not initial start by the customers are excluded. The transactions include close account, interest on deposit, loan interest, interest tax, overdue fee, overdue fine, annual fee of card, housing loans, loan principal repaying, loan interest repaying. These transactions are originated not by the holders but the bank. In order to avoid the noisy data misleads the analysis, we delete this data.
4.2. Data Description
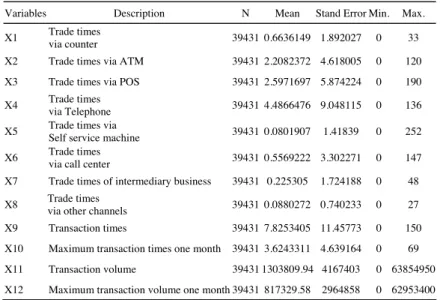
We applied the density based panel data clustering to credit card holder’s behaviour analysis. We want to classify the customers of bank into several clusters according to their transaction behaviours. So we designed a lot of variables to reflect the behaviours of the customers. From X1 to X8 are variables related to the channel the card holders chose when they made deal with banks. There were a lot of choices for the holders when they made transactions. Some of them went to the counter and other people finished the transaction by ATM. Hence, eight variables are designed to reflect the channel choice of the card holders. X9 to X12 are four variables about the transaction facts of the holders including the transaction times and volume. All of the 12 variables are displayed in table 2.
Table 2. The statistic of the variables of our experiment data
Variables Description N Mean Stand Error Min. Max.
Trade times
X1 via counter 39431 0.6636149 1.892027 0 33
X2 Trade times via ATM 39431 2.2082372 4.618005 0 120 X3 Trade times via POS 39431 2.5971697 5.874224 0 190
Trade times
X4 39431 4.4866476 9.048115 0 136
via Telephone Trade times via
X5 Self service machine 39431 0.0801907 1.41839 0 252 Trade times
X6 via call center 39431 0.5569222 3.302271 0 147
X7 Trade times of intermediary business 39431 0.225305 1.724188 0 48 Trade times
X8 via other channels 39431 0.0880272 0.740233 0 27
X9 Transaction times 39431 7.8253405 11.45773 0 150
X10 Maximum transaction times one month 39431 3.6243311 4.639164 0 69 X11 Transaction volume 39431 1303809.94 4167403 0 63854950 X12 Maximum transaction volume one month 39431 817329.58 2964858 0 62953400
The value of 99 percent of transaction volume is no larger than 64128148. In order to avoid the effect of extreme value, we delete the samples with value of X11 larger than 64128148. After the preprocess process, we get a dataset with 39731 samples. There are 5633 cross sections with 7 periods, so the whole sample number is 39731(5633*7).
Time series data is an important part of panel data. We split the time period from January 2006 to April 2008 into 7 parts. Every 4 months is one part. The partition result is displayed in figure 1.
Jan 2006 Apr 2006 Aug 2006 Dec 2006 Apr 2007 Aug 2007 Dec 2006 Apr 2008 T1 T2 T3 T4 T5 T6 T7
According to formula 5, we normalize all of the variables between 0 and 1. This can help to avoid the affect of the different dimension of different variables. Finally, we get a table with 12 variables and 5633 samples and any sample repeats in the seven different periods.
5. Modeling and Explanation
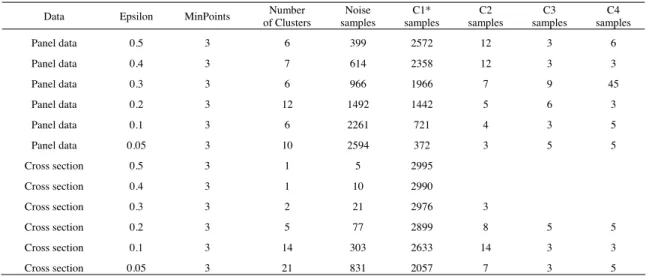
Our changes to the existing algorithms are the calculation of distance. So, we can examine our new method by any distance based clustering. In order to find different type clusters, we use DBSCAN to examine our idea. We compare the performance of DBSCAN both on the traditional cross section and the new panel data. In order to calculate quickly, 3000 instances are randomly sampled from the 5633 instances as we described above. The cross section is gotten by adding all the value of the seven periods together. To detect the different patterns, we set MinPoints of DBSCAN to 3 and vary the value of epsilon from 0.5 to 0.1. All of the experiment results are displayed in table 3.
Table 3. The result of the comparison experiment
Data Epsilon MinPoints of Clusters Number samples Noise samples C1* samples C2 samples C3 samples C4
Panel data 0.5 3 6 399 2572 12 3 6 Panel data 0.4 3 7 614 2358 12 3 3 Panel data 0.3 3 6 966 1966 7 9 45 Panel data 0.2 3 12 1492 1442 5 6 3 Panel data 0.1 3 6 2261 721 4 3 5 Panel data 0.05 3 10 2594 372 3 5 5 Cross section 0.5 3 1 5 2995 Cross section 0.4 3 1 10 2990 Cross section 0.3 3 2 21 2976 3 Cross section 0.2 3 5 77 2899 8 5 5 Cross section 0.1 3 14 303 2633 14 3 3 Cross section 0.05 3 21 831 2057 7 3 5
* The number of cluster varies under different parameter setting. We just list four clusters of every setting. C1 means the number of samples of cluster 1.
From the table, we can see that as the epsilon become smaller, the number of clusters increases with the same MinPoints. However the number of cross data clusters increases more quickly than the panel data. The cluster numbers of the two data structures are also displayed in figure 2. The cluster number of panel data is more robust than the cross section data. The cluster number of cross section data is quite sensitive to the parameter epsilon. Panel data can help to find proper number of cluster in clustering process.
7KHQXPEHURIFOXVWHUVRIWKHGDWD &URVV'DWD 3DQHO'DWD
Fig. 2. The number of clusters of the data
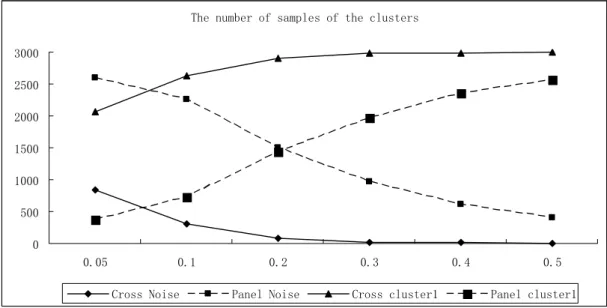
As we mentioned above, the advantage of panel is to detect the difference which can not be identified in the traditional data structure. The experiment results also support this view. The number of samples of noise and cluster 1 is displayed in figure 3. When the epsilon is set to 0.5, 2995 of 3000 cross section samples are clustered to one cluster and only 5 of them are noise. However, 399 samples are detected as noise under the same parameter setting when panel data used. Although more clusters are detected as the epsilon become smaller of cross data, most of the samples (more than 2000) of cross section are clustered into one cluster.
7KHQXPEHURIVDPSOHVRIWKHFOXVWHUV
&URVV1RLVH 3DQHO1RLVH &URVVFOXVWHU 3DQHOFOXVWHU
Fig. 3. The number of samples of the cluster
From above comparison, we can get that the panel data structure can help to find more clusters and identify the noisy samples. Based on the traditional cross section data, most samples are clustered into one classification. With the help of panel data, more noisy samples are identified.
6. Conclusions
In this research, we introduced data mining to a new data structure panel data. In particular, we applied data clustering algorithms to panel data analysis. A new distance measurement is proposed in this study. The distance can be measured with equal distance or weighted distance. If the users of panel data clustering want to focus on the recent data, he/she can put more weight on the recent data.
This research can overcome the shortcomings of traditional data structure which only store information of cross section. Based on density-based algorithm named DBSCAN, we examine the performance of our proposed measurement with real panel data of credit card behaviours. At present, credit card is more and more used in China. We analyze the groups of different customers by the behaviours of the credit cards holders. We split the time window into seven periods. After the pre-process process, we get a 39731 samples dataset with 5633 cross sections and 7 periods. The result shows that more accurate knowledge can be found with the panel data structure. The cluster number of panel data is more robust than the cross section data. The cluster number of cross section data is quite sensitive to the parameter epsilon.
In this paper, we only introduce clustering into the panel data. In the future, we can introduce more data mining algorithms into this data structure like classification, association rule to discover more hidden knowledge from the panel data.
Acknowledgements
The authors are very grateful to the anonymous bank that supplied the data to finish the analysis. This research has been partially supported by The CAS Special Grant for Postgraduate Research, Innovation and Practice, President Fund of (GUCAS) (A) (Grant No.085102HN00), National Natural Science Foundation of China (Grant No. 70840010, 70921061, 70621001, 70531040, 70871111), Beijing Natural Science Foundation (No.9073020) and the BHP Billiton Cooperation of Australia.
References
1. Hsiao, C., Analysis of panel data 2003, Cambridge: Cambridge University Press. 2. Baltagi, B., Econometric Analysis of Panel Data. 2001 New York: Wiley.
3. Kapetanios, G., Cluster analysis of panel data sets using non-standard optimisation of information criteria.
Journal of Economic Dynamics & Control, 2006. 30: p. 1389-1408.
4. Wang, H.-F. and Z.-W. Chan, A Pruning Approach to Pattern Discovery International Journal of Information Technology & Decision Making 2008. 7(4): p. 721-736.
5. Nie, G., et al., Decision analysis of data mining project based on Bayesian risk. Expert Systems with Applications, 2009. 36: p. 4589-4594.
6. Peng, Y., et al., A Descriptive Framework for the Field of Data Mining and Knowledge Discovery
International Journal of Information Technology & Decision Making 2008. 7(4): p. 639-682. 7. Zhang, Q. and R.S. Segall, Web Mining: A Survey of Current Research, Techniques, And Software.
International Journal of Information Technology & Decision Making 2008. 7(4): p. 683-720.
8. Cao, L., et al., Activity Mining: From Activities to Actions. International Journal of Information Technology & Decision Making 2008. 7(2): p. 259-273.
9. Kaufman, L. and P. Rousseeuw, Finding Groups in Data: an Introduction to Cluster Analysis. 1990: John Wiley & Sons.
10. Ester, M., et al. A Density-Based Algorithm for Discovering Clusters in Large Spatial Databases with
Noise. in Second International Conference on Knowledge Discovery and Data Mining. 1996.
11. Al-Aomar, R. and F. Dweiri, A Customer-Oriented Decision Agent for Product Selection In Web-Based
ServicesInternational Journal of Information Technology & Decision Making 2008. 7(1): p. 35-52.
Political Science Review, 1995. 89(3).
13. Chen, S.Y. and X. Liu, Data mining from 1994 to 2004: An application orientated review. International Journal of Business Intelligence and Data Mining, 2005. 1(1): p. 4-21.
14. Sim, J., Critical success factors in data mining projects. 2003, Philosophy University of North Texas. 15. Zheng, T., et al., Panel Data Clustering and its Application to Discount Rate of B Stock in China, in 2009
Second International Conference on Information and Computing Science. 2009.
16. Nie, G., et al. Finding the Hidden Pattern of Credit Card Holder's Churn: A Case of China. in ICCS (2). 2009.