EVALUATING VALUE BASED FINANCIAL
PERFORMANCE MEASURES
By
Petrus Daniël Erasmus
Dissertation presented for the degree of Doctor of Philosophy at Stellenbosch University
Promotor: Prof. J.U. de Villiers Stellenbosch
DECLARATION
I, the undersigned, hereby declare that the work contained in this dissertation is my own original work and that I have not previously in its entirety or in part submitted it
at any university for a degree.
Signature
Date
Copyright © 2008 Stellenbosch University All rights reserved
SUMMARY
The primary financial objective of a firm is the maximisation of its shareholders’ value. A problem faced by the shareholders of a firm is that it is difficult to determine the effect of management decisions on the future share returns of the firm. Furthermore, it may be necessary to implement certain monitoring costs to ensure that management is focused on achieving this objective. A firm would, therefore, benefit from being able to identify those financial performance measures that are able to link the financial performance of the firm to its share returns. Implementing such a financial performance measure in the valuation and reward systems of a firm should ensure that management is aligned with the objective of shareholder value maximisation, and rewarded for achieving it.
A large number of traditional financial performance measures have been developed. These measures are often criticised for excluding a firm’s cost of capital, and are considered inappropriate to be used when evaluating value creation. Furthermore, it is argued that these measures are based on accounting information, which could be distorted by Generally Accepted Accounting Practice (GAAP). Studies investigating the relationship between these measures and share returns also provide conflicting results. As a result of the perceived limitations of traditional measures, value based financial performance measures were developed. The major difference between the traditional and value based measures is that the value based measures include a firm’s cost of capital in their calculation. They also attempt to remove some of the accounting distortions resulting from GAAP.
Proponents of the value based measures present these measures as a major improvement over the traditional financial performance measures and report high levels of correlation between the measures and share returns. A number of studies containing contradictory results have been published. On the basis of these conflicting results it is not clear whether the value based measures are able to outperform the traditional financial performance measures in explaining share returns. The primary objectives of this study are thus to:
• Determine the relationship between the traditional measures earnings before extraordinary items (EBEI) and cash from operations (CFO), and shareholder value creation;
• Investigate the value based measures residual income (RI), economic value added (EVA), cash value added (CVA) and cash flow return on investments (CFROI), and to determine their relationship with the creation of shareholder value;
• Evaluate the incremental information content of the value based measures above the traditional measures.
The information content of the traditional measures and the value based measures are evaluated by employing an approach developed by Biddle, Bowen and Wallace (1997). The first phase of this approach entails the evaluation of the relative information content of the various measures in order to determine which measure explains the largest portion of a firm’s market-adjusted share returns. The second phase consists of an evaluation of the incremental information content of the components of a measure in order to determine whether the inclusion of an additional component contributes statistically significant additional information beyond that contained in the other components. The study is conducted for South African industrial firms listed on the Johannesburg Securities Exchange for the period 1991 to 2005.
The data required to calculate the measures investigated in the study are obtained from the McGregor BFA database. This database contains annual standardised financial statements for listed and delisted South African firms. It also contains EVA, cost of capital and invested capital amounts for those firms listed at the end of the research period. Including only these listed firms in the research sample would expose the study to a survivorship bias. Hence these values are estimated for those firms that delisted during the period under review by employing a similar approach to the one used in the database. The resulting sample consists of 364 firms providing 3181 complete observations. Since different information is required to calculate the various measures included in the study, different samples are compiled from this initial sample and included in the tests conducted to evaluate the information content of the measures.
The results of this study indicate that the value based measures are not able to outperform EBEI in the majority of the relative information content tests. Furthermore, the measures EVA, CVA and CFROI are also not able to outperform the relatively simple value based measure RI. The results from the incremental information content tests indicate that although some of the components of the value based measures provide statistically significant incremental information content, the level of significance for these relatively complex adjustments is generally low.
Based on these results, the claims made by the proponents of the value based measures cannot be supported. Furthermore, if a firm intends to incorporate its cost of capital in its financial performance measures, the measure RI provides most of the benefits contained in the other more complex value based measures.
OPSOMMING
Die hoof finansiële doelwit van ʼn firma is die maksimering van aandeelhouerswelvaart. Dit kan egter moeilik wees vir ʼn firma se aandeelhouers om te bepaal watter uitwerking bestuursbesluite op die toekomstige aandeelopbrengs van die firma sal hê. Voorts kan dit nodig wees om sekere moniteringskoste aan te gaan ten einde te verseker dat die bestuur hierdie hoofdoelwit voor oë hou. Dit behoort dus tot ʼn firma se voordeel te wees om daardie finansiële-prestasiemaatstawwe te identifiseer wat ʼn verband toon tussen die finansiële prestasie van die firma en die aandeelopbrengs. Die inwerkingstelling van so ʼn finansiële-prestasiemaatstaf in die waardasie- en beloningstrukture van die firma sal verseker dat die bestuur voortdurend na die maksimering van aandeelhouerswelvaart streef en ook vergoed word indien hulle hierdie doelwit bereik.
ʼn Groot aantal tradisionele finansiële-prestasiemaatstawwe is reeds ontwikkel. Hierdie maatstawwe word egter gereeld gekritiseer omdat dit die firma se koste van kapitaal van waardeberekeninge uitsluit en word dus as ontoereikend beskou om waardeskepping te evalueer. Daar word verder aangevoer dat hierdie maatstawwe op rekeningkundige inligting gegrond is wat moontlik deur Algemeen Aanvaarde Rekeningkundige Praktyk (AARP) verwring kan word. Studies wat die verwantskap tussen hierdie maatstawwe en aandeelopbrengs ondersoek, lewer ook teenstrydige resultate op. As gevolg van die veronderstelde beperkings van die tradisionele maatstawwe, is waardegebaseerde finansiële-prestasiemaatstawwe ontwikkel. Die vernaamste verskil tussen tradisionele en waardegebaseerde maatstawwe is dat laasgenoemde die firma se koste van kapitaal by waardeberekeninge insluit. Waardegebaseerde maatstawwe poog ook om sommige van die rekeningkundige verwringings wat uit AARP spruit, uit te skakel.
Voorstanders van waardegebaseerde maatstawwe beskou dit as ʼn aansienlike verbetering op tradisionele maatstawwe en rapporteer hoë vlakke van korrelasie tussen die maatstawwe en aandeelopbrengste. ʼn Aantal studies met teenstrydige resultate is egter ook gepubliseer en maak dit dus moeilik om te bepaal of waardegebaseerde maatstawwe tradisionele maatstawwe in die verklaring van aandeelopbrengste oortref.
Die hoofdoelwitte van hierdie studie is derhalwe om
• die verwantskap tussen die tradisionele maatstawwe verdienste voor inagneming van buitengewone items (“EBEI”) en kontant uit bedryfsaktiwiteite (“CFO”), en aandeelhouerswelvaartskepping te bepaal;
• die waardegebaseerde maatstawwe residuele inkomste (“RI”), ekonomiese waarde toegevoeg (“EVA”), kontantwaarde toegevoeg (“CVA”) en kontantvloei-rentabiliteit van investering (“CFROI”) te ondersoek en hulle verwantskap met aandeelhouerswelvaartskepping te bepaal; en
• die inkrementele inligtingsinhoud van waardegebaseerde maatstawwe teenoor dié van tradisionele maatstawwe te evalueer.
Die inligtingsinhoud van die tradisionele sowel as die waardegebaseerde maatstawwe is met behulp van ʼn benadering geëvalueer wat deur Biddle, Bowen and Wallace (1997) ontwikkel is. Die eerste fase van hierdie benadering behels die evaluasie van die relatiewe inligtingsinhoud van die onderskeie maatstawwe ten einde te bepaal watter maatstaf die grootste gedeelte van ʼn firma se mark-aangepaste aandeelopbrengs verklaar. Die tweede fase bestaan uit ʼn evaluasie van die inkrementele inligtingsinhoud van die komponente van ʼn maatstaf om te bepaal of die insluiting van ʼn bykomende komponent statisties beduidende addisionele inligting bied bo en behalwe wat reeds deur die ander komponente verskaf word. Die studie is uitgevoer vir Suid-Afrikaanse nywerheidsfirmas wat in die tydperk 1991 tot 2005 op die Johannesburgse Effektebeurs genoteer was.
Die nodige data vir die berekening van die maatstawwe in hierdie studie is van die McGregor BFA-databasis verkry. Hierdie databasis bevat jaarlikse, gestandaardiseerde finansiële state vir genoteerde en gedenoteerde Suid-Afrikaanse firmas. Dit bevat ook ekonomiese waarde toegevoeg, koste van kapitaal en geïnvesteerde-kapitaalbedrae vir firmas wat aan die einde van die navorsingstydperk genoteerd is. Die insluiting van slegs hierdie genoteerde firmas by die navorsingsteekproef sou die studie egter aan ʼn oorlewingsydigheid blootstel. Daarom is bogenoemde waardes ook vir die firmas wat in die loop van die navorsingstydperk gedenoteer is, beraam met behulp van ʼn soortgelyke benadering as die een wat in die databasis gebruik is. Die gevolglike steekproef bestaan uit 364 firmas waaruit 3 181 volledige waarnemings gemaak kon word. Aangesien verskillende inligting nodig was om die onderskeie maatstawwe in hierdie studie te bereken, is verskillende steekproewe uit hierdie aanvanklike steekproef saamgestel en by die toetse ingesluit waarmee die inligtingsinhoud van die maatstawwe geëvalueer is.
Die resultate van hierdie studie dui daarop dat die waardegebaseerde maatstawwe in die meerderheid van die relatiewe-inligtingsinhoudtoetse nie daarin kon slaag om EBEI te oortref nie. Voorts kon die maatstawwe EVA, CVA en CFROI ook nie die betreklik eenvoudige waardegebaseerde maatstaf RI oortref nie. Die resultate van die inkrementele-inligtingsinhoudtoetse dui daarop dat hoewel sommige van die komponente van die waardegebaseerde maatstawwe statisties beduidende inkrementele inligtingsinhoud verskaf, die vlak van beduidendheid vir hierdie betreklik komplekse aansuiwerings oor die algemeen laag is.
Op grond van hierdie resultate kan die voorstanders van waardegebaseerde maatstawwe se bewerings dus nie ondersteun word nie. Indien ʼn firma voorts van voornemens is om sy koste van kapitaal by sy finansiële-prestasiemaatstawwe in te sluit, sal die maatstaf RI die meeste van die voordele bied wat in die ander meer komplekse waardegebaseerde maatstawwe vervat word.
DEDICATION
This dissertation is dedicated to Prof. I.J. Lambrechts
ACKNOWLEDGEMENTS
Prof J.U. de Villiers, my promoter, for his guidance and support that enabled me to complete this study.
Dr Martin Kidd at the centre for statistical consultation, for his assistance with the statistical analyses.
The personnel at the McGregor BFA database, for their assistance.
My colleagues at the Department of Business Management, for their moral support throughout my study period.
Our Heavenly Father, for providing me with the strength, wisdom and courage to complete this study.
TABLE OF CONTENTS
Page
List of Tables……… vi
List of Figures………... ix
Chapter 1: Introduction: background, objectives and overview………… 1
1.1 Background to the study………... 1
1.2 Objectives of the study………. 2
1.2.1 Primary objectives……… 2
1.2.2 Secondary objectives……… 3
1.3 Hypotheses………... 3
1.4 Scope of the study……… 4
1.5 Research method……….. 4
1.5.1 Analysis of secondary literature………... 4
1.5.2 Primary research………... 5
1.6 Important terminology used in the text……… 6
1.7 Factors which constrained the study……… 7
1.8 Structure of the study………... 8
Chapter 2: Financial performance measures and value maximisation….. 10
2.1 Introduction……….. 10
2.2 The value of the firm……… 11
2.3 Shareholder value maximisation……….. 12
2.3.1 The agency issue……….. 16
2.4 Value based management………. 18
2.5 Discounted cash flow analysis………. 20
2.6 Measures of value………. 21
2.7 Traditional performance measures………... 24
2.8 Summary……….. 26
Chapter 3: Value based financial performance measures………... 28
3.1 Introduction……….. 28
3.2 Value based performance measures………. 29
3.3.1 Introduction……….. 31
3.3.2 Definition of EVA……… 32
3.3.3 Historical development of the measure……… 34
3.3.3.1 Economic profit……….... 34 3.3.3.2 Residual income………... 35 3.3.3.3 EVA……….. 36 3.3.4 Calculation of EVA……….. 37 3.3.4.1 Capital invested……… 38 3.3.4.2 NOPAT………. 38 3.3.4.3 Cost of capital………... 39 3.3.4.4 Return on capital……….. 41 3.3.4.5 Accounting adjustments………... 42 3.3.4.6 Inflation adjustments……… 45
3.3.5 The link between NPV and EVA………. 47
3.3.6 Relationship between EVA and shareholder wealth created……... 50
3.3.6.1 Supporting results………. 51
3.3.6.2 Contradictory results……… 54
3.3.6.3 Mixed results……… 58
3.3.6.4 Adopters vs. non-adopters……… 58
3.4 Cash value added……….. 61
3.4.1 Definition………. 61
3.4.2 Calculation of CVA...………... 61
3.4.3 Characteristics of CVA……… 62
3.4.4 CVA and shareholder value………. 63
3.5 Cash flow return on investment………... 64
3.5.1 Introduction……….. 64
3.5.2 Definition………. 65
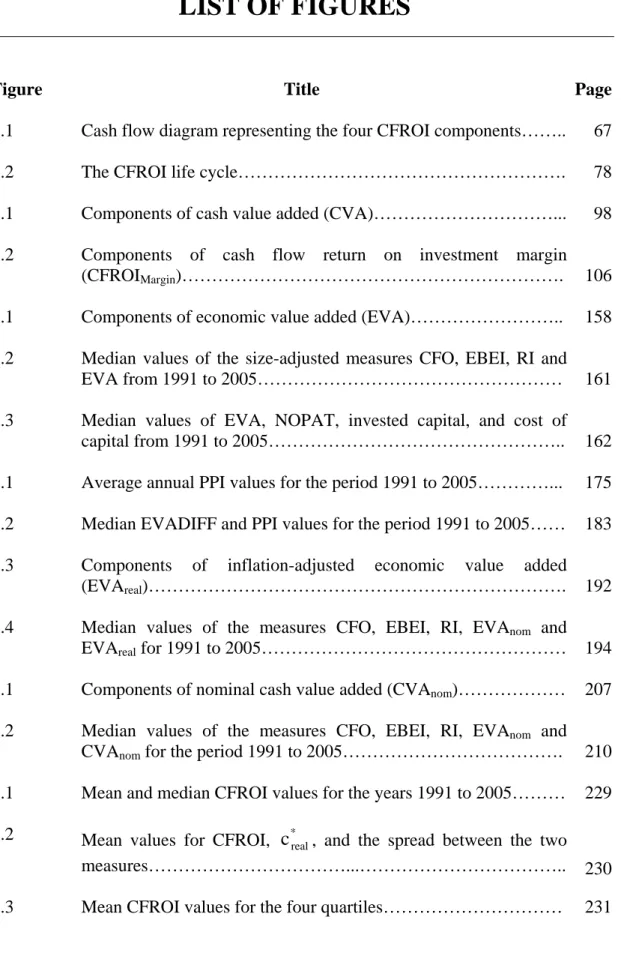
3.5.3 Calculation of CFROI...………... 66
3.5.3.1 Asset lifetime……… 68
3.5.3.2 Inflation-adjusted total assets………... 68
3.5.3.3 Inflation-adjusted depreciating assets……….. 68
3.5.3.4 Inflation-adjusted non-depreciating assets………... 69
3.5.3.5 Inflation-adjusted gross cash flow……… 69
3.5.3.6 Calculation ……….. 70
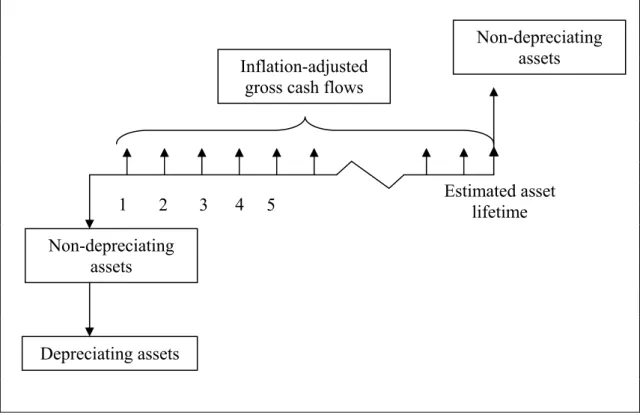
3.5.4 Interpretation of CFROI………... 71
3.5.4.1 Benefits of CFROI………... 73
3.5.4.2 Disadvantages of CFROI………. 74
3.5.5 Relationship between CFROI, NPV and EVA………. 75
3.5.6 CFROI valuation model………... 76
3.5.6.1 NCR……….. 77
3.5.6.2 Fade……….. 77
3.5.7 CFROI and share returns……….. 80
3.6 Summary……….. 80
Chapter 4: Research method……….. 90
4.1 Introduction……….. 90
4.2 Hypotheses………... 90
4.3 Statistical techniques……… 92
4.3.1 Tests for relative information content……….. 93
4.3.2 Tests for incremental information content………... 94
4.4 Components of the measures……… 94
4.4.1 Nominal measures……… 95
4.4.2 International accounting standard 15 inflation adjustments……… 98
4.4.2.1 Cost of sales adjustment………... 99
4.4.2.2 Depreciation adjustment………... 100
4.4.2.3 Gearing adjustment……….. 101
4.4.2.4 Inflation adjustment to property, plant and equipment……… 102
4.4.2.5 Cost of capital……….. 103
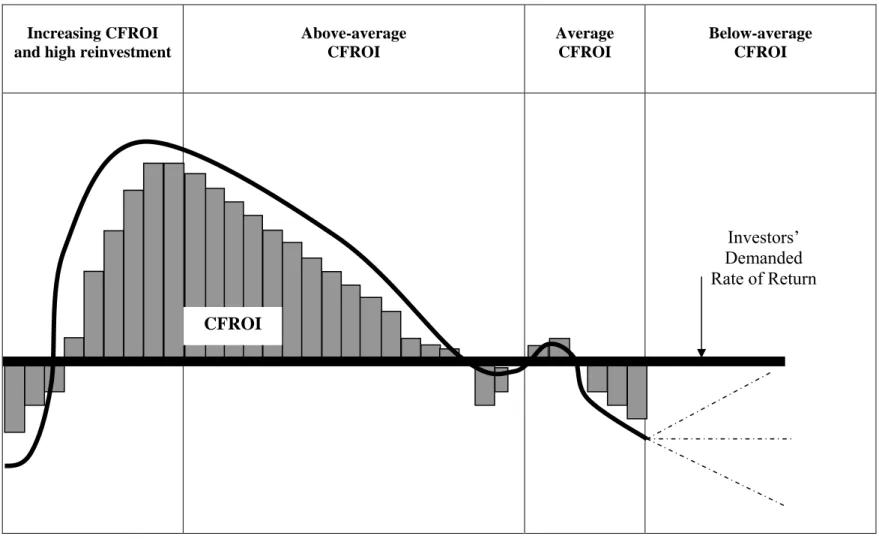
4.4.3 Inflation-adjusted EVA and CVA, and CFROI………... 103
4.5 Measures………... 107
4.5.1 Dependent variable………... 107
4.5.2 Independent variables………... 107
4.6 Data……….. 109
4.7 Summary……….. 110
Appendix 2: Calculation of the measures CFO, EBEI, RI, EVA and CVA…... 112
Appendix 3: Calculation of the inflation-adjusted versions of EVA and CVA... 128
Appendix 4: Calculation of the measure CFROI……… 136
Appendix 5: The listed and delisted industrial firms included in the final sample……… 149
Chapter 5: The information content of economic value added (EVA)……… 156
5.1 Introduction……….. 156
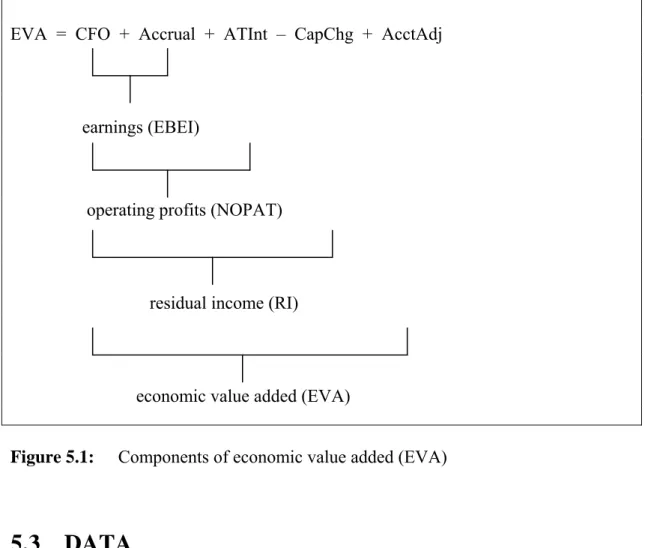
5.2 The components of EVA……….. 157
5.3 Data……….. 158
5.4 Descriptive statistics………. 159
5.4.1 Measures included in the relative information content tests……… 159
5.4.2 Components included in the incremental information content tests 163 5.5 Relative information content tests……… 164
5.6 Incremental information content tests of EVA components……… 166
5.7 Sensitivity analyses……….. 168
5.7.1 Dividing the sample into sub-periods………... 169
5.7.2 Five-year returns as dependent variable………... 169
5.7.3 Two-year returns……….. 170
5.8 Summary……….. 170
Chapter 6: The information content of inflation-adjusted EVA………. 172
6.1 Introduction……….. 172
6.2 The calculation of EVAnom and EVAreal………... 173
6.3 Differences between nominal and inflation-adjusted EVA……….. 176
6.3.1 Descriptive statistics………. 176
6.3.2 Differences between EVAnom and EVAreal………... 179
6.3.3 Regression analyses……….. 182
6.3.3.1 Differences between EVAnom and EVAreal………... 182
6.3.3.2 Changes in EVAnom and EVAreal……….. 189
6.4 The components of EVAreal……….. 191
6.5 Descriptive statistics………. 193
6.5.1 Measures included in the relative information content tests……… 193
6.5.2 Components included in the incremental information content tests 195 6.6 Relative information content tests……… 197
6.7 Incremental information content tests of EVAreal components…… 199
6.8 Summary……….. 201
Chapter 7: The information content of cash value added……….………… 204
7.1 Introduction……… 204
7.2 The components of CVA………... 205
7.3 Data……… 207
7.4 Descriptive statistics……….. 208
7.4.1 Measures included in the relative information content tests……….. 208
7.4.2 Components included in the incremental information content tests.. 211
7.5 Relative information content tests……….……… 213
7.6 Incremental information content tests of the CVAnom components... 215
7.7 Inflation-adjusted CVA and EVA……….. 218
7.8 Summary……… 223
Chapter 8: Cash flow return on investment……….. 225
8.1 Introduction……… 225
8.2 Data……… 226
8.4 CFROI fade characteristics……… 234
8.5 The components of CFROI……… 238
8.6 Descriptive statistics of the measures and components included in the information content tests……….. 241
8.6.1 Measures included in the relative information content tests……… 241
8.6.2 Components included in the incremental information content tests 243 8.7 Relative information content tests of CFROIMargin……… 245
8.8 Incremental information content tests of the CFROIMargin components……… 248
8.9 Summary……… 250
Chapter 9: Summary, conclusions and recommendations……….. 252
9.1 Introduction……… 252
9.2 Summary……… 253
9.3 Conclusions……… 258
9.4 Recommendations………...………... 260
9.5 Research challenges and future research....………... 262
LIST OF TABLES
Table Title Page
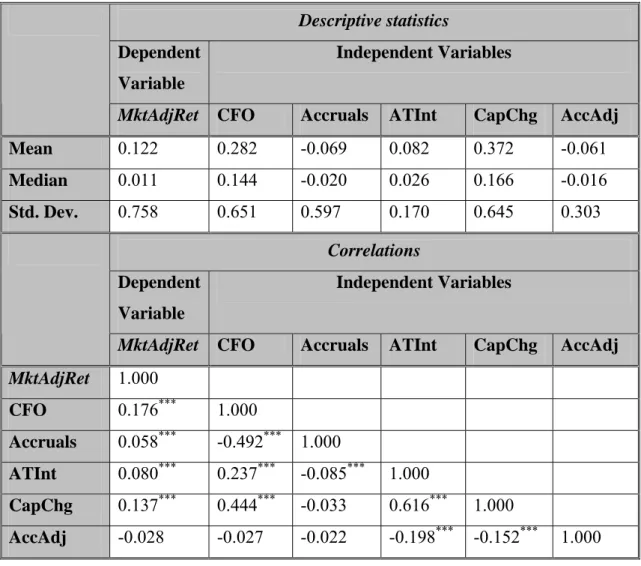
5.1 Descriptive statistics on the dependent and independent variables in the relative information content tests……… 160
5.2 Descriptive statistics on the dependent and independent variables in the incremental information content tests…………. 163
5.3 Tests of the relative information content of EVA, residual income, earnings and operating cash flow……… 165
5.4 Tests of incremental information content of EVA components: CFO, operating accruals, after-tax interest, capital charge,
accounting adjustments………. 167
6.1 Descriptive statistics of the measures EVAnom, EVAreal and their
components for the full period 1991 to 2005……… 176
6.2 Average and median values for the measures EVAnom, EVAreal
and their components for the three inflation sub-periods………. 178
6.3 Parametric tests of differences between EVAnom, EVAreal and
their components……….. 179
6.4 Non-parametric tests of differences between EVAnom, EVAreal
and their components……… 180
6.5 Correlations between the components of EVAnom and EVAreal… 181
6.6 Correlations between the variables used in regression
analyses... 185
6.7 Regression analyses of the difference between EVAreal and
EVAnom and inflation, level of gearing and asset structure……... 187
6.8 Regression analyses of change in EVAreal and EVAnom, and
changes of major components of EVA and inflation……… 190
6.9 Descriptive statistics on the dependent and independent variables in the relative information content tests of EVAreal…... 193
Table Title Page
6.10 Descriptive statistics on the dependent and independent variables in the incremental information content tests………... 196
6.11 Tests of the relative information content of EVAreal, EVAnom,
residual income, earnings and operating cash flow……….. 198
6.12 Tests of incremental information content of EVAreal
components: CFO, operating accruals, after-tax interest, capital
charge, accounting adjustments and inflation adjustments……... 200
7.1 Descriptive statistics on the dependent and independent variables in the relative information content tests of CVAnom
and EVAnom……….. 209
7.2 Descriptive statistics on the dependent and independent variables in the incremental information content tests of
CVAnom components………. 212
7.3 Tests of the relative information content of CVAnom, EVAnom,
residual income, earnings and operating cash flow……….. 214
7.4 Tests of incremental information content of CVAnom
components: CFO, operating accruals, after-tax interest, capital charge, accounting adjustments and cash value added
adjustments………... 216
7.5 Tests of the relative information content of CVAreal, EVAreal,
EVAnom, residual income, earnings and operating cash flow…... 220
7.6 Tests of incremental information content of CVAreal
components: CFO, operating accruals, after-tax interest, capital charge, accounting adjustments, inflation adjustments and cash
value added adjustments………... 221
8.1 Descriptive statistics of CFROI, * real
c and c*nomfor the full
period……… 227
8.2 Descriptive statistics of CFROI, * real
c and c*nomfor the three
five-year sub-periods……… 232
8.3 Changes in median CFROI values for the different fade
classes………... 237
8.4 Descriptive statistics on the dependent and independent variables in the relative information content tests of
Table Title Page
8.5 Descriptive statistics on the dependent and independent variables in the incremental information content tests of the
CFROIMargin components………... 244
8.6 Tests of the relative information content of CFROIMargin,
CVAreal, EVAreal, EVAnom, residual income, earnings and
operating cash flow………... 246
8.7 Tests of incremental information content of CFROIMargin
components: CFO, operating accruals, after-tax interest, capital charge, accounting adjustments, inflation adjustments, real cash
LIST OF FIGURES
Figure Title Page
3.1 Cash flow diagram representing the four CFROI components…….. 67
3.2 The CFROI life cycle………. 78
4.1 Components of cash value added (CVA)………... 98
4.2 Components of cash flow return on investment margin
(CFROIMargin)………. 106
5.1 Components of economic value added (EVA)……….. 158
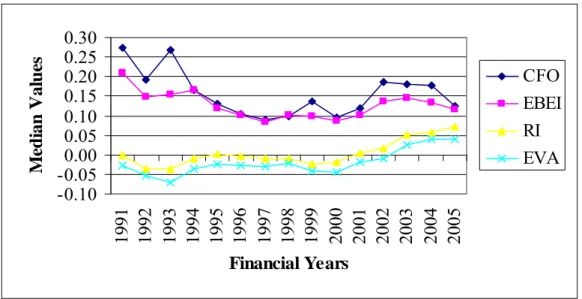
5.2 Median values of the size-adjusted measures CFO, EBEI, RI and
EVA from 1991 to 2005……… 161
5.3 Median values of EVA, NOPAT, invested capital, and cost of
capital from 1991 to 2005……….. 162
6.1 Average annual PPI values for the period 1991 to 2005…………... 175
6.2 Median EVADIFF and PPI values for the period 1991 to 2005…… 183
6.3 Components of inflation-adjusted economic value added
(EVAreal)………. 192
6.4 Median values of the measures CFO, EBEI, RI, EVAnom and
EVAreal for 1991 to 2005……… 194
7.1 Components of nominal cash value added (CVAnom)……… 207
7.2 Median values of the measures CFO, EBEI, RI, EVAnom and
CVAnom for the period 1991 to 2005………. 210
8.1 Mean and median CFROI values for the years 1991 to 2005……… 229
8.2 Mean values for CFROI, *
real
c , and the spread between the two
measures………...……….. 230
Figure Title Page
8.4 CFROI fade patterns for the periods 1991-1995, 1996-2000 and
2001 to 2005……….. 233
8.5 CFROI fade class construction……….. 235
8.6 Components of the cash flow return on investment margin
Chapter 1
INTRODUCTION: BACKGROUND, OBJECTIVES
AND OVERVIEW
1.1 BACKGROUND TO THE STUDY
The primary financial objective of a firm should be the maximisation of its shareholders’ value (Brigham & Houston, 2001: 16). All management decisions and strategies should contribute to this objective. Management, however, faces the problem of determining what the effect of its actions would be on the firm’s shareholder value. Net Present Value (NPV) techniques are often employed to translate management decisions and actions into financial figures, and to evaluate their value creating potential. Projects with positive NPV values contribute to the shareholder value of a firm, while the adoption of negative NPV projects result in a destruction of shareholder wealth (Young & O’Byrne, 2001: 25).
Value based financial performance measures are based on similar concepts as the NPV techniques (Peterson, 2000: 69). Maximising the value based measures should, therefore, result in the maximisation of NPV, and as such, should contribute to the creation of shareholder value. These measures provide an estimate of a firm’s economic profit by incorporating its total cost of capital in their calculation. In those cases where these measures yield positive values, economic profits are generated, and consequently shareholder value is expected to increase. Negative values indicate the destruction of shareholder value (Stewart, 1991: 174; Grant, 2003: 81).
Traditional financial performance measures exclude the firm’s cost of capital, and no provision is, therefore, made for the opportunity cost on the capital invested by the shareholders (Young & O’Byrne, 2001: 431). These traditional measures are also based almost exclusively on information obtained from financial statements, which
are compiled according to Generally Accepted Accounting Guidelines (GAAP). Consequently, these measures are exposed to accounting distortions (Stewart, 1991: 66; Peterson & Peterson, 1996: 10; Ehrbar, 1998: 80). Despite these limitations analysts and investors still widely apply the traditional measures (Stewart, 1991: 35; Ehrbar, 1998: 41). While some studies report statistically significant relationships with share returns (Peterson & Peterson, 1996: 45), others obtain far weaker results (Black, Wright and Davies, 2001: 51).
A number of different value based financial performance measures have been developed. These include, amongst others, Economic Value Added (EVA), Cash Value Added (CVA), and Cash Flow Return on Investment (CFROI). These measures include a firm’s cost of capital in their calculation (Fabozzi and Grant, 2000: 68). Attempts are also made to overcome some of the accounting distortions by adjusting information obtained from the financial statements (Young & O’Byrne, 2001: 205).
While proponents of these measures report high correlations between the measures and the creation of shareholder value (Stewart 1991: 2; Stewart 1994: 75; Walbert, 1994: 110; O’Byrne, 1996: 117), a large number of studies have yielded far weaker relationships (Biddle, Bowen & Wallace, 1997: 316; Chen & Dodd, 1997: 325; Farsio, Degel & Degner, 2000: 117). It is thus not clear whether the implementation of a value based measure will actually benefit a firm in its quest to maximise its shareholders’ value. It is against this background that this study will be conducted.
1.2 OBJECTIVES OF THE STUDY
1.2.1 PRIMARY OBJECTIVES
o To determine the relationship between the traditional financial performance measures and shareholder value creation.
o To investigate the value based measures EVA, CVA and CFROI, and to evaluate their relationship with the creation of shareholder value.
o To evaluate the incremental informational content of the value based performance measures above the traditional financial performance measures.
1.2.2 SECONDARY OBJECTIVES
o To implement a number of adjustments to the value based measures suggested in the literature, and to evaluate the influence of these adjustments.
1.3 HYPOTHESES
The information content of a financial measure refers to the additional information that the market deduces from its publication and incorporates into the expected future financial performance of the firm. The primary objective of this study is to compare traditional and value based financial performance measures in terms of their ability to evaluate shareholder value creation. In order to address the research objective, this study evaluates the relative information content of the measures investigated. Furthermore, the incremental information content of the contributing components of the various measures are examined to determine whether they contain significant information beyond that already included in the other measures investigated.
The following null hypotheses are, therefore, formulated:
H01: There are no differences in the information content of the various measures.
H02: A specific component of a measure does not provide information content
1.4 SCOPE OF THE STUDY
In the first part of the dissertation, a number of value based measures are identified and discussed. The focus is placed on their theoretical foundations, calculation and interpretation. An overview of existing studies reporting on the relationship between these measures and shareholder value creation is also provided.
The second part of the dissertation involves the empirical analysis of the measures. A number of traditional and value based financial measures are calculated for the period under review. Some of the adjustments to these measures recommended in the literature are also included. The relationships between the measures and shareholder value are investigated. The relative information contents of the individual measures are evaluated by applying an approach similar to the one applied by Biddle et al. (1997: 323). The incremental information content of the components of the value based measures over the traditional financial performance measures is also investigated.
1.5 RESEARCH
METHOD
1.5.1 ANALYSIS OF SECONDARY LITERATURE
A number of international and national academic publications are included in a thorough analysis of the existing literature on the subject. The objectives of the analysis of the secondary literature are to provide a summary of the theoretical backgrounds to the measures, to discuss their application and interpretation, and also to summarise the existing research focusing on the relationship between the measures and shareholder value. This is outlined in Chapters 2 and 3 of the dissertation.
1.5.2 PRIMARY RESEARCH
The objective of the primary research conducted in this study is to evaluate the information content of a number of financial performance measures. For this purpose, the measures earnings before extraordinary items (EBEI), operating cash flow (CFO), residual income (RI), economic value added (EVA), cash value added (CVA) and cash flow return on investment (CFROI) are calculated for a sample of South African firms listed in the industrial sector of the Johannesburg Securities Exchange (JSE). The study is conducted for a 15-year period from 1991 to 2005.
In order to evaluate the relative and incremental information content of the various independent variables, a similar approach to the one followed by Biddle et al. (1997: 311) is implemented. The different measures are included in individual regression analyses, and the adjusted R2 values are compared. Based on these results the relative information content of the measures can be evaluated. Previous years’ values are also included to evaluate the incremental informational content of a specific year’s value over the previous year’s value. By subdividing the various measures into their contributing components, the information content of specific components is also evaluated.
The results from the relative information content tests indicate that the value based measures are not able to outperform earnings when attempting to explain the variation in market adjusted share returns in the majority of cases investigated. Mixed results are also obtained from the incremental information content tests. It was found that although some of the components of the more complex value based measures added information content beyond that already contained in the more straightforward traditional financial performance measures, the level of statistical significance is generally low.
1.6 IMPORTANT TERMINOLOGY USED IN THE
TEXT
Incremental information content indicates whether one financial measure provides additional information over and above that provided by another measure.
Inflation-adjusted financial performance measures are the financial performance measures that are calculated after the inclusion of the inflation adjustments as proposed by International Accounting Statement 15.
The information content of a financial performance measure refers to the additional information that the market deduces from its publication and incorporates into the expected future financial performance of the firm.
Nominal financial performance measures are the financial performance measures that are calculated without making provision for changes in the purchasing power of money.
Relative information content refers to the information content of one financial measure compared to another.
Traditional financial performance measures are those measures that do not incorporate the firm’s cost of capital in their calculation, and are predominantly based on the accounting information contained in the financial statements of the firm.
Value based financial performance measures include a firm’s cost of capital in their calculation, and an attempt is also made to remove some of the accounting distortions contained in financial statement information resulting from the application of GAAP.
Value based management refers to the management process where the focus is continuously placed on shareholder value maximisation.
1.7 FACTORS WHICH CONSTRAINED THE STUDY
The following factors could constrain the study:
o EVA, invested capital and cost of capital figures are obtained from the McGregor BFA database (2005). This database, however, only contains these variables for firms that are listed at the end of the research period. The values are, therefore, not available for those firms that delisted during the period under review. Excluding these firms from the study would expose it to a serious survivorship bias. Consequently, these values are estimated using the same approach as the one that is applied to calculate the values in the database. A complete example of these estimations is provided in Appendix 2.
o The research method employed in this study requires financial data for at least two consecutive years. In those cases where firms changed their financial year-end, it sometimes results in a missing value during a specific year, and it thus reduces the number of data points that can be included in this study.
When EVA is calculated, the invested capital amount at the beginning of the financial year is also required. In order to calculate EVA values for two consecutive years, financial data for at least three years are, therefore, required.
o HOLT Value Associates, the consulting firm that promotes the measure CFROI, calculates a firm-specific discount rate that is applied to evaluate a firm’s CFROI values. These firm-specific discount rates are not available from publicly available data sources, and consequently inflation-adjusted cost of capital figures are used for this purpose.
1.8 STRUCTURE OF THE STUDY
This study consists of nine chapters. Chapter 1 contains a broad overview of the study. The background to the study, the primary and secondary objectives, the relevant hypotheses, the scope of the study, research method, important terminology, inhibiting factors and the general structure and overview of the contents of the chapters are provided.
Chapter 2 focuses on the concept of value. The chapter starts of by focusing on the value of a firm, whereafter the concept of shareholder value maximisation is addressed. A discussion of value based management, and the discounted cash flow valuation model is also provided. The prerequisites of measures of value are identified, and finally a brief discussion of the traditional financial performance measures is provided. An attempt is not made to evaluate these measures in detail; rather, the focus is placed on their limitations which lead to the development and increased popularity of the value based measures.
Chapter 3 discusses value based financial performance measures. It contains an overview of value based financial performance measures in general. The rationale behind the application of these measures, their objectives and some of their perceived benefits are highlighted. In the remaining part of the chapter the focus is placed on the three value based financial performance measures EVA, CVA and CFROI. The definitions, calculations and applications of these three measures are highlighted. An overview of the existing research focusing on the relationship between the measures and share returns is also provided.
Chapter 4 provides the research design applied for the primary analysis in the study. Standardised financial statements are obtained from the McGregor BFA database (2005) for a sample of industrial firms listed on the JSE during the period 1991 to 2005. The calculations of the measures and their contributing components that are investigated in the study are described, and examples of their calculations are provided in Appendices 2, 3 and 4. Since the database only provides the EVA values for firms listed at the end of the research period, the resulting survivorship bias is
addressed by estimating the corresponding values for delisted firms by using an approach similar to the database.
Chapter 5 contains the empirical results obtained from the evaluation of the relative and incremental information content of the measure EVA and its components.
Chapter 6 implements a number of inflation adjustments based on International Accounting Standard 15 (IAS15) and evaluates the resulting inflation-adjusted version of EVA.
Chapter 7 presents the results from the relative and incremental information content tests conducted for the measure CVA. In order to evaluate the influence of inflation on the measure, both a nominal and real version of CVA are evaluated.
Chapter 8 focuses on the measure CFROI. The results obtained from the relative and incremental information content tests of CFROI and its components are presented.
Chapter 9 provides a summary of the study’s results. The main conclusions are indicated, and recommendations regarding future research are also provided.
Chapter 2
FINANCIAL PERFORMANCE MEASURES AND
VALUE MAXIMISATION
2.1 INTRODUCTION
According to economic and finance theory, the major purpose of a firm is to create value. Value, however, could be considered from different points of view. A firm has different stakeholders and it needs to consider the effect of its actions on their value. In most cases firms follow an approach of shareholder value maximisation.
The concept of shareholder value maximisation is often criticised for only focusing on the financial situation of its shareholders. It is feared that this approach may result in an exploitation of the firm’s other stakeholders (Barsky, Hussein & Jablonsky, 1999: 602; George, 2003: 36). Counter arguments, however, indicate that this approach indirectly results in the maximisation of the other stakeholders’ value as well (Copeland, Koller & Murrin, 1994: 22).
In this chapter the concept of value is investigated. The chapter is divided into seven sections. Section one considers the value of a firm, while section two focuses on the concept of shareholder value maximisation. Section three highlights value based management. Section four introduces the discounted cash flow valuation model. Section five considers measures of value. Section six provides a brief discussion of the traditional financial performance measures. The focus is placed on the limitations of these traditional measures which lead to the development and increased popularity of the value based measures. The final section of the chapter contains a summary.
2.2 THE VALUE OF THE FIRM
According to Monks and Minow (2001: 46) corporate performance should be measured by considering the value created by a firm. The purpose of a firm is defined as long-term value creation (Monks & Minow, 2001: 34). Against this background it is possible to determine how the management of a firm should be organised to achieve this objective and how it should be motivated to ensure that it strives towards creating value. It can also be used by the shareholders of the firm to evaluate whether management has achieved this objective.
A firm has different capital providers. Shareholders contribute equity, while various capital providers supply different forms of debt capital. Since these capital providers are prepared to invest in the firm it could be argued that it has a certain responsibility towards them. Not only should management attempt to safeguard their capital contributions but it should also employ it in such a way that they are rewarded for it. When considering the value of a firm one possible approach is, therefore, to focus on the value created for all the capital providers.
A firm also has other stakeholders. Its employees, the society in which it operates, the government, the public sector and its suppliers are examples of these stakeholders. Although these stakeholders are not always directly involved in the management processes of the firm, management cannot simply ignore their situation. The effect of management actions on their well-being also needs to be considered. Failure to do so could have a negative influence on the financial performance of the firm.
The question arises on which value the focus should be placed. Should value be measured from the point of view of all the stakeholders in a firm or simply by focusing on the capital providers? Should a distinction be made between the value of the debt capital providers and the value of the shareholders?
According to Gapenski (1996: 56) some firms focus on the maximisation of their total market value. The total market value of the firm consists of the market values of its equity and debt capital. In order to maximise the firm’s total market value one or both
of these components could be increased. It is important to note that this approach will not necessarily be to the benefit of the shareholders. If the additional capital invested in the firm is not invested in profitable investment opportunities it will have a negative effect on its financial performance. The maximisation of total market value should, therefore, not be deemed a firm’s major objective.
In financial management theory it is generally accepted that the maximisation of the shareholders’ wealth should be the major objective of a firm (Brigham & Houston, 2001: 16). It was found that by allowing the shareholder value of the firm to be maximised the other stakeholders also benefited. In the following section the approach of shareholder value maximisation is considered.
2.3 SHAREHOLDER
VALUE MAXIMISATION
The concept of shareholder value maximisation has long been part of economic theory. The notion that management should maximise the value of a firm for its owners can be traced back to “The Wealth of Nations” published by Adam Smith in 1776 (Smith, 1909: 351). Shareholder value maximisation has nevertheless been criticised for focusing only on the wealth of the shareholders (George, 2003: 36; Barsky et al., 1999: 602). Other stakeholders in the firm, like the employees, debt providers, the community in which the firm is based, etc, are ignored. It is argued that by focusing on only the shareholder wealth the other stakeholders may in fact be disadvantaged.
The objectives of the different stakeholders vary. Employees, for instance, may be concerned about their remuneration, job stability and working conditions. Debt capital providers, on the other hand, may be concerned about the firm’s ability to meet their finance cost requirements and the repayment of their loans. Suppliers of raw materials may focus on the continued use of their products. Some of these objectives may result in a conflict of interest between the different stakeholders.
The different stakeholders are exposed to different levels of risk and their level of risk exposure normally determines their required return. Debt capital providers, for instance, are rewarded with finance costs that are based on their risk exposure. The finance cost represents a fixed and legally binding claim on the firm’s profits. In the case of secured debt they may also obtain a claim on specific assets in the case of default. Employees are prepared to earn a stable salary in return for job security and a relatively low level of risk exposure.
The shareholders of a firm are normally exposed to the highest level of risk. Not only do they need to wait until all other stakeholders have been rewarded but they also have no legal claim on the profits of the firm. In order to compensate them for this high level of risk they are rewarded with voting rights in the firm based on their shareholding. This enables them to exercise control over the management of the firm.
It could be argued that this control enables them to act in a detrimental way towards the other stakeholders and that they would do everything in their power to simply maximise their own short-term shareholder value. However, the shareholders are still last in line in terms of the expected benefits created by the firm. The only profit available to the shareholders for dividends or to increase their investment in the firm is the remaining amount after all the other stakeholders have been rewarded. Consequently they also need to consider all the information with regard to the other stakeholders when making their decisions (Copeland et al., 1994: 27).
Not only should they focus on maximising their own wealth, but they also need to ensure that the firm is managed in such a way that sufficient profits are generated to pay all its expenses. For instance, provision needs to be made for paying finance costs to the debt providers, paying the necessary taxes to the government, and compensating the suppliers of products for the items purchased from them.
Copeland et al. (1994: 25) point out that it would not be feasible to disadvantage any group of stakeholders over the long term. Even though it could lead to a short-term increase in their wealth it will eventually result in a decrease of their shareholder value. In extreme cases of mismanagement it could even result in the financial failure of the firm. Examples of these actions include reducing salaries and wages, which
could lead to the loss of valuable employees and a reduction in work morale, while the failure to pay taxes will result in hefty fines. Insisting on extreme discounts from suppliers could eventually cause them to become hesitant to continue their relationship with the firm.
The idea of shareholder value maximisation is consistent with the work of Adam Smith. In “The Wealth of Nations”, published in 1776, he indicates that the maximisation of the shareholder wealth eventually benefits society in general. According to Smith (1909):
Every individual endeavours to employ his capital so that its produce may be of greatest value. He generally neither intends to promote the public interest, nor knows how much he is promoting it. He intends only his own security, only his own gain. And he is in this led by an invisible hand to promote an end, which has no part of his intention. By pursuing his own interest he frequently promotes that of society more effectually than when he really intends to promote it (p. 351).
Smith, therefore, argues that by maximising his own wealth the owner of a firm contributes to the well-being of the other stakeholders. Employees, customers, and the society in general, either directly or indirectly, benefit from the success of the firm.
Copeland et al. (1994: 22) report that the same concept also applies in the case of a firm that is owned by a group of shareholders. Empirical results indicate that maximising the shareholders’ value does not disadvantage the other stakeholders. In fact, successful firms appear to generate greater value for all their stakeholders.
According to Copeland et al. (1994: 22) the following factors also support the implementation of a system that focuses on shareholder wealth:
o Value is the best measure of performance available. Most traditional performance measures tend to be one-dimensional and usually focus on only a specific aspect of a firm’s performance. Value, however, focuses on all the aspects relevant to the future financial performance of the firm and requires complete information.
o The shareholders are the only stakeholders who will focus on maximising the value of all the stakeholders. Copeland et al. (1994: 25) propose that the other stakeholders in a firm usually focus only on those aspects that have an influence on their own value. Allowing the debt providers, for instance, to maximise their value could result in extremely high finance costs. This would disadvantage all the other stakeholders since the payment of finance costs are usually legally enforceable.
Shareholders, on the other hand, are forced to interpret all information with regard to the firm. Furthermore, they are only rewarded after all the other stakeholders have been compensated.
o Capital will eventually be withdrawn from firms that do not maximise their value. Investors require a return on their investment that will compensate them for the risk to which they are exposed. According to Copeland et al. (1994: 27) investors will transfer their investment to another opportunity that does offer their required return if a firm is unable to provide this return. Firms failing to maximise their shareholder value could eventually find themselves in a position where they are unable to attract capital.
Over the last two decades the focus of firms has been directed towards the notion of value creation. Young and O’Byrne (2001: 5) ascribe this to the following changes:
o An increased level of globalisation and deregulation in capital markets;
o The end of most capital and exchange control systems;
o Highly liquid securities markets;
o Advances in information technology;
o Improvements in the regulation of capital markets;
o A change in investors’ attitude towards savings and investments;
o Increases in the size of the institutional investors.
As a result of these changes capital providers are able to move their investments between different investment opportunities with relative ease. The number of investors also increased considerably. Consequently firms need to place more emphasis on their capital position than before. Failure to do this will result in a higher cost of capital (Young & O’Byrne, 2001: 8). This exposes the firms to the risk of takeover activities, or in extreme cases, financial failure. Unless the firms are able to offset the higher capital cost with greater operating performances they will not be able to remain competitive.
Martin and Petty (2000: 4) indicate that some firms attempt to solve the conflict between the different stakeholders by not focusing on shareholder value maximisation. As a result, these firms ultimately end up destroying shareholder value.
2.3.1 THE AGENCY ISSUE
Ensuring that a firm always attempts to maximise shareholder value is difficult. One of the major problems experienced is referred to as the Agency Issue. Since it is impossible for all the different stakeholders to be directly involved in the management of a firm managers need to be appointed. As a result of the consequent corporate structure the shareholders lose some of their control over the firm (Monks & Minow,
2001: 3). Since management are required to make decisions on behalf of the shareholders a potential conflict of interest may arise (Brigham & Houston, 2001: 21).
This problem has been present for a considerable period of time. It is mentioned as follows by Adam Smith (1909) in “The Wealth of Nations”:
The directors of such companies, however, being the managers rather of other people’s money than of their own, it cannot be well expected, that they should watch over it with the same anxious vigilance with which the partners in a private copartnery frequently watch over their own. Like the stewards of a rich man, they are apt to consider attention to small matters as not for their master’s honour, and very easily give themselves a dispensation from having it. Negligence and profusion, therefore, must always prevail, more or less, in the management of the affairs of such a company.
According to Jensen and Meckling (1976: 306) a manager of a firm will engage in activities that would not necessarily lead to the maximisation of its shareholders’ value. In order to ensure that these types of actions are limited the shareholders of a firm need to implement systems that monitor management. The costs of these types of actions are referred to as agency costs.
They argue that by incurring monitoring costs it is possible to reduce the agency cost, since it will reduce management spending that is not adding to the value of the firm (Jensen & Meckling, 1976: 323). In order to monitor management, however, it is important to have a clear understanding of the relationship between the reported financial performance of a firm and its shareholder value creation. It would, therefore, be beneficial to identify those performance measures that have a strong relationship with shareholder value, since these measures could be employed when monitoring the firm’s management. By identifying the relevant financial performance measures, a decrease in the monitoring costs required could be achieved.
2.4 VALUE BASED MANAGEMENT
Copeland et al. (1994: 127) define Value Based Management (VBM) as the process of continuously maximising the value of a firm. According to them shareholder value creation is the main objective when applying VBM techniques. They argue that VBM is based on discounted cash flow (DCF) concepts (Copeland et al., 1994: 93). The value of the firm is determined by the present value of its future cash flows. Investing in projects where the return exceeds the cost of capital results in value creation, while investing in projects with returns below the cost of capital destroys value.
Young and O’Byrne (2001: 468) indicate that it is important to realise that the value of a firm is eventually determined by capital markets’ perception of its ability to generate future cash flows. They point out that when a VBM approach is adopted the future cash flows, as well as the cost of capital, of all investment opportunities should be carefully scrutinised. The interpretation of cash flow figures when used to evaluate historical financial performance, however, should be carefully conducted. Negative cash flows are not necessarily an indication of poor financial performance but may be the result of large investments required to generate future cash flows.
According to Copeland et al. (1994: 97) VBM is a combination of two elements. On the one hand, it consists of adopting a value-creation mindset throughout a firm. Each employee should understand that the financial objective is to maximise the value of the firm. They should understand that all their actions should be directed towards achieving this objective.
They also indicate that this value-creation mindset should be combined with the necessary management processes and systems to ensure that the employees would actually behave in a manner that creates value (Copeland et al., 1994: 98). Important factors to consider include the performance measures applied to evaluate employees, targets set, as well as the necessary incentive systems. Employees need to know exactly what targets they are trying to achieve.
Furthermore, employees should know how their performance will be evaluated. It is very important that the performance measures adopted should support the targets declared by the firm. In order to ensure that employees focus on the creation of shareholder value their performance need to be evaluated and rewarded in terms of the shareholder value created. A VBM system should thus ensure that employee compensation is linked to value based financial performance measures (Martin & Petty, 2000: 6).
Martin and Petty (2000: 9) consider the following three elements to be decisive in order to successfully implement a VBM system:
o The program must be supported by the top management of the firm. Without the support of top management the implementation of a VBM system will prove to be difficult. Top management should ensure that the program is implemented at all levels and in all the divisions of the firm. They should also continue to focus on its objectives at all times.
o A link between the performance and compensation of managers should be implemented. In order to motivate managers to strive towards the objectives of the VBM system they should be rewarded for achieving it. Compensation systems should focus on the performance required under the VBM system and managers should be rewarded accordingly.
o The VBM system should be understandable to all levels of employees. To ensure that the VBM system is implemented successfully in all divisions of the firm it is of great importance that all employees should understand it. Performance measures should be developed that are understandable and suitable for the different divisions. This may entail translating the performance measures into divisional value drivers.
An important aspect with regard to the success of VBM systems is raised by Martin and Petty (2000: 200). Although VBM systems appear to be implemented successfully they argue that the following factors also need to be considered:
o The accuracy of share price estimates obtained from discounted cash flow models. Martin and Petty acknowledge that although DCF methods provided reasonably accurate share price estimates, large prediction errors do occur. Since VBM methods are based on DCF methods these methods may be exposed to the same inaccuracies.
o The ability of the VBM measures to predict the market value of a firm’s shares. DCF methods estimate the value of a firm by calculating the present value of the expected future cash flows. Most of the VBM measures applied, however, are single-period performance measures. Martin and Petty indicate that the ability of these single-period measures to estimate share values could be questionable.
o The effect of the implementation of a VBM system on the performance of a firm. Martin and Petty (2000: 201) also question the long-term sustainability of a VBM system. They indicate that although it could be possible to improve the financial performance of a firm over the short-term it could become increasingly difficult to maintain this improvement over the long-term. Amongst others they refer to studies that report no statistically significant differences in the performances of firms applying VBM systems and those that do not over the long-term.
2.5 DISCOUNTED CASH FLOW ANALYSIS
For a firm to focus on the maximisation of shareholder value it is necessary to import a financial management system that would ensure that all levels of the firm engage in activities that will result in the creation of value. Applying DCF principles could ensure that this is achieved. According to Copeland et al. (1994: 22) this approach
has an extremely strong correlation with market value. They perceive it to be a superior measure of value since complete information is required when applying it to calculate the value of a firm. Not only are all future cash flows included in its calculation, but they are also evaluated on a risk-adjusted basis.
Under a DCF approach the expected future cash flows of the firm are estimated and discounted at an applicable discount rate. The discount rate reflects the time value of money, as well as the risk of the cash flows (Young & O’Byrne, 2001: 22).
Translating the DCF principles into value creating actions is usually accomplished by applying the NPV technique when evaluating investment opportunities. Projects with positive NPV contribute to the shareholder value of the firm, while negative NPV projects result in a destruction of shareholder wealth (Young & O’Byrne, 2001: 25).
2.6 MEASURES
OF
VALUE
One of the problems that management may face is to determine which measure should be used to evaluate and value corporate performance and value creation. According to Obrycki and Resendes (2000: 158) an ideal performance measure should not only focus on the financial performance of a firm, but should also provide an indication of what it is worth. The correlation between such a measure and the firm’s market value should consequently be high. But in practice this is not always the case. A number of studies report that the majority of the accounting based performance measures exhibit weak correlations with market values (Black et al., 2001: 51; Obrycki & Resendes, 2000: 158).
According to Peterson (2000: 95) a performance measure should meet the following criteria:
o The effects of different accounting methods should be removed. The reported financial performance of a firm could be greatly influenced by its choice of accounting method. An ideal performance measure should thus aim to remove the effect of different accounting methods. This promotes the comparability of the measure between different firms.
o The measure should be future-orientated. In order to evaluate management’s decisions the expected future results of these decisions should be investigated. It is not sufficient to consider the historical financial performance of the firm and to assume that it will necessarily continue in future.
o The measure should incorporate risk. Different projects expose a firm to different levels of risk. In order to facilitate the comparison between the different projects a performance measure should make provision for risk. The same concept also applies to the comparison of different firms. Consequently an ideal performance measure should incorporate risk in its calculation.
o Uncontrollable factors should be excluded from the measure. Factors not under the influence of the management of a firm should not be reflected in a performance measure. Examples of these factors include general market movements, changes in a firm’s regulatory requirements, and economic changes. Since management cannot influence these factors it should be excluded from the performance measures applied to evaluate their performance.
Young and O’Byrne (2001: 34) also identify the following factors that performance measures need to address:
o The measures should be calculable at the divisional level. In order to ensure that the measures are understandable to employees on all the levels of the firm it is important that they can be translated to the divisional level. If it is not possible to calculate the measure within a division alternative measures that will support it need to be defined. Some firms also transform performance measures into value drivers that may be easier to interpret and apply at the divisional level.
o The measures should be flow measures. To evaluate a firm over time it is important to apply a flow measure. Flow measures are calculated for a certain period of time, while stock measures evaluate the firm at a specific point in time. Since value creation is a long-term process applying flow measures are more suitable that stock measures.
o The measures should promote the creation of shareholder value. Since the objective of a firm is to maximise its shareholders’ value the performance measures applied within it should contribute to the achievement of this objective. Implementing a performance measure that is not focused on the creation of shareholder value may result in the opposite being achieved.
A considerable number of measures have been developed to value corporate performance. While most of the traditional measures attempt to evaluate the financial performance of a firm they are often criticised for failing to consider value creation. Value based performance measures are often proposed as an improvement on the traditional measures, since they focus both on financial performance as well as the value created by a firm.
In the following section of this chapter an overview of the traditional financial performance measures are provided. The major arguments against the use of these
measures when evaluating shareholder value creation are highlighted. Based on these perceived limitations, the focus is placed on the value based measures in Chapter 3.
2.7 TRADITIONAL
PERFORMANCE
MEASURES
Financial performance measures provide a valuable tool to the different stakeholders of a firm. Internally these measures may be utilised by the management and existing shareholders to evaluate the past financial performance and the current financial position of a firm. Alternatively, it can also be used by potential shareholders and financial analysts to predict future financial performance (Brigham & Houston, 2001: 89).
Yook (1999: 36) and Yook and McCabe (2001: 77) point out that traditional accounting measures are often criticised because they are not able to guide a firm’s strategic decisions in such a way that shareholder value is maximised. Mixed results are obtained when evaluating the ability of these traditional performance measures to quantify shareholder value creation. In some studies little or no relationship between traditional accounting measures and future share performance is reported (Black et al., 2001: 51; Obrycki & Resendes, 2000: 158; Copeland et al., 1994: 77). In other studies these measures are found to provide valuable information regarding expected performance (Peterson & Peterson, 1996: 45). Mixed results are also obtained when comparing the ability of the traditional measures to predict share prices with that of the value based measures (Peterson & Peterson, 1996: 38; Young & O’Byrne, 2001: 431).
It is argued that the traditional measures of financial performance, such as earnings, cash flow values, various profitability, turnover, liquidity and solvency ratios, etc, are not suitable as measures of value creation in general. In most cases they are single-period measures. Furthermore they are based on accounting figures, exposing them to the distorting effects of GAAP.