ISSN 1443-1475 © 2007 Shannon Research Press. http://www.iejcomparative.org 57
Corrosive inequality? Structural determinants
of educational and occupational expectations
in comparative perspective
Joanna Sikora The Australian National University
Lawrence J. Saha The Australian National University
[email protected] Previous research has shown that “life plan” expectations among 15 year olds are unexpectedly higher in less developed than developed countries (Saha 1992). To further explore this finding we analyse data from the 2000 and 2003 PISA surveys and find that inequality, operationalised by the Gini index, moderately but significantly increases educational and occupational expectations. This holds after controlling for academic ability, gender, family background (comprising parents’ education, occupation and the size of the home library) and a number of school characteristics. Prior studies have established that economic inequality is negatively related to the actual performance of high school students. However, we find that inequality is positively correlated with students’ expectations. This is counterintuitive because we know that higher expectations are related to higher levels of academic achievement. We discuss a number of theories to explain our findings and also the possible implications. [Key words: Educational expectations, occupational expectations, PISA,
educational achievement, inequality]
Earlier versions of this paper were presented at the annual conference of the Australian and New Zealand Comparative and International Education Society, Canberra, December 2006, and at the RC28 Conference of the International Sociological Association, Brno, Czech Republic, May 2007
Introduction
In this article we seek to accomplish two goals. The first goal is to analyse further the persistent finding that relatively deprived groups of people have higher levels of career ambitions than their social positions imply. The second is to investigate whether or not there are societal level effects on this type of individual behaviour, in addition to individual level effects. We carry out our investigation using hierarchical linear modelling, and the 2000 and 2003 Program for International Student Assessment (PISA) data sets. We first describe the problematic research background of our topic, followed by our analysis. Then we examine possible theoretical
explanations for our findings, and the substantive implications for our understanding of the multilevel effects on social behaviour.
Research on Aspirations, Expectations and Attainments
For more than fifty years social scientists have known that educational attainment was directly related to occupational attainment. Although it was debated whether or not various forms of occupational attainment could occur independently of education (Berg 1970; Collins 1979), for the most part it was recognised that the skills and knowledge required for increasingly complex manufacturing and industrial economies could best be acquired through education. The rapid rise in educational participation following World War II in most Western countries was seen, at least by some, as a necessary precursor to rapid and healthy economic growth (Dronkers & van der Ploeg 1997).
Early research on educational and occupational attainments focused on the family, and in particular on the different social and economic resources which gave an advantage to sons and daughters. But it was soon recognised that culture, values, motivation, ambition, desires and expectations also played a role in both educational and occupational attainments. Because these were seen to be transmitted through exposure to family socialisation, they were perceived to be part of the resources which determined advantage or disadvantage. It was the development of the Wisconsin Model of occupational attainment which established the position of these social psychological variables in subsequent educational and occupational attainment research (Sewell, Haller & Portes 1969).
Since then, research literature using these social psychological variables to explain educational and occupational attainments has been extensive, not only in stratification research, but also in fields such as comparative education and the study of socio-economic development. Depending on the nature of the research questions, these studies developed into traditions which occurred in relative isolation from one another. In the following discussion, we organise our review of the literature into what we call two research traditions: 1) the social psychological/socialisation tradition, and 2) the stratification/allocation tradition.i
The Social Psychological and Socialisation Tradition
Early social psychological attempts to explain success in attainments recognised both the individual and societal levels, for example in the study of “ambitions” by Turner (1964)ii, and societies’ levels of “need for achievement” by McClelland (1961).iii Other writers argued that through socialisation young students develop “role maps” (Musgrave 1967) or “a rough sketch of some course of action” (Alexander & Cook 1979) which included information about occupations and the appropriate credentials needed for their attainment. However, because these concepts were somewhat imprecise, researchers began to use the concepts of “aspiration” and “expectation”.
The distinction between “aspirations” and “expectations” was recognised early because of the awareness that the former measured life plans which were relatively unaffected by perceived social restraints, while the second concept took into account the recognition of social constraints.iv The first concept was seen as possibly “unrealistic”, while the second was seen as more “realistic” (Caro & Pihlblad 1965; Desoran 1977/1978; Empey 1956; Han 1969; Saha 1983; Saha 1997).
Since the 1970s considerable research has focused on the aspirations or expectations of various social groups, for example men and women, migrants, and students from different socioeconomic backgrounds. Many of these studies also produced unexpected results in that students from disadvantaged groups often had higher than expected levels of aspirations and expectations (Khattab 2003; Portes, McLeod & Parker 1978; Saha 1983; Feliciano & Rumbaut 2005, Wells, Bills, Park & Chen 2007).
This counterintuitive pattern was also found to exist among school students in developed and developing countries. For example Little (1978), working with 14 year-old students from the first IEA science study, observed that students from less developed countries, such as Chile, India, Iran and Thailand, had higher levels of educational and occupational expectations, in spite of the fact that in these countries the “accommodation rate” (the ability to accommodate these expectations) was the lowest. She explained these apparent discontinuities in terms of the “…different
rationality of students in developed and developing countries” (1978: 19), such that
giving a high value to education for expected upward mobility may appear rational to students in rapidly changing societies, even if such prospects are unlikely.
This pattern persisted even when additional variables were added, such as school-specific cultures and practices (Saha 1982; Saha 1992). Therefore, as the research literature grew, it became apparent that the impacts on student aspirations and expectations actually occurred at several different analytical levels, namely the individual, the school, and the society.
These earliest studies of educational and occupational aspirations and expectations were restricted to the level of the individual. If the social context, for example the type of school, was taken into account, the variable was simply nested in other variables and treated as an individual level characteristic. Two developments occurred which subsequently made it possible to overcome these difficulties. First, the statistical techniques began to be developed, particularly with respect to educational issues, which made it possible to analyse three levels simultaneously (Saha & Keeves 2003). Second, new data sets, such as IEA and PISA, emerged which could support the analysis of second-level (school) or third level (country) effects on a wide range of school outcome variables.
Underneath this body of research was a conceptual problem: What is the meaning of the discrepancy between these aspirations and expectations and the actual attainment behavior? Do expectations enhance subsequent attainment, or are they mere “flights of fancy” which, at best, deepen frustration among the unsuccessful? (Alexander & Cook 1979). Studies in Canada (Porter, Porter, & Blishen 1982), Australia
(Carpenter & Fleishman 1987) and the United States (Haller, Luther, Meier & Ohlendorf 1974) showed that students who had higher levels of aspirations and expectations tended to have significantly higher levels of educational and occupational attainments. This was also found to be the case in Costa Rica (Hansen 1973) and Brazil (Hansen & Haller 1973). Therefore, the cumulative empirical research evidence on these motivational social psychological variables did support the existence of a causal link between them and attainment behaviours.
The Social Stratification and Allocation Tradition
A second body of research emerged, most distinctly during the 1960s, among sociologists who were concerned with social stratification and social mobility. Although educational and occupational aspirations and expectations played a role in this research, the primary objective was to explain eventual occupational, career or status attainments, and the ways that parental social stratification was transmitted to children. Because the end-point of the attainment process was upward, downward, or no social mobility, the proliferation of relevant explanatory variables eventually led to the development of elaborate and comprehensive multivariate models.
The first of these models which included education was Blau and Duncan’s model of occupational attainment (1967). It was “only the starting point for a wave of studies in many societies, which elaborated on the importance of education in transmitting the rank in social stratification systems from one generation to the next” (Dronkers 1997: 371). Obviously, one direction in the extension of the Blau-Duncan model was to refine measures of family economic resources, as was done in the work of Halsey and his colleagues in the United Kingdom (Halsey, Heath, & Ridge 1980). But the most comprehensive model, and ultimately the most influential, originated from the “Wisconsin model”, which included educational aspirations (Haller 1982; Haller, Luther, Meier, & Ohlendorf 1974; Sewell & Hauser 1980). It might seem that the Wisconsin Model is simply another complex version of a social psychological approach to the study of occupational attainments. However Kerckhoff (1976) argued that: “the measures of ambition used in most analyses of status attainment do not index motivation so much as they index knowledge of “the real world” (1976: 371). Hence stratification scholars distinguished between two, mutually complementing, “allocation” and “socialisation” approaches to understanding the status attainment process (Kerckhoff 1976). The allocation perspective called for a focus on social structural constraints, for example, race, ethnicity, institutional settings such as features of particular schools or school systems or labour market characteristics, along with social psychological variables. These variables were seen by the social stratification/allocation tradition as interacting with structural constraints. (For a review of this research, see Mateju, Soukup, and Basl 2006.)
Labour market characteristics and features of national education systems also have gained prominence in the stratification research agenda. One particular research direction focused on the impact of different structures of educational systems, such as their vocational orientation, their openness in terms of tracking or non-tracking,
and the degree of standardisation on various outcomes. Buchmann and Dalton (2002) and Buchmann and Park (2005) examined the effects of differentiated education systems on the formation of expectations in a number of Western developed countries. They found that the expectations of students in more open education systems depended more on their significant others, because in more stratified (tracked) systems, students tended to be streamed into predictable types of educational programs early on, which resulted in “more realistic” expectations. Mortimer and Krüger (2000) also found that the differentiation of educational institutions, which is their standardisation, stratification and vocational specificity (Mueller & Shavit 1998), within societies served to maintain stratified career pathways. Moreover Mateju and his colleagues (2006) argued that in open education systems, family origin and type of school attended had less influence on educational aspirations.
These findings seem to confirm Kerckhoff’s “allocation model” in which expectations are conceptualised as reflecting knowledge of the “real world” (1976: 371). This knowledge includes the assessment of chances to progress through the educational system and the opportunity structure in the labour market, which may also include the recognition, however implicit or imperfect, of the extent of economic inequalities within a student’s country. Kerckoff noted that “… it seems reasonable to argue that expectations of the future are affected by observed structural constraints, and they thus reflect more than pure motivation” (1976: 371). He called for more contextual analysis, despite the inherent difficulties in producing persuasive empirical evidence about higher level effects.
Economic Opportunity Structures
We intend to contribute to the above body of research by considering the economic characteristics of labour markets and the opportunity structures in them. In particular, we are interested in whether these characteristics at the society level affect the educational and occupational expectations of students.
The relevance of national economic characteristics is not only a hypothesis but has been confirmed by a systematic body of research. Chiu & Kho (2005), investigating the PISA 2003 data, found that inequality at the country level adversely affects educational achievement above and beyond a wide range of individual and school level characteristics. This finding complements our knowledge of the corrosive impact of income inequality on health and healthcare outcomes (Wilkinson 1996). Country-level economic characteristics, that is, economic development and unemployment levels, have been found to explain some systematic differences in subjective social class location between individuals in wealthy and poor countries (Evans & Kelley 2004). Similarly, a comparative analysis of perceptions regarding just rewards for work, found that people growing up in poor nations are much more accepting of inequality than are people growing up in prosperous nations (Evans & Kelley 2006). Thus, characteristics of economic systems may affect the educational and occupational expectations in poorer countries, as they help define legitimate pathways of upward mobility.
One way of capturing structures of opportunity within country-specific labour markets and welfare states is to examine the impact of income differentials. Gini coefficients can be treated as indicators of wage differentials, corrected by redistributive mechanisms of the national welfare state, where such exists. The awareness of these differentials represents perceived opportunity structures and may trigger higher ambitions among youth living in more unequal countries than their counterparts in more egalitarian settings.
Therefore, in addition to social psychological variables, family variables, and school-level variables, we argue that the level of inequality in a country, as measured by the Gini coefficient, may also affect the educational and occupational expectations of young people.
We now turn our attention to the three hypotheses which will guide our analysis.
Three Hypotheses
As has been discussed, researchers have found counterintuitive patterns relating aspirations and expectations with higher-level variables, such as level of socio-economic development (Saha 1982; 1992). This persistent pattern leads to our first hypothesis:
H1: All other things being equal, the educational and occupational expectations of students will be higher in countries which are lower in socio-economic development.
Although GDP and within-country inequality are known to be inversely related, it is possible that inequality affects expectations above and beyond the level of economic development. The research on subjective social class indicates that people’s self-perceptions are largely dependent on “actual location in the social structure” (Evans & Kelley 2004: 28) despite being distorted by the homogeneity of their reference groups. If subjective perceptions of class are partly accurate, so also may be perceptions of the economic inequality which, combined with the ideology of global and democratic education, may create a climate in which the urge to move to the top, and the fear of not making it, boosts expectations where economic resources are unequally distributed. Hence we expect that:
H2: All other things being equal, economic inequality alone will be related to higher educational and occupational expectations of students. The world-wide expansion of tertiary education has been progressing hand in hand with a new global model of education, in which professional employment with international employers and university completion have become increasingly taken for granted (Schofer & Meyer 2005). Meyer called this cultural model of education “the school charter”, and he contended that certain “institutionalised rites” in schools bestow “new roles and statuses” on the students and graduates (Meyer 1977). These “new roles and statuses” impact on the life plans of students, including educational and occupational expectations. Therefore it is natural to expect educational expansion to go hand-in-hand with more ambitious career plans, possibly more
dramatically in countries where educational expansion is relatively recent. Although we have information about educational expectations only in 2003, we can compare occupational plans at two points in time. Thus we hypothesize that:
H3: Occupational expectations will rise over time.
To test these hypotheses we use the 2000 and 2003 surveys of the OECD's Program for International Student Assessment (PISA), conducted in over 40 countries (OECD 2002, 2005).
Data, Measurement and Methods
Our dependent variables are derived from two questions in these surveys. In 2000, students in 43 countries were asked:
What kind of job do you expect to have when you are about 30 years old?
Write the job title:___________________________________ In the 2003 PISA survey, 22 countries replicated the same question. In addition, the PISA 2003 participants asked students: “Which of the following do you expect to complete?” Students responded to a list of country-specific educational qualifications, which were then coded to the categories of the ISCED international classification, on which ‘level 5A or 6’ is equivalent to university completion. We analyse both data sets to establish how general our results are. Although PISA participants are primarily from OECD countries, the presence of some ‘lower-middle income’ countries, using the World Bank terminology, makes the analysis of these data suitable for investigating our research question.
Measurement
The PISA occupational data were recoded into the ISEI index of occupational status (Ganzeboom & Treiman 1996), which is our first dependent variable. Educational expectations, conceptualised as the intention to complete university (ISCED level 5a or 6), are our second dependent variable.
Our first independent variable at the country level is the logged GDP per capita, at purchasing power parity, recoded to the scale on which the USA is the base for comparison. In addition, we use the Gini coefficient as a measure of inequality (World Bank 2005). In preliminary analyses we considered a number of other country level characteristics, including secondary school enrolment ratios, the share of services in the economy, and the proportion of women in tertiary education. All had to be omitted due to colinearity with GDP.
At the school level we control for:
1) averaged parents’ occupation, which identifies schools with higher proportions of students from privileged backgrounds;
2) the existence of a school policy of using academic ability as an admission criterionv (coded 0 for schools that do not have such a policy and 1 for those that do); and
3) the regular assessment of students against either national or district standards (coded 1 for schools in which such assessment is conducted and 0 for all others).
At the individual level we include gender, parents’ occupational status and educational credentials recoded into years of schooling completed, using the template provided by the 2003 PISA manual (OECD 2005). We also control for the size of home library, treating it as a proxy for scholarly capital (Kelley, Evans & Sikora 2006). Following prior research based on PISA data (Buchmann & Park 2005), we included the combined reading scale as an indicator of prior academic achievement, as the actual data on prior academic achievement are not available. In 2000 the standardised reading scale, with the mean of 500 and the standard deviation of 100 points, involves WLE estimates of students’ ability to retrieve information, interpret, reflect on and evaluate texts. The details of the scale construction are available online (OECD 2002: Chapter 9). This scale is highly correlated (about r= 0.7) with scales measuring science achievement and mathematics achievement (Woessmann & Fuchs 2004: 7). The 2003 data contain no WLE estimates but five plausible values which we simply averaged, following others (Buchmann & Park 2005), to create a control variable. In the 2003 data we also control for students’ participation in either vocationally or pre-vocationally-oriented programs within the school.
Method
To model occupational expectations, we employ random intercept three-level linear models, as available in HLM version 6, in which students are clustered in schools and schools are clustered in countries, as in Eq. 1 and Eq. 2 below.
Eq 1
ExpectedOccupation i= constant ijk + Ginik + lnGDPk +
AverageParents’Occupation_in_schoolj + Standard_assessment_studentsj +
Admission_based_academic_performancej+ Maleijk+ Parents’educationijk +
Parents’occupationijk+ Reading_scoreijk+ Home_library_sizeijk+ v0k+ u0jk+ e0ijk
Eq 2
Expects_University_Completion i= constant ijk + Ginik + lnGDPk +
AverageParents’Occupation_in_schoolj + Standard_assessment_studentsj +
Admission_based_academic_performancej+ Maleijk+ Parents’educationijk +
Parents’occupationijk+ Reading_scoreijk+ Home_library_sizeijk+
Vocationally_oriented_program ijk+ v0k+ u0jk+ e0ijk
All linear models are estimated with PISA-recommended standardised weights at the student level, to accurately represent student populations within each country. Moreover, country samples were weighted to N=1000 to prevent any bias introduced by unequal sample sizes. Due to significant computational complexity, Bernoulli models have been estimated without weights. The results of weighted and
unweighted analyses all lead to the same substantive conclusions, and all sensitivity analyses are available upon request from the authors.
Missing data
As in all data sets, PISA variables have some missing values. To reduce the loss of information, we imputed some data at the individual level. For instance in PISA 2003, three per cent of cases with no information on parents’ education and six per cent with no parents’ occupational status were imputed with the EM algorithm, which despite some criticisms (Hippel 2004) produces results comparable to multiple imputation procedures (Raghunathan, Solenberger, & Hoewyk 2004). We chose not to impute school level variables and used list wise deletion as the next step, which reduced our country-level sample size when countries lacked data on selective student admission policies or accountability towards national standards (Table 1).
Results
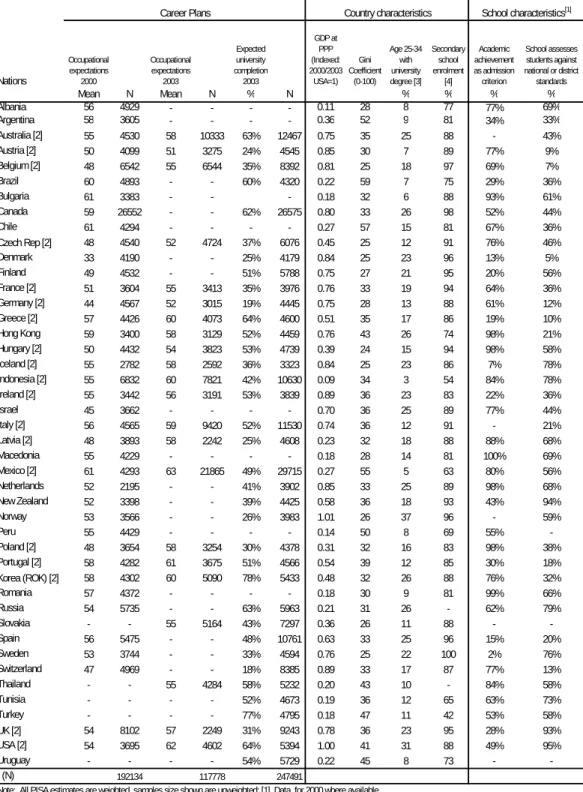
Occupational and educational expectations vary significantly between countries (Table 1, Panel ‘Career plans’). For example in Australia, Canada, Korea and the United States, students have higher occupational and educational expectations than students in Germany, Switzerland and the Czech Republic. These differences have been attributed to the operation of highly differentiated education systems which stream students early into vocational education, and thus create “realistic’ expectations, relatively unaffected by the influence of significant others (Buchmann & Park 2005). However, students tend to have somewhat higher expectations also in Argentina, Brazil, Chile, Indonesia, Mexico and Turkey, where national education systems are not as standardised and differentiated as in some OECD countries. Despite significant variability from country to country, students living in less affluent countries with higher levels of inequality tend to have more ambitious educational and occupational plans.
In all countries for which we have the data about expected occupation, richer and poorer, differentiated and undifferentiated secondary schooling systems, average expectations rose, by a similar margin between 2000 and 2003. This increase is moderate, amounting mostly to a couple of points on the ISEI scale, but the trend is clearly present in all countries (Figure 1, and the rows indexed with [3] in Table 1). We can only speculate whether the rise in ambition is triggered by more elasticity in the structure of opportunities available to students, or whether it itself is the key factor that inclines governments to work on further expansion of tertiary education institutions.
Nevertheless, we note the worldwide growth of career plans accompanying the worldwide tertiary education expansion, as predicted in H3. This fits Schofer and Meyer’s (2005) argument that countries in both the centres and the peripheries of the world, embrace education models in which the prospect of professional employment in globalising markets and the commonality of the university experience are increasingly taken for granted.
Table 1. Occupational and Educational Expectations, Country and School Characteristics in 44 Societies, PISA 2000 and 2003
Nations Occupational expectations 2000 Occupational expectations 2003 Expected university completion 2003 GDP at PPP (Indexed: 2000/2003 USA=1) Gini Coefficient (0-100) Age 25-34 with university degree [3] Secondary school enrolment [4] Academic achievement as admission criterion School assesses students against national or district standards Mean N Mean N % N % % % % Albania 56 4929 - - - - 0.11 28 8 77 77% 69% Argentina 58 3605 - - - - 0.36 52 9 81 34% 33% Australia [2] 55 4530 58 10333 63% 12467 0.75 35 25 88 - 43% Austria [2] 50 4099 51 3275 24% 4545 0.85 30 7 89 77% 9% Belgium [2] 48 6542 55 6544 35% 8392 0.81 25 18 97 69% 7% Brazil 60 4893 - - 60% 4320 0.22 59 7 75 29% 36% Bulgaria 61 3383 - - - 0.18 32 6 88 93% 61% Canada 59 26552 - - 62% 26575 0.80 33 26 98 52% 44% Chile 61 4294 - - - - 0.27 57 15 81 67% 36% Czech Rep [2] 48 4540 52 4724 37% 6076 0.45 25 12 91 76% 46% Denmark 33 4190 - - 25% 4179 0.84 25 23 96 13% 5% Finland 49 4532 - - 51% 5788 0.75 27 21 95 20% 56% France [2] 51 3604 55 3413 35% 3976 0.76 33 19 94 64% 36% Germany [2] 44 4567 52 3015 19% 4445 0.75 28 13 88 61% 12% Greece [2] 57 4426 60 4073 64% 4600 0.51 35 17 86 19% 10% Hong Kong 59 3400 58 3129 52% 4459 0.76 43 26 74 98% 21% Hungary [2] 50 4432 54 3823 53% 4739 0.39 24 15 94 98% 58% Iceland [2] 55 2782 58 2592 36% 3323 0.84 25 23 86 7% 78% Indonesia [2] 55 6832 60 7821 42% 10630 0.09 34 3 54 84% 78% Ireland [2] 55 3442 56 3191 53% 3839 0.89 36 23 83 22% 36% Israel 45 3662 - - - - 0.70 36 25 89 77% 44% Italy [2] 56 4565 59 9420 52% 11530 0.74 36 12 91 - 21% Latvia [2] 48 3893 58 2242 25% 4608 0.23 32 18 88 88% 68% Macedonia 55 4229 - - - - 0.18 28 14 81 100% 69% Mexico [2] 61 4293 63 21865 49% 29715 0.27 55 5 63 80% 56% Netherlands 52 2195 - - 41% 3902 0.85 33 25 89 98% 68% New Zealand 52 3398 - - 39% 4425 0.58 36 18 93 43% 94% Norway 53 3566 - - 26% 3983 1.01 26 37 96 - 59% Peru 55 4429 - - - - 0.14 50 8 69 55% -Poland [2] 48 3654 58 3254 30% 4378 0.31 32 16 83 98% 38% Portugal [2] 58 4282 61 3675 51% 4566 0.54 39 12 85 30% 18% Korea (ROK) [2] 58 4302 60 5090 78% 5433 0.48 32 26 88 76% 32% Romania 57 4372 - - - - 0.18 30 9 81 99% 66% Russia 54 5735 - - 63% 5963 0.21 31 26 - 62% 79% Slovakia - - 55 5164 43% 7297 0.36 26 11 88 - -Spain 56 5475 - - 48% 10761 0.63 33 25 96 15% 20% Sweden 53 3744 - - 33% 4594 0.76 25 22 100 2% 76% Switzerland 47 4969 - - 18% 8385 0.89 33 17 87 77% 13% Thailand - - 55 4284 58% 5232 0.20 43 10 - 84% 58% Tunisia - - - - 52% 4673 0.19 36 12 65 63% 73% Turkey - - - - 77% 4795 0.18 47 11 42 53% 58% UK [2] 54 8102 57 2249 31% 9243 0.78 36 23 95 28% 93% USA [2] 54 3695 62 4602 64% 5394 1.00 41 31 88 49% 95% Uruguay - - - - 54% 5729 0.22 45 8 73 - (N) 192134 117778 247491
[2] Average occupational expectations signficantly different between PISA 2000 and 2003 [4] School enrolment data are from World Bank Indicators 2005
Career Plans Country characteristics School characteristics[1]
Note: All PISA estimates are weighted, samples size shown are unweighted; [1] Data for 2000 where available
Although students’ expectations become more ambitious over time, in most countries these plans are somewhat unrealistic once contrasted with actual attainment (Figure 2). Although this generation of high school students will achieve higher levels of educational qualifications than their contemporary 25-34 year olds, it is particularly in the poorer countries with higher levels of inequality that the plans of many students will not be realised. Despite high levels of optimism in all countries (with the one exception of Norway), the hopes of students in Brazil, Uruguay, Mexico and Thailand (top of Figure 2) will more likely remain unfulfilled than plans of young Canadians, Americans or Australians.
Multivariate Analyses
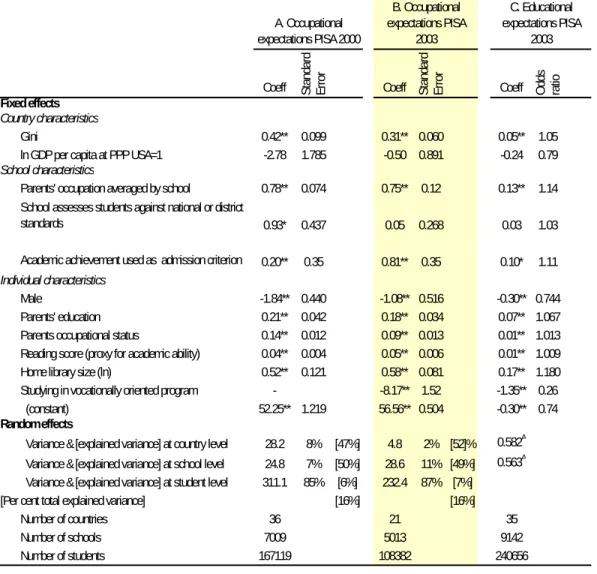
In Table 2, we see that country-level contexts emerge as a relatively moderate component of variation in career plans compared to individual and family characteristics of students (lower panels). This is often the case in three-level models. Although variance partitioning in a Bernoulli model of educational expectations is complex and hard to interpret (Raudenbush & Bryk 2002), the interpretation of linear estimates for occupational plans is more straightforward. In the 2000 data, only 8 per cent of variance in occupational plans can be attributed to differences between countries, another 7 per cent to differences between schools while 85 per cent is attributable to individual-level differences. A similar pattern holds for the 2003 data in which 3 per cent of the differences in occupational expectations can be attributed to between-country differences, 11 per cent to variation between schools and 87 per cent to individual differences.
Income inequality, measured by the Gini coefficient, explains half of the inter-country differences, while, contrary to our expectations, the level of economic development, measured by GDP, has no predictive power in its own right, in contrast to our H1. Inequality appears to boost expectations even after a range of school and individual characteristics are taken into account.
At the individual level, gender and family background are significant predictors of higher educational and occupational expectations. Girls tend to be more ambitious than boys, even after the variability in their academic ability measured by reading skills is held constant. As found by prior research, higher educational and occupational status of parents acts as a significant booster of youth ambition, but we note that some families provide additional incentives for their offspring by surrounding them with large home libraries. Youth living in book-rich home environments form more ambitious career plans, even after their reading ability and family background are controlled for.
In addition to family characteristics, we see that schools exert significant influence by placing some students in vocational programs, which moderates their occupational and educational expectations (note the negative coefficients in Panels B and C), making their future more predictable by clearly delineated education-to-work transfer paths.
Source: For Figure 1: PISA 2000 and PISA 2003 For Figure 2: OECD.2004. Education at a Glance,
Table A3.3. Data for Albania, Bulgaria, Hong Kong, Latvia, Romania, and Russia based on calculations from the ILO Statistics Database data Table 1b, 2002 10 30 50 70 90 United States United Kingdom Republic of Korea Portugal Poland Mexico Latvia Italy Ireland Indonesia Iceland Hungary Greece Germany France Czech Republic Belgium Austria Australia ISEI 2000 2003 0% 20% 40% 60% 80% 100% Uruguay United States United Kingdom Turkey Tunisia Thailand Sw itzerland Sw eden Spain Slovakia Russia Republic of Korea Portugal Poland Norw ay New Zealand Netherlands Mexico Latvia Italy Ireland Indonesia Iceland Hungary Hong Kong Greece Germany France Finland Denmark Czech Republic Canada Brazil Belgium Austria Australia Proportion of university graduates among 25-34 year olds Expects university completion Figure 1. Average Occupational
Expectations in 2000 and 2003 by Country
Figure 2. Educational Expectations and Actual University Completion Rates Among 25-34 Year Olds, by Country
Table 2. Occupational and Educaitonal Expectations. Coefficients from Three-Level Linear (A & B) and Bernoulli (C) Models
Country characteristics
Gini 0.42** 0.099 0.31** 0.060 0.05** 1.05
ln GDP per capita at PPP USA=1 -2.78 1.785 -0.50 0.891 -0.24 0.79
School characteristics
Parents' occupation averaged by school 0.78** 0.074 0.75** 0.12 0.13** 1.14
School assesses students against national or district
standards 0.93* 0.437 0.05 0.268 0.03 1.03
Academic achievement used as admission criterion 0.20** 0.35 0.81** 0.35 0.10* 1.11
Male -1.84** 0.440 -1.08** 0.516 -0.30** 0.744
Parents' education 0.21** 0.042 0.18** 0.034 0.07** 1.067
Parents occupational status 0.14** 0.012 0.09** 0.013 0.01** 1.013
Reading score (proxy for academic ability) 0.04** 0.004 0.05** 0.006 0.01** 1.009
Home library size (ln) 0.52** 0.121 0.58** 0.081 0.17** 1.180
Studying in vocationally oriented program - -8.17** 1.52 -1.35** 0.26
(constant) 52.25** 1.219 56.56** 0.504 -0.30** 0.74
Random effects
Variance & [explained variance] at country level 28.2 8% [47%] 4.8 2% [52]% 0.582A
Variance & [explained variance] at school level 24.8 7% [50%] 28.6 11% [49%] 0.563A
Variance & [explained variance] at student level 311.1 85% [6%] 232.4 87% [7%]
[16%] [16%] Number of countries 36 21 35 Number of schools 7009 5013 9142 Number of students 167119 108382 240656 Fixed effects Individual characteristics
[Per cent total explained variance]
** statistically different from zero at p=0.01,* statistically different from zero at p=0.05
A in the three-level Bernoulli model the computations of explained variance are complex and not reliable (see: Raudenbush & Bryk p. 298), hence we omit them
Coeff Coeff A. Occupational expectations PISA 2000 B. Occupational expectations PISA 2003 C. Educational expectations PISA 2003 Odds ratio St and ar d Erro r Coeff Stand ar d Erro r
But taken together, all these characteristics account for only a small proportion of variance in occupational expectation (6% and 7%), which calls for more research into individual differences and their interplay with school environment. At the second level of analysis, elite schools foster even more ambitious plans, above and beyond individual differences between students. Going to a school where most students come from homes of professionals, managers and administrators, leads students to aim even higher in terms of their educational and occupational plans. Similarly these schools, in which only candidates with good academic credentials are admitted, instil a culture of higher expectations. Finally, although in the 2000
data we note that adherence to national curriculum standards boosts expectations net of other effects, this relationship does not hold in 2003.
Most importantly, even after all these differences are taken into account, country-level inequality further raises career expectations by a moderate but significant margin. Given that inequality is known to have strongly corrosive effects on the actual academic achievement within countries (Chiu & Kho 2005), its positive relationship with higher educational expectations appears counterintuitive. Yet, this finding is consistent with previous research which systematically documented higher expectations in developing countries, discussed earlier (Saha 1992), and also among immigrants in developed countries (Wells, Bills, Park & Chen 2007). Thus, income inequality seems to have a dual influence on academic performance. On the one hand it reduces average achievement, while on the other it moderately boosts career expectations which, as is well documented, are positively related to actual outcomes. However, this latter effect may not wipe out its overall corrosive impact, as the relationship between inequality and achievement is much stronger (Chiu & Kho 2005) than the relationship between inequality and career plans that we find.
Relationship between Inequality and Career Plans and
Sample Selectivity
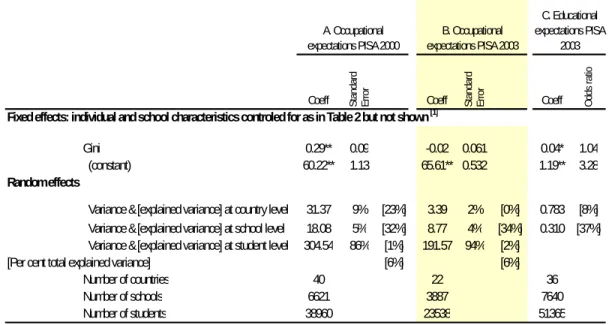
Although the propensity of relatively deprived students to form more ambitious life plans seems well established, it is possible that the impact of social inequality found in the Table 2 models is a product of PISA’s sampling selectivity within the population of 15-year-olds. Countries with greater inequality levels and lower GDP have a lower proportion of their age groups in school, because of lower retention rates (Keeves & Saha 1992). So, we might be comparing elite students from poorer and inegalitarian countries with the whole cohort of students in rich and egalitarian countries.
To eliminate such a possibility in the models, we first controlled for the proportion of eligible student population enrolled in secondary school, but it made no difference to our results. As a next step, we assumed that comparing students within the top 20 per cent of the reading scores would provide a more conservative test of sample selectivity.
Because academic performance is closely related to educational and occupational expectations, selecting students with high reading scores is preferable to, for instance, restricting the sample only to children of professional parents. Hence, in a country in which 100 per cent of 15-year-old students are enrolled in high school, we included the top 20 per cent in our analysis. In a country where only 63 per cent of the students are enrolled, we took 32 per cent (i.e. 20/63) from the top. In Table 3, we present a repetition of our earlier analysis, but limited to “elite” students. Had the effect of inequality been produced by sample selectivity, the results would show no differences between countries with respect to the Gini. Yet, inequality retains much of its predictive power, with the exception of occupational plans in 2003, the
information for which came from a smaller set of relatively economically undifferentiated countries (Table 1).
Table 3. Occupational and Educational Expectations of Students with Top 20% Reading Scores. Coefficients from Three-Level Linear (A & B) and Bernoulli (C) Models [1]
Gini 0.29** 0.09 -0.02 0.061 0.04* 1.04
(constant) 60.22** 1.13 65.61** 0.532 1.19** 3.28
Random effects
Variance & [explained variance] at country level 31.37 9% [23%] 3.39 2% [0%] 0.783 [8%]
Variance & [explained variance] at school level 18.08 5% [32%] 8.77 4% [34%] 0.310 [37%]
Variance & [explained variance] at student level 304.54 86% [1%] 191.57 94% [2%]
[6%] [6%]
Number of countries 40 22 36
Number of schools 6621 3887 7640
Number of students 38960 23538 51365
[1] Models included all controls from Table 2 except for 1) GDP, 2) School assesses students against national or district standards, and 3) Academic achievement used as admission criterion. 2) and 3) were omitted to allow for a larger sample size at country level.
[Per cent total explained variance]
Note: * statistically different from zero at p=0.05; ** statistically different from zero at p=0.01 Coeff Standa
rd
Erro
r
Coeff Fixed effects: individual and school characteristics controled for as in Table 2 but not shown [1]
Coeff Odds ra tio St anda rd Erro r A. Occupational expectations PISA 2000 B. Occupational expectations PISA 2003 C. Educational expectations PISA 2003
To utilise maximum information at the country level, we excluded some school-level characteristics from this model, as several countries did not have data on these variables and thus could not be included in models in Table 2 (note the difference in number of countries between Table 2 and Table 3). We conclude that even when only elite students are considered, inequality is still relevant as a predictor of high expectations, so we cannot attribute the effect of inequality to sample selectivity.
Theoretical Explanations for the Counterintuitive
Findings
Our findings are consistent with, and contribute to, the growing body of literature which is increasingly successful in partitioning the complex relationships in patterns of aspirations and expectations. In particular, we have found a counterintuitive relationship between inequality and educational and occupational expectations. There are three theories which merit attention in the context of this finding.
1. Different Rationality: This argument, based on Little’s (1978) findings, assumes that in the face of poor employment prospects, the aspiration for higher levels of education, in order to be competitive for the few jobs available, makes sense
rationally. Rather than regard high levels of aspirations and expectations as “flights of fancy”, this theoretical approach acknowledges the possibility of the rational calculation of increasing the odds for obtaining a job. Therefore in economies with higher long-term unemployment levels or with significant economic upheavals (for example, the post-socialist transition periods in Eastern Europe), educational and occupational expectations should be high. High levels of inequality (such as we measured with the Gini coefficient) should then produce the same phenomenon. In countries with a high level of inequality, students should likewise embrace high educational and occupational expectations, since the only alternative prospect is poverty.
2. Relative Deprivation Theory and the Revolution of Rising Expectations: This theory, put forth by Runciman (1966) and Davis (1966), refers to feelings of discontent when people feel they have less than they deserve, based on comparisons they make between themselves and others. This explains why people sometimes raise their aspirations and expectations at a time when their life conditions are low, but improving in absolute terms. Thus, school students in disadvantaged conditions will sometimes unduly raise their aspirations and expectations because of their changing perceptions of their “fair share”, even though the structural possibilities of attaining their goals are remote. Some theorists, like Gurr (1970) and Chandra and Foster (2005), have argued that this is why revolutions and other social disorders occur at a time when conditions are actually improving.
3. The Coupling between Education and Occupation: Since the 1970s many researchers have argued that there exists a world-wide expansion of education and the values relating to it (Meyer, Ramirez, Rubinson, & Boli-Bennett 1977). It has also been argued that in poorer, less developed societies with greater inequality, higher paying jobs are more strongly tied to education. Suda (1979) contended that in this context, the perceptions of life chances are raised unduly, resulting in what some have called “the diploma disease” (Dore 1976). But, as Irizarry (1980) argued, under the contradictions of capitalist development, ambitions are raised but with limited possibilities for their fulfilment. Conversely, in already developed societies where education is well institutionalised, the link between education and occupation is looser, above and beyond the effect of nation-specific differentiation in education systems, with the result that youth are given a wider range of career opportunities and thus the expectations relating to them are more “realistic”.
Discussion
Our findings for the educational and occupational expectations at the individual and the school level for 2000 and 2003 are consistent with the mainstream literature. Students from home backgrounds where parents have more education and higher prestige jobs, and in which there are more books, have been found to have higher levels of both expected education and occupation. Higher academic achievement, measured by reading scores, is strongly related to education and occupational expectations.
At the school level, we find that students in schools with a higher level aggregate parental occupation score, and in schools which select students based on prior academic achievement, also have more ambitious career plans.
These individual and school level net effects, particularly the negative effect of learning in vocational streams, are consistent with the stratification and mobility literature which documents the transmission of the inequality of expectations through home background and school tracking.
At the third level of analysis, the country level, we find a different and counterintuitive pattern, but one that again is similar to that found in earlier research. Inequality at the country level is positively related to higher educational and occupational expectations. Although, as in most three-level models, the third level does not explain much of the total variance, the fact that these counterintuitive findings persist, even after the use of larger data sets and more powerful statistical techniques, makes it even more necessary to provide a plausible and useful explanation.
One obvious possible explanation is that countries with greater inequality would have a lower proportion of the age group in school, because of lower retention rates (Keeves and Saha 1992). However, we believe that we have controlled for this by restricting our second analysis only to “elite” students. It appears that irrespective of what proportion of the 15-year-olds in each country were in the schools at the time of the PISA surveys, this pattern persists.
It might be possible to argue, as Little did, that the students in these lesser developed countries follow a different rationality in forming their life goals (Little 1978). However, we have no indicators of students’ perceptions of labour market opportunity structures so we cannot directly test this proposition.
If we consider the notion of relative deprivation, and along with it, the so-called “frog pond” effect (Davis 1966), it might be argued that students in lesser developed countries aim higher because, from their perspective, they are big frogs in little ponds. It might be also possible to argue that with the world educational expansion since the early 20th century and the corresponding rise of student expectations (our H3) (Meyer 1977; Schofer & Meyer 2005), the extent to which education is valued creates undue expectations on the part of students in those countries which have less developed opportunity structures (Figure 1).
Ultimately, the most plausible explanation would appear to be a combination of these theoretical explanations, namely the effects of rapid global educational expansion, and a sense of relative deprivation which leads to a kind of “revolution of rising expectations”. In this context, a tighter coupling also likely exists between education and occupation. As Dore (1976) argued over 30 years ago, during periods of rapid educational expansion, the expectation of jobs, which students perceive are the natural outcomes of a particular level of educational attainment, far outstrips the availability of jobs. The result in this context is that students will have narrow, inflexible and unreasonable (at least objectively speaking) occupational expectations
for the educational levels that they expect that they will obtain. Given that our measure of educational expectation is university completion, it is plausible that students, who expect to attend university in countries where there are high levels of inequality and low levels of GDP, will have unreasonable and perhaps fanciful expectations about the job a university degree will make it possible for them to attain. If this is the case, inequality may have ultimately a corrosive effect. But to the extent to which it boosts educational expectations, which, as we know, result in higher attainment, its effect may not be corrosive after all.
Conclusion
Social inequality, which we find related to more ambitious career plans, is known to have a corrosive effect on a range of outcomes, including educational attainment. For example, in developing countries with more inequality, many students with very high occupational expectations will be dissatisfied with their eventual attainments (Post 1990; Wober 1975). Some writers regard this as problematic, and have suggested that some dysfunctional outcomes might occur.
Others may regard higher expectations in non-egalitarian settings as a positive phenomenon because they can contribute to rising levels of actual attainment. Thus, there are some relevant and practical policy considerations to which our study might contribute. However, these are not issues that we set out to address in this paper, nor do the PISA data sets contain the variables which would make this possible. But our study does provide a rationale for conducting more research on the consequences of unmet expectations.
Finally, we must give a word of caution about our findings. Although our results are consistent with those of previous research, our data include more countries and our statistical techniques are more powerful, we still need further research to confirm and build on these results. Firstly, compared to the IEA data which formed the basis for earlier research, the PISA data provide both advantages and disadvantages. With respect to the first, the PISA data sets include more countries and also provide an opportunity for some restricted comparisons over time. This latter advantage will grow as the PISA project continues. However, unlike the IEA data sets, the PISA project is more restricted to OECD countries (with few exceptions), and thus the range in country level variables, particularly those related to socio-economic development, is more constrained.
Further studies are needed to test our propositions with data from more countries representing a wider range of development conditions. Only then will a conclusive answer to the question about the corrosive impact of inequality be possible. Until that happens, we believe we have provided the most comprehensive evidence available.
References
Alexander, K. L. & Cook, M. A. (1979) “The Motivational Relevance of Educational Plans: Questioning the Conventional Wisdom.” Social Psychology Quarterly, 42:202-213.
Blau, P. M. & Duncan, O. D. (1967) The American Occupational Structure. New York: Free Press.
Berg, I. (1970) Education and Jobs: The Great Training Robbery. New York: Praeger Publishers.
Buchmann, C. & Dalton, B. (2002) “Interpersonal Influences and Educational Aspirations in 12 Countries: The Importance of Institutional Context. ” Sociology of Education, Vol. 75: 99-122.
Buchmann, C. & Park. H. (2005) “Stratification and the Formation of Expectations in Highly-Differentiated Educational Systems." In ISA Research Committee 28 (Stratification). Los Angeles.
Caro, F. G. & Pihlblad. C. T. (1965) “Aspirations and Expectations: A Re-examination of the Bases for Social Class Differences in the Occupational Orientations of Male High School Students.” Sociology and Social Research, Vol. 49: 465-475.
Carpenter, P. G. & Fleishman, J. A. (1987) “Linking Intentions and Behavior: Australian Students' College Plans and College Attendance.” American Educational Research Journal, Vol. 24:79-105.
Chandra, S. & Foster, A. W. (2005) “The Revolution of Rising Expectations", Relative Deprivation, and the Urban Social Disorders of the 1960s: Evidence from State-Level Data.” Social Science History, Vol. 29:299-332.
Chiu, M. M. & Kho, L. (2005) “Effects of Resources, Inequality, and Privilege Bais on Achievement: Country, School, and Student Level Analyses.” American Educational Research Journal, Vol. 42:575-603.
Collins, R. (1979) The Credential Society: An Historical Sociology of Education and Stratification. New York: Academic Press.
Davis, J. A. (1966) “The Campus as a Frog Pond: An Application of the Theory of Relative Deprivation to Career Decisions of College Men.” American Journal of Sociology,
Vol. 72:17-31.
Desoran, R. A. (1977/1978) “Educational Aspirations: Individual Freedom or Social Injustice?” Interchange, Vol. 8:72-87.
Dore, R. (1976) The Diploma Disease: Education, Qualification and Development. London: Routledge and Kegan Paul.
Dronkers, J. (1997) “Social Mobility, Social Stratification and Education.” In L. J. Saha (ed.)
International Encyclopedia of the Sociology of Education, Oxford: Pergamon Press, 369-375.
Dronkers, J. & van der Ploeg, S. W. (1997) “Educational Expansion: Sociological Perspectives.” In L. J. Saha. (ed.), International Encyclopedia in the Sociology of Education, Oxford: Pergamon Press. 430-437
Empey, L. (1956) “Social Class and Occupational Aspiration: A Comparison of Absolute and Relative Measurement.” American Sociological Review, Vol. 21:703-709. Evans, M D R & Kelley, J. (2004) “Subjective Social Location: Data from 21 nations.”
International Journal of Public Opinion Research, Vol. 16:5-38.
Evans, M D R & Kelley, J. (2006) “Economic Development and Inequality Attitudes: The Long Shadow of the Past.” The annual meeting of the American Sociological Association, Vol. 16, 5-38. Montreal Convention Center, Montreal, Quebec, Canada: American Sociological Association.
Feliciano, C. & Rumbaut, R. G. (2005) “Gendered paths: Eucational and occupational expectations and outcomes among adult children of immigrants.” Ethnic and Racial Studies, Vol. 28:1087-1118.
Ganzeboom, H. B. G. & Treiman, D. J. (1996) “Internationally Comparable Measures of Occupational Status for the 1988 International Standard Classification of
Occupations.” Social Science Research, Vol. 25:201-239.
Haller, A. O. (1982) “Reflections on the Social Psychology of Status Attainment.” In R. M. Hauser, D. Mechanic, A. O. Haller, & T. S. Hauser (eds.) Social Structure and Behavior: Essays in Honor of William Hamilton Sewell, New York: Academic Press. 3-28
Haller, A. O., Luther, O. B. Meier, R. F. & Ohlendorf, G. W. (1974) “Level of Occupational Aspiration: An Empirical Analysis.” American Sociological Review, Vol. 39:113-121. Halsey, A. H., Heath, A. & Ridge, J. (1980) Origins and Destinations: Family, Class, and
Education in Modern Britain. Oxford: Clarendon Press.
Han, W. S. (1969) “Two Conflicting Themes: Common Values Versus Class Differential Values.” American Sociological Review, Vol. 34:679-690.
Hansen, D. O. (1973) “Age Variations in the Formation of Educational and Occupational Career Goals of Brazilian Youth.” Comparative Education Review.
Hansen, D. O. & Haller, A. O. (1973) “Status Attainment of Costa Rican Males: A Cross-Cultural Test of a Model.” Rural Sociology, 38.
Hippel, P. T. von. (2004) “Biases in SPSS 12.0 Missing Value Analysis.” The American Statistician Vol. 58:160-64.
International Labor Organization, accessed August 2007 http://laborsta.ilo.org/
Irizarry, R. (1980) “Overeducation and Unemployment in the Third World: The Paradoxes of Dependent Industrialization.” Comparative Education Review, Vol. 24:338-352. Jöreskog, K. G & Sörbom, D. (1988) Prelis. A Program for Multivariate Data Screening and
Data Summarization. Chicago: Scientific Software International.
Keeves, J. P. & Saha, L. J. (1992) “Home Background Factors and Educational Outcomes.” In J. P. Keeves(ed.),The IEA Study of Science III: Changes in Science Education and Achievement: 1970 to 1984, . Oxford: Pergamon Press, 165-186
Kelley, J, M.D., Evans, R & Sikora, J. (2006) “Scholarly culture and academic performance in 42 nations.” In RC 28 Spring Meeting. Nijmegen: Radboud University.
http://www.ru.nl/springmeetingnijmegen/conference_papers/ conference_papers/
Kerckhoff, A. C. (1976) “The Status Attainment Process: Socialization or Allocation?”
Social Forces, Vol. 55:368-381.
Khattab, N. (2003) “Explaining educational aspirations of minority students: the role of social capital and students' perceptions.” Social Psychology of Education, 6:283-281. Little, A. (1978) “The Occupational and Educational Expectations of Students in Developed and Less-Developed Countries.” Sussex University, Institute of Development Studies, Sussex.
Mateju, P. Soukup, P. & Basl, J. (2006) “Educational aspirations in comparative perspective.” The ECSR Conference on "Quality and Inequality in Education"
Prague. www.soc.cas.cz/download/283/Mateju_Soukup_Basl_paper.pdf McClelland, D. C. (1961) The Achieving Society. New York: The Free Press.
Meyer, J. W. (1977) “The Effects of Education as an Institution.” American Journal of Sociology, Vol. 83:55-77.
Meyer, J. W., Ramirez, F. O., Rubinson, R. & Boli-Bennett, J. (1977) “The World Education Revolution.” Sociology of Education, Vol. 50:242-258.
Mortimer, J. T. & Krüger, H. (2000) “Pathways from School to Work in Germany and the United States.” In M. T. Hallinan, (ed.), Handbook of the Sociology of Education, New York: Kluwer, 475-497.
Mueller, W. & Y. Shavit. (1998) “The Institutional Embeddedness of the Stratification Process: A Comparative Study of Qualifications and Occupations in Thirteen Countries.” In Y. Shavit & W. Mueller (eds.), From School to Work: A Comparative Study of Educational Qualifications and Occupational Destinations, Oxford: Oxford University Press.
Musgrave, P. M. (1967) “Towards a sociological theory of occupational choice.”
Sociological Review, Vol. 15:33-46.
OECD. (2002) PISA 2000 Technical Report. Paris: Organization for Economic Co-operation and Development.
OECD. (2005) PISA 2003 Data Analysis Manual. SPSS Users. Paris: Organization for Economic Co-operation and Development.
OECD. (2004) Education at a Glance. Paris: Organization for Economic Co-operation and Development.
Porter, J., M. Porter, & Blishen, B. R. (1982) Stations and Callings: Making it Through the School System. Toronto: Methuen.
Portes, A., McLeod, S. A. & Parker, R. N. (1978) “Immigrant Aspirations.” Sociology of Education, Vol. 51:241-260.
Post, D. (1990) “The Social Demand for Education in Peru: Students' Choices and State Autonomy.” Sociology of Education, Vol. 63:258-271.
Raghunathan, T. E., Solenberger, P. W. & Van Hoewyk, J. (2004) IVEware: Imputation and Variance Estimation Software. University of Michigan: Survey Methodology Program, Survey Research Center, Institute for Social Research.
Raudenbush, S. W. & Bryk, A. S. (2002) Hierarchical Linear Models. Applications and Data Analysis Methods. Thousand Oaks: Sage.
Runciman, W. G. (1966) Relative Deprivation and Social Justice: A Study of Attitudes to Social Inequality in Twentieth-Century England. Berkeley: University of California Press.
Saha, L. J. (1982) “National Development and the Revolution of Rising Expectations: Determinants of Career Orientations Among School Students in Comparative Perspective.” In M. A. Archer (ed.) The Sociology of Educational Expansion: Take-Off, Growth and Inflation in Educational Systems, Sage Studies in International Sociology, London: Sage Publishers, 241-264.
—. (1983) “Gender, School Attainment and Occupational Plans: Determinants of Aspirations and Expectations Among Australian Urban School Leavers.” Australian Journal of Education, Vol. 26:247-265.
—. (1992) “The Effects of Socio-Economic Development on Student Academic Performance and Life Plans: A Cross- National Analysis.” International Journal of Educational Development, Vol. 12:191-204.
—. (1997) “Aspirations and Expectations of Students." In L. J. Saha (ed.), International Encyclopedia of the Sociology of Education, Oxford: Pergamon Press, 512-517. Saha, L. J. & Keeves, J. P. (2003) “Leading the Way: The Development of Analytical
Techniques in the Sociology of Education.” In C. A. Torres & A. Antikainen (eds.),
The International Handbook on the Sociology of Education, Lanham: Rowman & Littlefield Publishers, Inc, 160-179.
Schofer, E. & Meyer, J. W. (2005) “The Worldwide Expansion of Higher Education in the Twentieth Century.” American Sociological Review, Vol. 70:898-920.
Sewell, W. H., Haller, A. O. & Portes, A. (1969) “The Educational and Early Occupational Attainment Process.” American Sociological Review, 34:83-92.
Sewell, W. H. & Hauser, R. M. (1980) “The Wisconsin Longitudinal Study of Social and Psychological Factors in Aspirations and Achievements.” In A. C. Kerckhoff (ed.),
Research in Sociology of Education and Socialization, Vol. 1, Greenwich, Conn.: JAI Press, 59-99
Suda, Z. (1979) “Universal Growth of Education Aspirations and the Over-Qualification Problem: Conclusions from a Comparative Data Analysis.” European Journal of Education, Vol. 14:113-164.
Turner, R. (1964) The Social Context of Ambition. San Francisco: Chandler Publishing Company.
Wells, R., Bills, D., Park, S. & Chen, Y. (2007) “National Education Sector and Labor Market Effects on Students' Postsecondary Expectations.” Unpublished manuscript. University of Iowa.
Wilkinson, R. G. (1996) Unhealthy Societies—the afflictions of inequality. London: Routledge.
Wober, M. (1975) Psychology in Africa. London: International African Institute. World Bank. (2005) “World Development Indicators.”
http://devdata.worldbank.org/dataonline/.
i
We acknowledge that some of the literature could be located in more than one research tradition. However, for the sake of simplicity, we have allocated each reference into only one category.
ii
Ambition manifests itself, in part, in the expectations that young people have with respect to education and occupational attainments later in life. The research literature contains many debates about the level of the relevance of expectations for predicting ultimate behaviour (Saha 1997), but no one argues that expectations are completely unimportant in long-term career attainments. Although the correlations between educational and occupational expectations and ultimate occupational attainments vary, we also know that as young people approach entry into the workforce, the correlations increase.
iii
One of the early theories about the difference between developed and less-developed countries was that the former countries were comprised of individuals with higher levels of ambition-based modal personalities than the latter. McLelland (1961) called this characteristic the achievement motive, or the need for achievement. This social-psychological explanation has found its way into a number of theories of development (particularly modernization theory), and during the past 30 years, there has been an assumption that students in a less-developed country lacked ambition, and that this was, in part, an explanation for the country’s underdeveloped condition.
iv
The relationship between expectations and attainments becomes more interesting when there is a mismatch between the two. This mismatch is particularly of interest in a comparative perspective. One would expect, for example, that expectations are related to perceived opportunity. Thus, the greater the perception of opportunity in the job world, the greater should be the level of expectations that will lead to that job. This would include both educational and occupational expectations. But in fact, there is evidence that this is not the case.
v
These variables are not strictly comparable between 2000 and 2003 due to differences in answer categories in the two surveys.