Thunderstorms: Life cycle analyses
and nowcasting based on multi-source
data
Isabella Z¨
obisch
Thunderstorms: Life cycle analyses
and nowcasting based on multi-source
data
Isabella Z¨
obisch
Dissertation
an der Fakult¨
at f¨
ur Physik
der Ludwig–Maximilians–Universit¨
at
M¨
unchen
vorgelegt von
Isabella Z¨
obisch
aus Eisenstadt
M¨
unchen, den 28.11.2019
Zweitgutachter: Prof. Markus Rapp
Tag der m¨undlichen Pr¨ufung: 28.01.2020
Zusammenfassung
Ziel dieser Dissertation ist es den Lebenszyklus von Gewittern zu analysieren und dadurch deren K¨urzestfristvorhersage (Nowcasting) zu verbessern. Zu diesem Zweck wurden basierend auf Satelliten-, Radar-, Blitz- und Modelldaten Lebenszykulsanal-ysen sowie ein Nowcasting erstellt. Die LebenszylusanalLebenszykulsanal-ysen umfassen Gewitter von unterschiedlichen Organisationsarten (Einzelzellen, Multizellen, Superzellen), die in den Sommermonaten Juni 2016, Mai, Juni, Juli 2017 und Juni 2018 ¨uber Deutschland detektiert wurden. Ein Gewitter wird anhand eines auf Satellitendaten basierenden Algorithmus (Cb-TRAM) definiert, der Gewitter detektiert, verfolgt und ihre zuk¨unftige Position bis zu 60 min vorhersagt. Diese ¨uber 1900 Gewitter wurden nach ihrer Lebens-dauer sortiert und in die Lebenszyklusstadien fr¨uhes Wachstum, fortgeschrittenes
Wachstum, Reife undZerfall unterteilt. Dadurch konnten unterschiedliche
Charakteris-tika des Lebenszyklus im Bezug auf Lebensdauer und Lebenszyklusstadium identifiziert werden. Parameter die f¨ur die Lebenszyklusanalysen verwendet wurden sind zum Beispiel: optische Dicke (τ), Helligkeitstemperatur (BT), Zellgr¨oße des Gewitters
(Acb), vertikal integriertes Fl¨ussigwasser (V IL), sowie die Modellparameter Convective
Available Potential Energy (CAP E) und die relative Feuchte (RH). Im Allgemeinen
zeigten die Beobachtungsdaten spezifische Merkmale f¨ur jedes Lebenszyklusstadium. Im Gegensatz dazu weisen die Modellparameter keine signifikanten Eigenschaften in den einzelnen Lebenszyklusstadien auf. Dennoch konnten Unterschiede zwischen den Lebenszyklen kurz- und langlebiger Gewitter sowohl in den Beobachtungs- wie auch in den Modelldaten ausgemacht werden. Zus¨atzlich wurden Lebenszyklusanalysen f¨ur
intensive (≥46 dBZ) und nicht-intensive (<46 dBZ) Gewitter sowie f¨ur Gewitter in
einer front Umgebung und nicht-front Umgebung erstellt.
Die Erkenntnisse aus den Lebenszyklusanalysen werden unter anderem f¨ur die Erstellung eines Nowcastingalgorithmus verwendet, der die verbleibende Lebensdauer eines bereits existierenden Gewitters vorhersagt, sowie sein aktuelles Lebenszyklussta-dium bestimmt (LOC-lifetime). Zus¨atzlich wird ein erster Ansatz vorgestellt, wie
die zuk¨unftige Intensit¨at eines Gewitters - mit derselben mathematischen Methode wie die der Lebensdauervorhersage - vorhergesagt werden kann (LOC-intensity). Die
Vorhersage des Nowcastingalgorithmus LOC-lifetime zeigt eine Verbesserung im
Ver-gleich zu der eines auf reinen Extrapolationsmethoden basierenden Algorithmus. Des Weiteren wird gezeigt, dass die Modellparameter den geringsten positiven Effekt und die Radarparameter den gr¨oßten positiven Effekt auf die Qualit¨at der Vorhersage von
LOC-lifetime haben. Je gr¨oßer das Toleranzinterval ist, welches mittels der
Standard-abweichung berechnet wird, desto gr¨oßer die Verbesserung von LOC-lifetime gegen¨uber
der Vorhersage der Extrapolationsmethode. Nichtsdestotrotz sind große Toleranzin-tervalle notwendig um verl¨assliche Vorhersagen zu erhalten, da diese durch die hohe Variabilit¨at der einzelnen Gewitter stark gepr¨agt ist. Des Weiteren wird gezeigt, dass eine Vorhersage ausschließlich basierend auf den Informationen die zum Zeitpunkt der ersten Detektion verf¨ugbar sind, nur f¨ur die Vorhersage der verbleibenden Lebensdauer und nicht f¨ur die Intensit¨at verl¨asslich ist.
Abstract
This study analyses the life cycle of thunderstorms over Germany with the aim to select relevant parameters with predictive skill to improve the description and nowcasting of the thunderstorm life cycle. In contrast to previous analyses, multiple high resolution (in space and time) data sources are used and the life cycle fromearly development over
advanced development andmature to decay of several organization types is investigated
in detail. Basis are Cb-TRAM (Thunderstorm Tracking and Monitoring) cells in the period June 2016, May, June, and July 2017, and June 2018. Cb-TRAM is an algorithm to detect, track, and nowcast thunderstorms up to one hour using satellite data. For each of these thunderstorms the time series of selected parameters from satellite, ground-based radar, lightning, and model data were inspected. These include e.g. cloud optical thickness (τ), Brightness Temperature (BT), Area of the Cb-TRAM cell (Acb),
Vertically Integrated Liquid water (V IL), and the model parameters Convective
Available Potential Energy (CAP E) and Relative Humidity at 700 hPa (RH). In
order to learn more about differences between long- and short-lived thunderstorms, all thunderstorms were sorted by their lifetime and separated into the life cycle stages. Generally, satellite, radar and lightning data are the most suitable data to determine the actual life cycle stage of a thunderstorm. It is shown that the observational data parameters from satellite, ground-based radar and lightning show characteristic behavior in at least one of the four life cycle stages. Model parameters do not show these life cycle stage dependent characteristics. Nevertheless, there are parameters with predictive skill concerning lifetime in observational data as well as in model data. Additionally, the life cycle was analyzed for non-severe (<46 dBZ) and severe (≥46 dBZ) thunderstorms,
and for thunderstorms in a frontal and non-frontal environment.
These results were used to select meaningful parameters with respect to the nowcasting of the remaining lifetime, the calculation of the current stage of the thunderstorm (LOC-lifetime) and the prediction of the future intensity (LOC-intensity).
One result is that LOC-lifetime is more reliable than a lifetime prediction of an
extrapolation method based algorithm. Another result is that the parameters of the model data has the lowest positive impact on the fuzzy logic-based nowcasting model. Whereas radar parameters are crucial for the remaining lifetime prediction. The larger the tolerance interval around the predicted lifetime gets, the bigger is the improvement of LOC-lifetime compared to extrapolation method based predictions.
The tolerance interval is calculated from the standard deviation. Nevertheless, high tolerance intervals are needed to get a reliable output as the prediction is limited by the high variability of single thunderstorms. Further results show that predictions using only the first detection step are only reliable for the remaining lifetime and not for the future intensity.
Contents
1 Introduction 1
1.1 Motivation . . . 1
1.2 Background: Life cycle of convective clouds . . . 3
1.2.1 The thunderstorm life cycle . . . 6
1.2.2 Organization of thunderstorms . . . 8
1.3 State of the art . . . 9
1.3.1 Thunderstorm life cycle . . . 9
1.3.2 Thunderstorm nowcasting . . . 13
1.4 Basic concept, aims & outline . . . 16
2 Data sources and methods 19 2.1 Data sources . . . 19 2.1.1 Observational data . . . 19 2.1.2 Model data . . . 23 2.2 Data treatment . . . 24 2.3 Fuzzy logic . . . 27 2.4 Verification . . . 29
2.5 Definition of the thunderstorm life cycle in the analyzed data . . . 33
3 Analyses of the thunderstorm life cycle 37 3.1 Thunderstorm life cycle characteristics in the analyzed data . . . 37
3.1.1 Life cycle characteristics in observational data . . . 37
3.1.2 Life cycle characteristics in environmental data . . . 41
3.2 Variability of thunderstorm life cycle . . . 43
3.3 Thunderstorm life cycles in special conditions . . . 45
3.3.1 Synoptic situation: Frontal and non-frontal . . . 46
3.3.2 Intensity: Severe and non-severe . . . 48
3.4 Summary of the life cycle analyses . . . 51
4 Nowcasting of the thunderstorm life cycle 53 4.1 Combination of data used to nowcast thunderstorms lifetime . . . 53
4.1.1 Parameter selection for lifetime nowcasting . . . 54
4.2 Verification of lifetime prediction . . . 64
4.2.1 Comparison of the skill score values of simpler methods . . . 69
4.2.2 Sensitivity of nowcast to data sources . . . 72
4.3 First approach for intensity prediction . . . 74
4.4 Summary of the nowcasting . . . 78
5 Discussion 81
6 Conclusion 87
7 Outlook 91
Acronyms and Symbols 93
List of Figures 97
List of Tables 99
1 Introduction
1.1 Motivation
A modest thunderstorm cloud contains about 8x10⁶ kg of condensed water (Doswell
III, 2001). For condensation of this water, almost 1014 J of latent heat is released
over a period of roughly 25 min. This, during condensation released energy, can be compared to the latent heat of a “25 kiloton” bomb. A part of this energy creates severe weather events like hail, lightning, strong wind gusts and heavy precipitation sometimes followed by flooding or localized flash floods. Due to these weather phenomenons that occur together with thunderstorms, it is not surprising that thunderstorms have fascinated humans since the year dot and gave birth to myths and superstition. In ancient times, for instance, people believed that thunderstorms were a message from outer space, and in medieval times, lightning was seen to be a punishment of god. The Greek god “Zeus”, as well as the Nordic god “Thor” might be one of the most known explanations for lightning and thunder during this time. Thus, it is not surprising that these mystical weather events inspired poetry. Many poets describe the threatening and at the same time beautiful appearance of thunderstorms. Heinrich Heine (“Gewitter”), Otto Ernst (“Nach dem Gewitter”), or Emily Dickinson (“A Thunderstorm”) are just a few examples.
One of the first who studied the phenomenon of lightning scientifically was Benjamin Franklin in the 18th century. But the occurrence of thunderstorms and lightnings, and their underlying mechanisms, are not fully understood until today. The complexity of the underlying physics is only one reason for the difficulty of thunderstorm prediction in addition to the limited operationally available observation methods. As well as the research of thunderstorms, weather prediction has a long history. Synoptic weather prediction began in the period of 1850-1870 (Murphy, 1998). First computational weather models were developed in the early 20th century. Due to a better resolution of available data and increased power of processors, weather forecasting improved greatly in the last decades.
Today, thunderstorms are well known to still have high impact on society and safety (Brooks and Dotzek, 2008). This high impact results from the thunderstorms’ related weather events. These severe weather events cover a wide horizontal and especially vertical area, from the surface up to the tropopause in 11 km. On the ground, hail,
lightning and heavy rain affect society and safety. In May 2013, for instance, the effects of tornadoes injured nine people and destroyed 230 buildings with assumed losses of about 50 million euro in Germany, as the insurance agency “Munich Re” reported 1. In 2016, the music festival “Rock am Ring” was spontaneously interrupted
by a severe thunderstorm event. As the warning and, consequently, the security measures came to late, more than 50 people got hurt by a lightning stroke. 15 of them were injured severely, some of them even critically2. An earlier warning could have
contributed to an earlier start of security measures, and might have avoided these injuries. Although, losses that result from destroyed buildings can not be avoided by an improved thunderstorm nowcasting, personal injuries might be reduced.
In addition to these severe weather events on the ground, thunderstorms also contain severe regions at high altitude (for example, near the tropopause). For example, thunderstorms in higher heights cause icing of airplane turbines in the upper troposphere, leading to malfunctions (Tafferner et al., 2008). Other well known dangerous weather events connected to thunderstorms are convective turbulence and lightning. These severe weather events affect flight times negatively and pose a risk for crew and passengers. Therefore, thunderstorms are one of the most significant threats for aviation.
Since thunderstorms occur all over the world, an improved forecasting of thunderstorms would benefit many people. With regard to the fact that the frequency of severe thunderstorms over Europe will increase in future (R¨adler et al., 2019), an improved nowcasting becomes more meaningful. However, forecasting of thunderstorms is still a challenge to date. Based on dynamical and thermodynamic equations numerical weather forecast models are able to calculate the atmospheric state hours and days in advance. However, the model forecasts are not accurate enough to predict the exact location and time of the occurrence of thunderstorms, since observations to exactly describe the initial state for such calculations do not exist in the necessary resolution. Model forecasts can only give a rough estimate of the future atmospheric state and are not suitable to plan appropriate measures related to the mitigation of the impact of a thunderstorm.
In contrast, observations from satellite and weather radar enable the exact detection of existing thunderstorms and allow a short-term forecast up to a few hours (called nowcasting) based on the extrapolation of historic observations. Examples for such nowcasting algorithms are Cb-TRAM (Zinner et al., 2008), KONRAD (Lang, 2001), and CellMOS (Hoffmann, 2008). They provide an overview of the current thunderstorm situation and its predicted development in the near future. The inaccuracy grows
1 https://www.munichre.com/topics-online/en/climate-change-and-natural-disasters/ natural-disasters/storms/thunderstorms-germany-2016.html, 15.05.2019 2 https://www.faz.net/aktuell/gesellschaft/unwetter-bei-festival-bei-rock-am-ring/ -schlaegt-der-blitz-ein-14269078.html, 15.05.2019
1.2 Background: Life cycle of convective clouds
rapidly for nowcastings beyond one hour, since the extrapolation is just based on the development seen in the historic data and no physical equations are used to calculate the forecasts. In addition, the remaining lifetime of a thunderstorm and the trend of its intensity still remain unknown.
In a nutshell, thunderstorms have a huge vertical extended area, from the surface up to the tropopause, that is full of severe weather events. Additionally to the already severe weather events, accompanied with thunderstorms, climate change will lead to more intense thunderstorms (Sander, 2011). In order to be able to take appropriate actions to mitigate a thunderstorm’s impact, warning and rescue services, the public, aviation stakeholders, and further affected parties need accurate and reliable information on the occurrence, lifetime, and intensity of thunderstorms. Already today, thunderstorm nowcasting can be used to optimize flight routes spontaneously (Forster et al., 2016), resulting in reduced delays, fuel savings, and improved safety.
In the following, the basic knowledge of thunderstorm life cycle and organization is presented as preparation for the subsequent state of the art of thunderstorm life cycle analyses and nowcasting.
1.2 Background: Life cycle of convective clouds
In this chapter, the basic knowledge about the underlying mechanisms and physics of thunderstorms, the typical life cycle of a single thunderstorm, and different types of organization are presented.
The following introduction in convection is based on Doswell III (2001) if no other ref-erences are mentioned. The underlying mechanism behind thunderstorms is convection. Convection is – beside radiation and conduction – one of the three main processes of transportation of heat.
There are many forms of convection as described in Emanuel (1994). One form of convection is Deep Moist Convection (DMC) which is associated with thunderstorms. A detailed description of the underlying mechanisms of DMC is given in the next paragraphs.
The vertical component of heat transportation by convection is called buoyancy. A simplified way to describe buoyancy is:
B ≡gT −T 0 T0
where g is the acceleration of gravity, T is the temperature of an air parcel and T0 is
updraft and a negative buoyancy a downdraft. Buoyancy is a product of heat release and therefore a crucial aspect of thunderstorms.
The following explanations of the process of convective initiation are based on Schumann (2012). Beside an environmental temperature gradient rapidly decreasing with height, moisture must be abound in the lower troposphere for thunderstorm development. In many cases a trigger mechanism (a source of lift) is also necessary. An air parcel that is warmer at the surface than its environment rises due to the density differences between the parcel and the environment (warm air is less dense than cold air). The parcel rises dry adiabatically with a temperature decrease of ∼ −10 K km−1 due to
adiabatic expansion, as long as it is warmer than its environment and not saturated. If it rises further until it reaches the dewpoint and hits a saturation of 100%, water vapor condensates. At this height the Lifted Condensation Level is reached (LCL, see Figure 1.1). As long as the water vapor in the air parcel condensates, it rises moist adiabatically (usually between −5 to−9 K km−1), and the temperature decreases less
with height than in case of a dry adiabatic ascent, as latent heat is released during the phase change in the process of condensation. If the air parcel is no longer warmer than its environment, the air parcel has to be lifted to the Level of Free Convection (LFC), for further rising. Some of these trigger mechanisms that may lift the parcel are convergence, orographic forcing or solar heating. At the height of LFC the parcel is able to further rise moist adiabatically due to its higher temperature compared to the environment until the temperature of the parcel is equal or less than that of its surrounding environment. This is for example the case at the tropopause because of the reversed environmental temperature gradient in the stratosphere. The height where further vertical growth stops is called Equilibrium Level (EL).
The area between the temperature of the parcel and its surrounding environment from the LFC to the EL is called Convective Available Potential Energy (CAPE) and is a measure of instability. The definition of CAPE is given by
CAP E= Z zEL zLF C gT −T 0 T0 dz ≡ Z zEL zLF C B(z)dz
Where the buoyancy is integrated from the height of LFC (zLF C) to the height of EL
(zEL).
High CAPE values indicate a high potential for thunderstorms (Markowski and Richard-son, 2010). For instance, marginal convection is associated with CAPE values of 0-1000 J kg−1, CAPE values of 1000-2500 J kg−1 indicate moderate convection, and CAPE
values of 2500-4000 J kg−1 contribute to strong convection. If CAPE reaches higher
values than 4000 J kg−1, potential extreme convection is indicated. However while
high CAPE values are necessary for DMC, they are not sufficient. For instance, if an inversion layer at the planetary boundary layer inhibits the air parcel to lift to LFC, no DMC occurs. This inhibition can be measured in energy, that is necessary to
1.2 Background: Life cycle of convective clouds
lift a reference air parcel to its LFC and is called Convective INhibition (CIN). The calculation of CIN is very similar to CAPE, only the integration limits differ. For CIN calculation it is integrated from the surface to the LFC. If the storage of CAPE occurs over several days it is possible, that the accrued instability finally releases in form of severe convection. Large CAPE values and small CIN values are required for DMC, although CIN is necessary for large CAPE values to build up. Many further indices exists, which describe the physical state of the low- and mid-troposphere to estimate the probability of thunderstorm development. Most of them describe the instability of the atmosphere, such as the indices Showalter Index (SI, Showalter, 1953) and Lifted Index (LI, Galway, 1956). LI and SI are simpler calculations for the probability of thunderstorm development than CAPE and describe only single-level bouyancy. In contrast CAPE is calculated by vertical integration and includes the bouyant energy up to the level of free convection (LFC).
Figure 1.1: The temperature and dew point temperature (measured via radiosonde ascent) are plotted in this Skew-T log p diagram. Isotherms and isobars are shown together with isohumes (lines of equal mixing ration), isentropes (also called dry adiabats, lines of equal potential temperature), and pseudo-isentropes (also called moist adiabats, lines of equal pseudo equivalent potential temperature). In this example, the ascent curve of T(p) of a parcel having an initial temperature of 26°C at the surface and a dewpoint temperature of 21°C has been constructed. (Diagram taken from http://www.estofex.org/guide/,15.11.2019).
1.2.1 The thunderstorm life cycle
The life cycle of thunderstorms was defined by Byers and Braham Jr. (1948) for the first time. They separated the life cycle into three stages: towering cumulus stage, mature stage, and dissipation stage. The life cycle as described in detail in Doswell III (1985) is presented in the following paragraphs. This definition describes a textbook life cycle of single thunderstorm cells. The persistence of each life cycle stage depends on the type of organization as described in the next section (Section 1.2.2).
1. Towering cumulus stage
The first stage of the thunderstorm life cycle is named “growing stage” or “towering cumulus stage”. Characteristics of the growing stage are depicted in Figure 1.2. The towering cumulus stage is characterized by beginning of visible cloud formation and the initiation of an updraft. This updraft is accompanied by small scale downdrafts. The updrafts increase rapidly with height, since the temperature difference between the air parcel and the environment increases due to their different lapse rates (see Figure 1.1); thunderstorms typically show updrafts of about 10 m s−1 in 5 km height.
The warm moist air is transported upward and expands adiabatically, to higher levels. If relative humidity supersedes 100% (LCL in Figure 1.1), the water vapor in the air parcel condensates and further rises moist adiabatically. Consequently, cloud formation starts (convective initiation). The strong condensation leads to an intensifying updraft and cloud droplets reach high altitudes. If cloud droplets reach radii of 20 µm or larger,
coalescence starts to contribute to cloud droplet growth. The larger cloud droplets fall faster than small cloud droplets, collide with the smaller cloud droplets and merge together. Finally, precipitation and downdraft are initiated. The underlying physics for downdraft development is presented in the next paragraph. Ordinary thunderstorm cells reach diameters of about 5-8 km during their “growing stage”. Most clouds dissipate after this stage and do not evolve to the mature stage, because the downdraft impedes further buoyancy supply.
2. Mature stage
Once precipitation reaches the ground, the “mature stage” begins. In this stage the thunderstorm cell reaches its maximum intensity. This intense period is dominated by strong up- and downdrafts of which the updrafts lead to an ongoing vertical growth. Air masses rise, until the EL is reached (see Figure 1.1). During the growth, water droplets grow and become supercooled at high altitudes. These supercooled water droplets might freeze to ice particles. The ice particle growth can be described by the Wegener-Bergeron-Findeisen Process (Wegener, 1911; Bergeron, 1935; Findeisen, 1938): Since supercooled water droplets and ice particles coexist above freezing level, the ice particles grow at the expense of supercooled water droplets. This is the case because
1.2 Background: Life cycle of convective clouds
the saturation vapor pressure is lower for ice than for water. Hail, for example, mostly occurs if a strong updraft is present. For a more detailed description of precipitation forms see, for example, Tessendorf et al. (2005). In general, the upcoming air masses reaching the tropopause can not rise higher, therefore, an anvil is built via divergence at the tropopause. In case of a very strong updraft the upcoming air even overshoots into the dry warm stable conditions of the stratosphere. Due to mixing with relatively warm and dry stratospheric air cloud droplets evaporate rapidly and further vertical growth is impeded mostly by the stable stratification in the stratosphere.
Figure 1.2: Sketch of the three life cycle stages of a single thunderstorm cell after Byers and Braham Jr. (1948)
For the development of a downdraft, two different origins are possible. One possibility is the evaporation of cloud droplets by entrainment of dry air. Evaporation of condensed air leads to a cooling of the surrounding air by up to 3.7°C. Consequently, the colder air starts to sink building a cold pool at the surface. The second possibility for onset of downdraft is that falling precipitation droplets transport some of the surrounding air downwards.
the storms are not well understood until today. It is assumed that the collision of ice particles with supercooled water is crucial for cloud electrification (Reynolds et al., 1957; Saunders, 1993; Wallace and Hobbs, 2006). Lightning occurs if the electrical field caused by charge separation into positive (at cloud top and surface) and negative (at cloud bottom) ions due to friction becomes too strong. The discharge happens by inner cloud lightning (Cloud-to-Cloud, CC) or by lightning between cloud and surface (Cloud-to-Ground, CG). The process of lightning is described in detail in Feynman
et al. (1964).
3. Dissipating stage
The “dissipating stage” supersedes the “mature stage” once the source of the updraft is stopped by the previously developed cold pool that spreads out horizontally at the surface. Finally, the updraft diminishes rapidly due to the missing buoyancy supply. The dissipating stage is characterized by precipitation and downdrafts. Generally no lightning activity exists during the dissipating stage. The persistence of the dissipating stage depends on the type of organization as described in the next section (Section 1.2.2)
1.2.2 Organization of thunderstorms
Thunderstorms can be classified into three different types of organization: single cells, multicells and supercells (H¨oller, 1994). This classification is based on a method developed by Foote (1985), and implies a differentiation of storms depending on their lifetime, evolutionary features, and forming processes.
The organization types and their main characteristics by (H¨oller, 1994) are summed up in the following and described afterwards:
• Single cells: The complete life cycle (growth, mature, and decay) of the thun-derstorm takes place in one isolated cell. Typical lifetimes of single cells are 20-30min.
• Multicells: A group of single cells in which each cell is in different life cycle stages. Multicells can last a few hours.
• Supercells: One enormous cell, in which all life cycle stages coexist. Supercells have a deep rotating updraft named mesocyclone. They can last up to 12 hours. Single cells do not show any organized subsequently initiated convection. Thus, only one updraft is present. Typically single cells develop in an environment with weak wind shear. Single cells often develop due to the diurnal circle of the boundary layer and therefore occur during the time of maximum daytime heating and decay after sunset. To predict whether or not single cells produce hail is often difficult, because of their
1.3 State of the art
short time range and the possible large range of CAPE values (a few hundred J kg−1 to >2000 J kg−1). Usually severe weather occurs in an environment with CAPE values
of >2000 J kg−1 (Markowski and Richardson, 2010).
The most common form of convection are multicells. In multicells several cells are grouped in an organized cluster, thus different life cycle stages exist. If for example one cell is already decaying, while another cell is in its mature stage and another in its growing stage, more than one updraft region exists simultaneously. This co-existence of several life cycle stages is possible, because the vertical wind shear is moderate (0-6 km wind field difference usually has a magnitude of 10-20 m s−1) for multicells and
separates the updraft and downdraft region. Additionally, the cold pool acts as source of lift for neighboring air parcels. Multicells can occur in environments with high or low CAPE (Markowski and Richardson, 2010).
Hail with a diameter of 5 cm or larger, or tornadoes are often the results of supercells. More than 200 flashes per minute can occur in those supercells. Lifetimes of 1 to 4 hours are usual, although some supercells last up to 8 hours. Supercells have only one dominant updraft region that shows a quasi-steady appearance. Additionally, a persistent mesocyclone within the updraft is essential for the occurrence of supercells. The mesocyclone is defined by a region of vertical vorticity. For the development of such a mesocyclone, a large vertical wind shear extended over most parts of the troposphere is necessary. Since the dynamic effects due to the vertical wind shear and the presence of the mesocyclone can enhance the updraft, large CAPE values are no necessary condition. Supercells exists already for CAPE values of about>1000 J kg−1
(Markowski and Richardson, 2010).
Since the aim of this thesis is to predict the lifetime of convective systems in general, no differentiation is done for these three types of organization. Therefore, the characteristics of thunderstorms of any type of convective system are considered in the life cycle analyses and nowcasting.
1.3 State of the art
1.3.1 Thunderstorm life cycle
In order to improve the nowcasting of thunderstorms, profound knowledge of the typical life cycle of thunderstorms is essential. Nowadays a large variety of observational methods is available to investigate small scale atmospheric processes. First, the major methods for an operational thunderstorm observation that are available high-resolution in time and space over Germany are introduced including satellite, ground-based radar
and lightning detection. Afterwards, studies about the thunderstorm life cycle are presented.
The satellites, which measurements are used in this thesis, is geostationary and at a height of about 36.000 km. It is able to detect outgoing electromagnetic radiation via a radiometer and measure twelve different spectral ranges, from visible (VIS) / near infrared (NIR) to water vapor (WV) and infrared (IR) to high-resolution visible (HRV). Generally, clouds have high reflectivities in the visible range, resulting in bright clouds in the VIS. The NIR channels are able to measure ice, therefore, they can be used for identification of ice clouds. While the VIS channels can be used for observing the thickness of clouds, the IR channels are able to provide information about the state of aggregation and the particle size. As the radiation emitted increases with temperature and spectral emission coefficient, the cloud top height can be measured indirectly by the IR channels. Since the temperature decreases with increasing altitude, high clouds (low temperatures) show smaller values of IR. Additionally, the WV channels provide
information about the water vapor content in the atmosphere and its layers.3
Ground-based radar systems can also be used to analyze some thunderstorm character-istics. RADAR is the acronym for “RAdio Detection And Ranging” which implies that radio waves are measured. This is done via the “Doppler Effect“ to get information about particle movement. The radar sends a high frequent electromagnetic wave in a desired direction into the atmosphere, where a part of the signal will be reflected, for example, off a precipiation particle. The reflected part of the electromagnetic wave is measured at the radar and transformed into a digitalized signal. This way the location of the particle and the intensity (intensity of the reflected signal) of, for example, precipitation can be measured. These continuous high-resolution radar measurements in varying azimut and elevation angle are used for operational weather observations.4
Another thunderstorm observational method used operationally is the lightning detec-tion. As previously described, thunderstorms are defined by thunder which a lightning must precede, consequently, lightning detections act as indicator for thunderstorm occurrence. Since lightning produces electromagnetic radiation a net of measurement systems can detect the location of a lightning due to arrival differences of the signal. In general, it is possible to measure the intensity, the height, the location and the type (cloud-to-ground or cloud-to-cloud) of the lightning.5
The first model describing the life cycle of a thunderstorm was presented by Byers and Braham Jr. (1948). They separated the life cycle on the basis of observations and measurements (especially airplane data) from the ”Thunderstorm Project“ into
3 https://www.dwd.de/DE/forschung/atmosphaerenbeob/wettersatelliten/satelliten_ meteosat_node.html,15.11.2019 4 https://www.dwd.de/DE/forschung/atmosphaerenbeob/wetterradar/wetterradar_node. html,15.11.2019 5 https://www.nowcast.de/technologie/funktionsweise-von-linet.html,15.11.2019
1.3 State of the art
three stages: Growth, mature, and dissipation (as explained in the previous section). The stages were characterized and defined by wind-field and microphysics. During the early cumulus stage surface convergence happens 20-30 min before a radar echo can be measured. Machado et al. (1997) analyzed the life cycle of Mesoscale Convective Systems (MCS) in satellite data with a temporal resolution of 3 hours. There, a MCS is defined as a ”mesoscale cluster of deep convection“. They especially focused on the trend of the cloud top temperature and the coverage area of the cloud system of deep convective systems over the Americas (tropical and middle latitude). The study showed that size and lifetime of thunderstorm cells correlate nearly linearly. This was also seen by Feng et al. (2012). Furthermore, long-lived cells reach larger sizes than short-lived cells, while no differences between long- and short-lived cells were found for the cloud top temperature gradient. A correlation between updraft and cloud droplet size can be seen for increased reflectivity, caused by strong updrafts that tends to produce great amounts of small ice particles (Setv´ak and Doswell, 1991). The life cycle of Sahelian MCS was analyzed by Mathon and Laurent (2001) with a temporal resolution of 30 min. They confirmed that the mean radius of MCSs correlates roughly linearly with their lifetime. Roberts and Rutledge (2003) analyzed the convective initiation of thunderstorms on basis of satellite and radar data with a temporal resolution of 15 min. They confirmed high cooling rates at cloud tops 30 min before 35 dBZ are measured. In thermal radiation, growing clouds show a rapid cooling of cloud tops, indicating a release of Convective Available Potential Energy (CAPE) (Senf et al., 2015). CAPE can also be related to the maximum updraft velocity according to Emanuel (1994). Freud et al. (2008) analyzed the size of convective cloud droplets by in-situ measurements. They showed that cloud droplet size increases with cloud depth. MacKeen et al. (1998) analyzed the correlation of lifetime and radar reflectivity. Almost 1000 thunderstorms were observed over the analyzed area in Memphis, Tennessee. It was shown that radar reflectivity parameters do not show any predictive skill concerning lifetimes. Pope et al. (2008) found cloud top temperature decreases slowly once the size of a thunderstorm reached its maximum. The anvil formation is suggested to lead to a horizontal growth right before mature stage. A detailed study about the life cycle of thunderstorms and lightning occurrence was given from Mattos and Machado (2010). They depict that a relationship between the area, cloud top temperature and the lightning occurrence exists. The cloud-to-ground lightning occurrence correlates positively with the size of the observed thunderstorm area. Additionally, high cloud tops are strongly correlated with areas of increased electrical activity. However, high cloud tops are no essential criterion for lightning activity (Goodman et al., 1988). Further Goodman and MacGorman (1986) remarked that lightning activity appears to be independent of thunderstorm size and life cycle duration.
Jurkovi´c et al. (2015) observed a correlation between spatial distribution of lightning and of detected overshooting tops. Whereas, this correlation is less pronounced in southeastern Germany where lightning occur in the vicinity of overshooting tops. Higher
values of lightning activity were detected slightly before an overshooting top occurred. Additionally, Mikus and Mahovic (2013) showed that overshooting tops are associated to precipitation and wind gusts rather than to temperature and humidity changes. Mecikalski et al. (2011) used satellite data to describe and understand the physical attributes of growing single cell thunderstorms. They found that during the growing phase, cloud optical thickness and cloud droplet size increase until cloud tops glaciate, and initiate a decrease in cloud droplet size. The study by Mecikalski et al. (2012) presented a more detailed life cycle definition than Byers and Braham Jr. (1948) and proposed five stages: Pre-convection, convective initiation, deep convective growth, mature, and dissipation. Description of the pre-convection and convective initiation stages were possible due to a higher temporal and spatial resolution of satellite data. The pre-convection stage is represented by a 4D wind field, before convective initiation occurs. Multi-spectral satellite radiance can be used in combination with temperature and moisture profiles to describe this stage. Additionally, the characteristics of the pre-convective environment can be observed by rawinsonde profiles. The key forcing mechanisms upper level divergence and low level convergence can be measured this way. The beginning of convective initiation is defined by the onset of vertical growth. This is indicated by the first detection of a 35 dBZ radar echo, for instance. During the convective initiation, cloud tops cool and glaciate. Existing precipitation in clouds can be detected by radar. After Mecikalski et al. (2012), the mature stage is characterized by a region of strong vertical motion that advects ice hydro-meteors into the upper troposphere and lower stratosphere.
Davini et al. (2012) analyzed the life cycle of storms in northwestern Italy on the basis of radar data with a temporal resolution of 10 min. They showed that the maximum reflectivity is detected predominantly in the first half of the life cycle and is higher for long-lived thunderstorms than for short-lived thunderstorms. The maximum of areal extent was observed in the last half of the life cycle. Further they found that reflectivity values at the beginning of a thunderstorm allow to draw conclusions about the thunderstorm’s lifetime. Liu and Li (2016) analyzed the life cycle of severe thunderstorms via radar and lightning data and examined the spatial and temporal distribution of the lifetime of thunderstorms. They differentiated between the categories initiation, development, termination, merge, and split. The highest number of thunderstorms was detected in May. Most of the analyzed thunderstorms had a lifetime between 5 and 20 min and were initiated during 2100 to 0000 UTC and terminated during 2100 to 0300 UTC. In a study of the life cycle of hailstorms over Germany on basis of lightning and radar data, Wapler (2017) revealed that the lightning intensity of hailstorms is much higher than that of ordinary thunderstorms. Furthermore, hailstorms exhibit a lightning jump just before hail onset. A positive correlation of the maximum cloud top height, anvil expansion rate, maximum precipitation intensity and core size was found by Senf and Deneke (2017) for thunderstorms over Central Europe. They also proved that precipitation already occurs 30 min prior to maximum
1.3 State of the art
cloud top cooling. On thundery days, an especially strong conditionally unstable layer is present between 850 and 500 hPa (Huntrieser et al., 1997). They also showed that the vertical wind shear and the relative humidity correlate well with the occurrence of thunderstorms.
All these studies either focus on specific aspects of the thunderstorm life cycle or mainly make use of observations from only one or two data sources. In this thesis, the life cycle of thunderstorms is analyzed for the first time on the basis of a variety of data sources from observations high-resolution in space and time and a NWP model. The previous studies analyze mostly one special type of thunderstorm organization, for example, single cells or MCSs. In this thesis, no differentiation is done between the different types of organization with respect to a future nowcasting. In order to find typical characteristics in every life cycle stage, thunderstorms are analyzed in a data set of five months. The aim of this thesis is to identify relevant parameters with predictive skill and to use them to improve the nowcasting of thunderstorms concerning their lifetime and intensity. Several studies about the nowcasting of thunderstorms were conducted and an overview is given in the following.
1.3.2 Thunderstorm nowcasting
Now, important studies on the predictive skill of certain analyzed parameters are presented, followed by a summary of existing nowcasting methods.
Parameters for nowcasting
The parameter CAPE is a well known predictor for severe storms (Rasmussen and Blanchard, 1998). Rosenfeld et al. (2008) analyzed the predictive skill and relation of the cloud top temperature and cloud droplet size. According to them, strong updrafts connected with hail occurrence are responsible for a delayed growth of cloud droplet size and lower cloud top temperatures. Therefore, hail as well as tornadoes can be predicted with lead times of up to 2 hours by taking the relationship criteria into account. The areal growth rate, detected in satellite data is greater for severe storms than for non-severe thunderstorms during their vertical expansion (Adler and Fenn, 1979). The parameter Vertically Integrated Liquid water (VIL) is commonly used as an estimate of the total mass of precipitation and further can be used to differentiate between severe and non-severe thunderstorms (Kitzmiller et al., 1995). An algorithm was developed to detect severe storms, on basis of the radar parameter VIL and the areal expansion. The correlation between high VIL values and severe storms was first published in 1970s (Greene and Clark, 1972). Additionally, a positive correlation between VIL and lightning occurrence was observed by Watson et al. (1995). As they found, one criterion for lightning occurrence is that VIL values are greater than
1 kgm−1. Hartung et al. (2013) showed that there is a correlation between cloud top
cooling rates during convective initiation, rainfall intensity and hail occurrence in the later stages of the life cycle. Correspondingly to this, Cintineo and Stensrud (2013) analyzed the predictive skill of temporal change of satellite derived cloud properties for future severity. They found that the trend of the optical thickness, the cloud particle size, emissivity and cloud top phase are parameters with predictive skill.
Several groups already worked on the prediction of thunderstorm intensity. Dvorak (1975) estimates the intensity of a cyclone by summarizing parameters, derived from satellite pictures. To detect severe thunderstorms early in their development, Nisi et al. (2014) developed the “context and scale oriented thunderstorm satellite predictors
development” (COALITION) algorithm. This object-oriented algorithm uses satellite, radar, and model data, as well as climatology. The aim is to predict whether or not a thunderstorm cell will develop to a severe thunderstorm within the next 30 min. Lead times of 5 to 60 min were analyzed, resulting in reliable predictions for lead times up to 20 min. For lead times greater than 20 min the prediction became less reliable. Already Mecikalski et al. (2015) combined data from satellite observations with the model data parameters CAPE and convective inhibition energy to improve the prediction of convective initiation. They successfully reduced the ratio of the false alarms by combining these two data sources, compared to predictions based on only one of these two data sources. A more recent study was made by Mecikalski et al. (2016) in which they analyzed satellite fields and their prediction ability in the early life cycle stages of severe thunderstorms and their future intensity. Especially the cloud top temperature and cloud droplet size ratio played a significant role in their analysis. Farnell et al. (2017) developed an algorithm that predicts severe storms based on the occurrence of
lightning jumps (Williams et al., 1999). The algorithm is based on the assumption that a lightning jump occurs right before a storm intensifies. This indicator is presented in other studies as well (Darden et al., 2010; Wapler, 2017). Several detection algorithms (Roberts and Rutledge, 2003; Zinner et al., 2008) use the cloud top cooling rate for detection and nowcasting of strong vertical growth (which is an indicator for convection initiation, as previously mentioned).
Methods for nowcasting
In the following paragraphs, an overview of the current research on nowcasting models is presented. Basically, three categories of nowcasting methods exist: extrapolation techniques, numerical weather prediction models (NWP), and expert knowledge-based systems that combine extrapolation techniques and NWP (Wilson et al., 1998, 2010; Sun et al., 2014).
An example for a nowcasting model based on extrapolation techniques is the algorithm “Thunderstorm Identification, Tracking and Nowcasting” (TITAN, Dixon and Wiener,
1.3 State of the art
1993). TITAN is a radar based nowcasting algorithm that uses the centroid tracking method. Thus, the algorithm was not developed to nowcast the lifetime of single thunderstorm cells, but to calculate motion vectors of radar echoes. Neither storm initiation nor thunderstorm life cycle can be predicted by this algorithm. Another example for an extrapolation based algorithm to nowcast thunderstorms is the satellite based algorithm “CumulonimBus TRacking And Monitoring“ (Cb-TRAM, Zinner et al., 2008). Since this algorithm plays a crucial role for this thesis, it will be explained in great detail in Chapter 2.1.
Today, several methods are used for nowcasting thunderstorms. There are on the one hand the commonly used extrapolation methods and on the other hand newly developed methods such as fuzzy logic or machine learning. The fuzzy logic-based algorithm Auto-Nowcast System (ANC) nowcasts the future location of storms for 0-1 hour (Mueller et al., 2003). They added a combination of predictor fields based on radar, satellite, sounding, mesonet and profiler data and a numerical boundary layer model to a forecaster input and detection algorithms. In this algorithm, the life cycle is separated into the stages initiation, growth, and decay. This life cycle information is used to decide, if the contour of a predicted thunderstorm is newly developed, increasing, or decreasing comparison to a currently existing contour. In contrast to extrapolation techniques, the nowcasting of storm location is improved by the fuzzy logic-based ANC method in regards to the probability of detection. However, the false alarm ratio also showed increased values for ANC. One example for the application of machine learning for nowcasting thunderstorms is presented in Han et al. (2017). Within the machine learning framework, they developed a support vector machine box-based nowcasting method using variational Doppler radar analysis system data. They improved the nowcasting of thunderstorm movement and growth within the next 30 min compared to TITAN.
Most of the presented nowcasting tools were developed to predict the convective initiation of thunderstorms or their severity, in addition to the movement and local dis-placement. Hence, nowcasting of remaining lifetime is neglected often. It is a challenge to predict the remaining lifetime of thunderstorms, primarily because thunderstorm cells can split into several thunderstorm cells or they merge during their life cycle. Westcott (1994) showed that radar echoes of merging thunderstorm cells are initially taller and slightly larger than those without merging. After merging, more than half of the thunderstorms were growing again. Consequently, this uncertain behavior impedes the prediction of future development and remaining lifetime of thunderstorms.
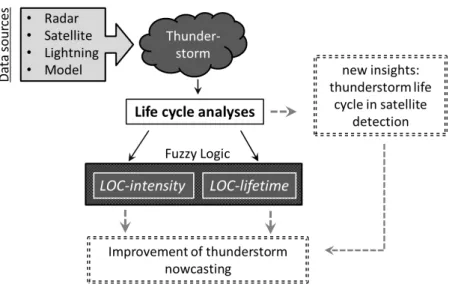
The aim of this thesis is to describe the life cycle of thunderstorms detailed by using a multi-sourced data set and to improve the nowcasting of the remaining lifetime and intensity of thunderstorms. An overview of the basic concept is given in the following.
1.4 Basic concept, aims & outline
Nowadays, the resolution in time and space of observational and model data increases rapidly. Also the variety of operationally available parameters is getting more diverse. Hence, the aim of this thesis is, to select parameters with predictive skill from satellite, radar, lightning and model data, to combine them and to improve the nowcasting of thunderstorms. Especially the lifetime prediction is focused in this thesis, due to its high impact on society as described in Brooks and Dotzek (2008).
This thesis is separated into two main parts: The first part is about the analyses of the thunderstorm life cycle and the second about the development and verification of two nowcasting models. A thunderstorm includes a broad variety of possible thunderstorm organization types and is often a thunderstorm complex (for example, a multicell) than a single thunderstorm cell, consequently the following named thunderstorm is described by thunderstorms of various organization types. The basic concept is outlined in Figure 1.3, including the main work packages and aims. At the start, the data sources satellite, radar, lightning, and model were chosen as data sources, due to their operational availability, and spatial and temporal resolution. The satellite based algorithm “CumulonimBus TRAcking and Monitoring” (Zinner et al., 2008) was used to define the thunderstorms. As it is crucial to understand and learn more about the behavior during the life cycle of a thunderstorm life cycle to predict future developments, the thunderstorm life cycles were analyzed for parameters from these data sources. Additionally, differences between the life cycle of short- and long-lived thunderstorms, as well as, differences between the life cycle of severe and non-severe thunderstorms were analyzed.
The second part of this thesis contains the development and verification of the now-casting models. These models calculate the current stage and predict the remaining lifetime (LOC-lifetime), and nowcast the future intensity (LOC-intensity). Parameters
with predictive skill were selected for the two nowcasting models LOC-intensity and
LOC-lifetime. After the parameter selection, the parameters were combined and
inte-grated into the nowcasting models. This has done via the mathematical method “fuzzy logic”.
The life cycle analyses and the development of the nowcasting models LOC-lifetime
and LOC-intensity are based on the following hypotheses:
1. Model and observational data are able to represent the thunderstorm life cycle or to indicate the thunderstorm lifetime
2. The nowcasting of thunderstorms can be improved using such a life cycle de-scription compared to extrapolation methods, as shown by a reduced false alarm ratio
1.4 Basic concept, aims & outline
Figure 1.3: Concept of the thesis and primary aims (dashed lines), where a thunder-storm is defined by a satellite detection method.
The data sources satellite, radar, lightning, and model, are described in detail in Chapter 2.1, together with their corresponding parameters. Additionally parameter allocation of thunderstorms and the method fuzzy logic that is used for nowcasting is explained. At the end of this chapter, the methods used for validation of the nowcasting model, are presented, as well as the thunderstorm definition used for the life cycle analyses.
The approaches for the life cycle analyses and for the development of the nowcasting modelsLOC-lifetime and LOC-intensity are outlined in the following. The results of
the life cycle analyses and the nowcasting model are presented in Chapter 3 and 4. The first part of this thesis, the analyses of the thunderstorm life cycle in multi-sourced data for June of 2016; May, June, and July of 2017; and June of 2018, is contained in Chapter 3. For these analyses the thunderstorms were sorted by their lifetime and nominated to one lifetime class. Therefore, the differences between life cycles of long-and short-lived thunderstorms, as well as, differences between the single life cycle stages can be characterized. The variability between thunderstorms is presented, additionally to a brief study about life cycle differences with regard to the synoptic situation and the thunderstorm intensity.
The nowcasting modelsLOC-lifetime andLOC-intensityand their results are the second
part of this thesis and presented in Chapter 4. The nowcasting modelLOC-intensity is
a first approach for intensity prediction with fuzzy logic and is presented in a separate section at the end of the chapter. The LOC-lifetime model calculates the remaining
lifetime and current life cycle stage. The LOC-intensity model predicts the future
(≥46 dBZ). In the previous life cycle analyses parameters with predictive skill were
determined. After the parameter selection, the fuzzy logic-based nowcasting model
LOC-lifetime is described and the results are presented. Afterwards, the LOC-lifetime
model is verified. Additionally, the sensitivity of the nowcasting model LOC-lifetime
is analyzed with respect to the input data sources, as well as to the shape of the membership function and its thresholds. At the end of this chapter, a first approach for intensity prediction, called LOC-intensity, is presented.
Afterwards, the results are discussed in Chapter 5. In Chapter 6 the results are com-pared to the hypotheses. The future work is outlined in Chapter 7.
Concluding, the following questions will be answered in this thesis:
(a) Can the thunderstorm life cycle be described by observational and model data, and what are the characteristics for each life cycle stage and lifetime?
(b) Does the information of the thunderstorm life cycle data improve the thunderstorm nowcasting?
A wide variety of related work, and a profound knowledge about thunderstorms already exists as shown in the literature review. Although, thunderstorms are studied well, this thesis contains some unique features. The most unique features of this thesis are summed up in the following:
− multi-sourced data set, observational (satellite, radar, lightning) and model data,
available for almost 2000 thunderstorms
− wide variety of thunderstorm organizations included in life cycle analyses − systematic parameter selection for nowcasting models
− methodical determination of membership thresholds
− remaining lifetime prediction on basis of a multi-sourced data set for every
thunderstorm individually for every detection time step
The most noteworthy point of these is the multi-sourced data set. On basis of this, it is possible to compare parameters from satellite, radar, lightning, and model data by the same method of analyses. This systematical analyses enable the comparison of the results between a variety of data sources.
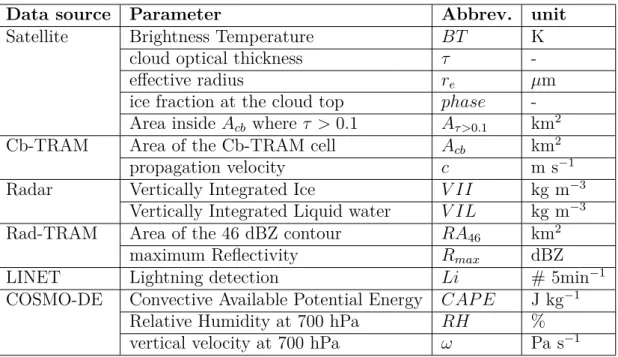
2 Data sources and methods
2.1 Data sources
In the last decades, the temporal and spatial resolution of observational and model data got more detailed. Therefore physical processes can be build up that could not be identified with observations before. Due to the development of high performance computers, weather models are able to resolve smaller physical processes as well. Core of this study is to analyze parameters from satellite data from METEOSAT-8, ground-based radar data from the German RX-radar network, lightning data provided by “nowcast GmbH” and Numerical Weather Prediction (NWP) model data from the Deutschen Wetterdienst (DWD, German Weather Service) with the aim to extract those parameters that show any predictive skill concerning the lifetime or intensity of thunderstorms. Due to the variety of the data sources it is possible to investigate the thunderstorm life cycle from micro-scale to macro-scale. Satellite, radar, and lightning data are available in 5 min frequency. The model data with lower temporal resolution is interpolated to 5 min resolution in order to enable a comparison with the observations. The high temporal and spatial resolution over Germany, and the operational availability of these data sources is the reason for choosing this data set. In the following, the analyzed parameters from the different data sources are described in detail. A summary of all available parameters is given in Table 2.1. The way the single parameters are calculated and assigned to a thunderstorm is described in Section 2.2.
2.1.1 Observational data
Satellite data
The visible (VIS) and infrared (IR) channels from the rapid scanning mode of ME-TEOSAT ”Spinning Enhanced Visible and Infra-Red Imager” (SEVIRI) are used to determine the parameters cloud optical thickness (τ) , effective radius (re), ice fraction
at the cloud top (phase), and Brightness Temperature (BT) with the “Algorithm for
the Physical Investigation of Clouds with SEVIRI” (APICS) developed at “Deutsches Zentrum f¨ur Luft- und Raumfahrt e.V.” (DLR, German Aerospace Center) and de-scribed in Bugliaro et al. (2011). Values of 1 forphaseindicate cloud top in water phase
and values of 2 an ice phased cloud top. Values between 1 and 2 indicate a mixed phase. The data has a temporal resolution of 5 min and a spatial resolution of 3 km x 3 km at the sub-satellite point. The here mainly used satellite METEOSAT-8 is located 41.5 °E and 36,000 km above the Equator. The parameterBT follows from measurements
in the IR 10.8 µm window channel and the black-body assumption. The parameters τ
and re are calculated on basis of two channels, VIS 0.6 µm and NIR 1.6 µm, where
NIR 1.6 µm accounts for water or ice absorption and is thus sensitive to particle size
while both provide information on optical thickness. While the actual optical thickness of deep convection can easily reach values of several 100s or even 1000, the change of solar reflectivity with increasing optical thickness diminishes. Limited by measurement accuracy the retrieved values of τ are limited to a maximum of 100. Due to the fact,
that thunderstorm cloud tops are not at ground level and the satellite observes from higher heights, it has to take care of the parallax correction before assigned to the thunderstorm. The parallax correction is further explained in the next Section (2.2). Cb-TRAM
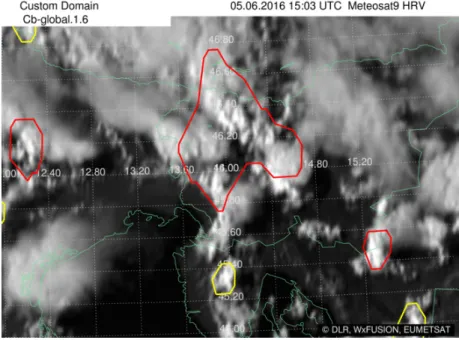
In this study, a thunderstorm is defined as an object identified by “CumulonimBus TRacking And Monitoring“ (Cb-TRAM), an algorithm that detects, tracks, and nowcasts deep convective cells based on Meteosat Second Generation (MSG) rapid scanning data (Zinner et al., 2008, 2013). Three different development stages are distinguished by Cb-TRAM using two IR, one water vapor (WV), and the high-resolution visible (HRV) channels. Convective cells that belong to the Cb-TRAM warning level “early development” show strong vertical and/or horizontal growth indicated by rapid cooling in the IR 10.8 µmchannel and a significant increase in the
HRV reflectivity. The Cb-TRAM warning level “rapid development” is detected through a strong cooling in the WV 6.2 µm channel, and the level “mature-thunderstorm” is
determined using a difference of WV 6.2 µmand IR 10.8µmand a strong local texture
in the HRV channel. Based on an image matching algorithm a displacement vector field is derived and used to track each thunderstorm in time. In addition, the displacement vector field is used here to perform a backward-extrapolation of all cell positions for 30 min before the first detection by Cb-TRAM and a forward-extrapolation of positions for 60 min after the last detection. Although detection in satellite data is expected to cover the earliest and last parts of developments better than any other observation data set (under clear air conditions), the coverage in time by the basic object definition is extended this way. This will allow a more complete analysis of observational signals of otherwise excluded parts of convective initiation and dissipation. This way an analysis of cloud and environmental parameters becomes possible shortly before the point in time that Cb-TRAM considers as a convection detection as well as the last decaying when no active convection cell is detected anymore. The Area inside Acb
2.1 Data sources
detected thunderstorm starts as soon asAτ >0.1 is greater than 0 and ends when Aτ >0.1
is equal to 0 again. Since the HRV channel is used to calculate τ only thunderstorms
occurring in the daytime are considered in the life cycle analysis. Cb-TRAM uses for the analyzed period a constant cloud top height of 10 km for parallax correction. No distinction between different organization types is done, as indicated in Figure 2.1, most Cb-TRAM cells contain several updraft regions (indicating multicells). Therefore, the life cycle analyses of this study comprises single cells, multicells and supercells.
Figure 2.1: Example for Cb-TRAM detection based on satellite data in the East of the Alps on June 5, 2016 at 3 pm GMT. Red contours show cells assigned to warning level “mature-thunderstorm” and yellow cells indicate thunderstorms with warning level “early development”.
Radar data
The DWD operates a network of weather radars (Helmert et al., 2014). Radar mea-surements allow area-wide precipitation detection, local and regional. 17 polarimetric Doppler C-Band radar systems are distributed over Germany (see Figure 2.3, dark grey shaded area over Germany). Each of it provides a new volume scan every 5 min with a horizontal radius of up to 180 km and a vertical extent from surface near layers to the upper troposphere (about 10 km height). These polarimetric measurements provide information of microphysical precipitation processes. The reflectivity represents the magnitude of the reflected radar pulse (Schumann, 2012), where the reflectivity factor
volumeV with the assumption, that water particles much smaller than the wavelength are measured z = 1 V n X i=1 Di6
The reflectivity factor is expressed as a logarithmic ratio ralated to the reflectivity factor of a raindrop with a diameter of 1 mm (Schumann, 2012). This logarithmic reflectivity is given in dBZ (dezibel Z).
Z = 10log
z
1mm6m−3
The intensity of precipitation is categorized into 255 classes and provide information about microphysical precipitation processes.
The DWD 3D radar reflectivity products Vertically Integrated Ice (V II) and Vertically
Integrated Liquid water (V IL) in kg m−2 are analyzed over the life cycle of
thunder-storms. V IL is the sum of all radar reflectivities measured in vertical direction from
the surface to the highest radar measurement. V II is calculated from the -10°C line
up to the highest radar measurement. Therefore V II is part of the V IL column. The
integration that is used for the calculation of V II and V IL is described in detail in
Greene and Clark (1972). Rad-TRAM
Beside the volume scan, the precipitation scan is used for the life cycle analyses as a measure of precipitation where the radar elevation angle is “terrain following” (elevation angle dependent on orography) and varies its azimuth angle as usual. An algorithm that uses the precipitation scan to detect, track, and nowcast precipitation cells is “Radar TRacking And Monitoring” (Rad-TRAM, Kober and Tafferner, 2009). In addition, the maximum reflectivity for each precipitation cell is determined by a mean over 30% of the highest reflectivities within the Rad-TRAM contour. Rad-TRAM output of the maximum reflectivity (Rmax) and Area of the 46 dBZ contour (RA46) are used in the
life cycle analyses, if the Rad-TRAM cell overlaps with a Cb-TRAM cell. The RA46 is
chosen to analyze the behavior of the area of very heavy precipitation. Lightning data
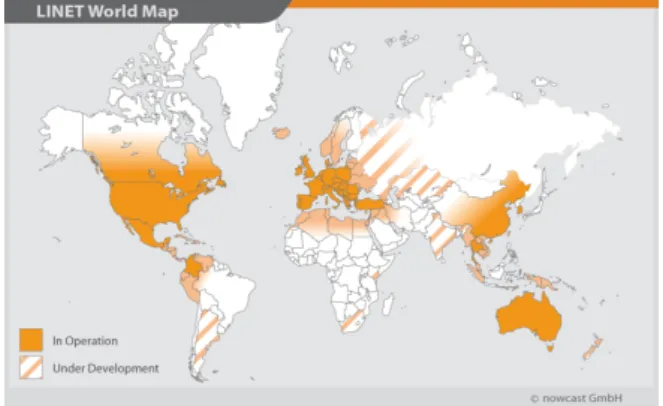
Data of the European ground-based Lightning NETwork (LINET) from “nowcast GmbH” (Betz et al., 2009) with a statistical average accuracy of approximately 150 meters are used in this study. LINET operates over Europe and other parts of the world (see Figure 2.2). With the very low frequency and low frequency (VLF/LF) lightning detection technique it is possible to measure cloud-to-ground (CG) and intra cloud (IC)
2.1 Data sources
lightning. In the life cycle analyses cloud-to-ground (CG) and intra cloud (IC) lightning will be considered. All lightning observations (CG and IC) inside a Cb-TRAM cell are summed up that occur 2.5 min before and 2.5 min after the Cb-TRAM detection. The resulting parameter is called Lightning detection (Li).
Figure 2.2: World wide distribution of LINET measurements (source: https://www. nowcast.de/aktuell/network-expansion.html).
2.1.2 Model data
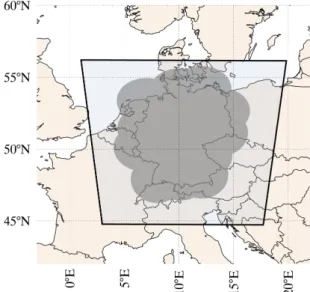
The COnsortium for Small-scale MOdeling (COSMO) was formed in 1998. The model COSMO-DE has been operated since January 2007 at the DWD (Baldauf et al., 2006) and complements the global model “ICON”. The COSMO-DE model has a spatial resolution of 2.8 km x 2.8 km (0.025◦ x 0.025◦). It is separated in 50 model layers
where the lowest is at 0 m and the highest at 22 km altitude above surface. The levels are constant over time. The coverage area comprises Germany, Austria and Switzerland with 421x461 data points (see Figure 2.3, squared area). In May 2018, COSMO-DE was replaced by COSMO-D2 with a higher spatial resolution (2.2 km x 2.2 km) and 65 layers which is used for a part of the period (June of 2018) analyzed in this study (see Chapter 2.2). The update cycle of both COSMO-DE and COSMO-D2 is 3 hours (00, 03, 06, 09, 12, 15, 18, and 21 UTC). Forecasts are output with an interval of 1 hour until 21 hours and then interpolated to a temporal resolution of 5 min. Always the latest available forecast relative to the observation of the thunderstorm is taken for the life cycle analyses. For example, the 2 h forecast of the 06 UTC run is used for a thunderstorm detected at 8 UTC. The model parameters Convective Available Potential Energy (CAP E), Relative Humidity at 700 hPa (RH), and vertical velocity
at 700 hPa (ω) are analyzed over the life cycle of thunderstorms due to their predictive
Figure 2.3: Map of Central Europe with coverage of COSMO-DE data (squared light grey shaded area) and the coverage of the German radar network (dark grey shaded area).
2.2 Data treatment
Table 2.1 summarizes all parameters relevant for this study. The availability of every parameter for every analyzed cell is crucial for the significance of the life cycle analyses. Consequently, the analyzed area is limited to the data source covering the smallest area and additionally overlapping with the other data sources, in this case the radar data. Therefore, every cell is considered in the life cycle analyses, that occurs inside the radar net covering Germany (see Figure 2.3, dark grey shaded area) and fulfills the criterion of a “mature-thunderstorm” detection with Cb-TRAM minimum for one time step during its life cycle. Overall, almost 2000 thunderstorms are considered in the life cycle analyses.
Since thunderstorms over Germany are analyzed and METEOSAT-8 is located 41,5 °E and 36,000 m over the equator, a parallax correction has to be done. The satellite’s large viewing angle from nadir leads to a local shift of clouds relative to the surface. This displacement is called parallax. For this thesis, parameters from different data sources are used to describe and nowcast thunderstorms. All data sources are available with latitude-longitude grid or location information, each with or without parallax correction. Consequently, the parameter allocation has to be done with regard to a possible parallax displacement.
2.2 Data treatment
Table 2.1: All available parameters that are used to describe the life cycle of thunder-storms.
Data source Parameter Abbrev. unit Satellite Brightness Temperature BT K
cloud optical thickness τ
-effective radius re µm
ice fraction at the cloud top phase
-Area inside Acb where τ >0.1 Aτ >0.1 km2
Cb-TRAM Area of the Cb-TRAM cell Acb km2
propagation velocity c m s−1
Radar Vertically Integrated Ice V II kg m−3
Vertically Integrated Liquid water V IL kg m−3
Rad-TRAM Area of the 46 dBZ contour RA46 km2
maximum Reflectivity Rmax dBZ
LINET Lightning detection Li # 5min−1
COSMO-DE Convective Available Potential Energy CAP E J kg−1
Relative Humidity at 700 hPa RH %
vertical velocity at 700 hPa ω Pa s−1
For each thunderstorm, one single value of every of the previously described parameters is calculated for every single lifetime step: The parameterBT as well asτ,re, andphase
are determined by their average over 10% of the pixels with the lowest BT values inside Area of the Cb-TRAM cell (Acb), respectively. The radar parameters V II andV IL
are the mean over 10% of their respective highest values within Acb. The parameter
Rmax represents 30% of the highest reflectivity values inside a Rad-TRAM contour
with a threshold of 19 dBZ and an overlap with Acb. All lightning detection inside Acb
that occur 2.5 min before and 2.5 min after the detection with Cb-TRAM are summed up to calculate the parameter Li. Finally, in order to account for uncertainties of the
model regarding the location of thunderstorms the Cb-TRAM cells are enlarged with a radius of 50 km. For these enlarged Cb-TRAM cellsCAP E and ω are determined by
their average over 10% of the pixels with the highest CAP E and the lowest ω values,
respectively. The parameter RH is an average of the RH values over all pixels within Acb.
Thunderstorms that occur in June 2016, May, June, and July 2017, and June 2018 within the dark grey shaded area (see Figure 2.3) are studied. This period is taken due to reasons of availability. Almost 2000 cells with lifetimes between 5 (one time step) and 300 (60 time steps) min have been detected in these five months and are sorted in lifetime classes with 5 min bins (Figure 2.4). Short-lived cells (< 90 min)
occur relatively seldom (20 thunderstorms per lifetime class). More than the half of all detected thunderstorms have a lifetime class between 90 min and 175 min.
Thunderstorms that exist longer than 300 min occurred very rarely and will not be considered in the life cycle analyzes.
Figure 2.4: Thunderstorms that occurred over Germany in June 2016, May, June, July 2017 and June 2018 sorted by their lifetimes into lifetime classes in [min]. The sum of all thunderstorms with the same lifetime class is depicted for each lifetime class.
This frequency distribution
![Figure 2.4: Thunderstorms that occurred over Germany in June 2016, May, June, July 2017 and June 2018 sorted by their lifetimes into lifetime classes in [min]](https://thumb-us.123doks.com/thumbv2/123dok_us/494576.2558503/36.892.196.662.265.547/figure-thunderstorms-occurred-germany-sorted-lifetimes-lifetime-classes.webp)

