CHARACTERIZATION OF THE VERTICAL STRUCTURE OF LATENT HEATING IN THE EAST PACIFIC ITCZ USING THE TRMM PR AND CLOUDSAT CPR
A Thesis by
LIDIA HUAMAN CHUQUIHUACCHA
Submitted to the Office of Graduate and Professional Studies of Texas A&M University
in partial fulfillment of the requirements for the degree of MASTER OF SCIENCE
Chair of Committee, Courtney Schumacher Committee Members, R. Lee Panetta
Anita Rapp Benjamin Giese
Head of Department, Ramalingam Saravanan
December 2018
ABSTRACT
In the East Pacific intertropical convergence zone (ITCZ), Tropical Rainfall Measur-ing Mission (TRMM) radar-based latent heatMeasur-ing retrievals suggest a top-heavy structure; however, the TRMM precipitation radar (PR) underestimates light precipitation (< 0.4 mm h−1) from shallow convection and the low-level latent heating associated with this precip-itation. Thus, this study uses observations of stratiform and deep convective precipitation from the TRMM PR and shallow precipitation from the more sensitive CloudSat cloud profiling radar (CPR) to assess the seasonal vertical structure of latent heating in the East Pacific ITCZ (130◦W - 90◦W) for 1998-2015. This study is complemented with three re-analysis datasets (MERRA2, ERA-Interim, and NCEP NCAR) to analyze the meridional circulation changes linked to variations in the ITCZ heating profiles.
There is a distinct seasonal cycle in the TRMM/CloudSat latent heating profiles in the East Pacific ITCZ. During DJF, latent heating peaks around 850 hPa because of the pre-dominance of rain from shallow convection. The heating peak rises to 700 hPa during MAM as the contribution from deep convective rain increases along with the presence of a mid-level inflow south the ITCZ. During JJA and SON, stratiform precipitation increases significantly and heating is more equally distributed throughout the troposphere with dou-ble peaks at 700 and 400 hPa; the lower peak is related to the strong shallow overturning circulation. In addition, the East Pacific has a meridional slope in latent heating through-out the year as a result of the prevalence of shallow convection in the sthrough-outhern part of the ITCZ and deep convection in the northern part of the ITCZ. This slope is weakest during MAM when a double ITCZ structure exists. Reanalyses only capture certain aspects of this seasonal cycle in the East Pacific ITCZ. While the reanalyses agree that the most bottom-heavy heating occurs in DJF and the most top-bottom-heavy heating occurs in JJA, they greatly
underestimate the amount of heating aloft compared to the satellite retrievals throughout the year. This disagreement has serious implications for how the meridional circulation is captured in this region with reanalyses showing varying ability in representing the shallow meridional circulation and deeper Hadley cell overturning in the East Pacific.
DEDICATION
To my parents in Peru, for their continuous support and encouragement on my career as a scientist.
ACKNOWLEDGEMENTS
I would like to thank to my advisor Prof. Courtney Schumacher for her support on my research. She has been more than a advisor for me, her continuous encouragement makes me believe and rely in my abilities to do high quality research. Also, I want to thank some Peruvian and American collaborators that taught me computational skills and encouraged me to follow a graduate program in Texas A&M University. Thanks to A. Funk for pre-processing the TRMM PR data product 2A25. Thanks Graeme Stephens and the CloudSat program for his support from JPL and the CloudSat Program.
This thesis is an edited version of: Huaman, L., and Schumacher, C. (2018). Assess-ing the vertical latent heatAssess-ing structure of the East Pacific ITCZ usAssess-ing the CloudSat CPR and TRMM PR. Journal of Climate, 31(7), 2563-2577. An special thanks to Prof. David Raymond from New Mexico Tech and two anonymous reviewers for their helpful sugges-tions that improved this study. Finally, thanks to my committee members for more helpful suggestions in this research.
CONTRIBUTORS AND FUNDING SOURCES
This study was supported by a research fellowship from the CloudSat mission, and sup-ported by Professor Courtney Schumacher of the Department of Atmospheric Sciences. This work was also supervised by a thesis committee consisting of Professors R. Lee Panetta and Anitta Rapp of the Department of Atmospheric Sciences, and Professor Ben-jamin Giese of the Department of Oceanography. Additional support came from NASA Grant NNX16AE34G. The TRMM data was provided by Aaron Funk, CloudSat and re-analyses MERRA2, ERA-Interim, NCEP NCAR were obtained from their websites.
This work was completed by the student independently, and material in this thesis is a slightly edited version of: Huaman, L., and C. Schumacher, 2018: Assessing the vertical latent heating structure of the East Pacific ITCZ using the CloudSat CPR and TRMM PR. Journal of Climate, 31(7), 2563-2577. ©American Meteorological Society. Used with permission.
NOMENCLATURE
AMS American Meteorological Society
CPR Cloud Profiler
CSH Convective Stratiform Heating
DJF December, January, and February
ERA-Interim ECMWF Reanalysis Interim
EPIC Eastern Pacific Investigation of Climate
GCMs Global Climate Models
ITCZ Intertropical Convergence Zone
JJA June, July, and August
LH Latent Heating
MAM March, April, and May
MERRA2 Modern Era Retrospective-Analysis for Research V2 OTREC Organization of Tropical East Pacific Convection
PR Precipitation Radar
PRH Precipitation Radar Heating
Q1 Diabatic Heating
SLH Spectral Latent Heating
SON September, October, and November
SST Sea Surface Temperature
TABLE OF CONTENTS
Page
ABSTRACT . . . ii
DEDICATION . . . iv
ACKNOWLEDGEMENTS . . . v
CONTRIBUTORS AND FUNDING SOURCES . . . vi
NOMENCLATURE . . . vii
TABLE OF CONTENTS . . . viii
LIST OF FIGURES . . . x
LIST OF TABLES . . . xiii
1. INTRODUCTION AND LITERATURE REVIEW . . . 1
1.1 The Intertropical Convergence Zone . . . 1
1.2 Vertical structure of the ITCZ . . . 3
2. DATA AND METHODS . . . 6
2.1 Satellite data. . . 6
2.2 Reanalyses. . . 10
2.3 Other data . . . 11
3. RESULTS . . . 12
3.1 CloudSat CPR and TRMM PR Satellites . . . 12
3.1.1 Surface precipitation . . . 12
3.1.2 Echo-tops heights . . . 14
3.1.3 New total precipitation. . . 18
3.2 Latent heating estimates . . . 18
3.2.1 Latent heating from TRMM PR and CloudSat CPR . . . 18
3.2.2 Latent heating from TRMM-only algorithms. . . 21
3.2.3 Diabatic heating from reanalyses. . . 22
3.3.1 Meridional Overturning Circulation . . . 23
3.3.2 Precipitation from reanalyses . . . 27
4. SUMMARY AND CONCLUSIONS . . . 30
4.1 Challenges . . . 32
4.2 Further Study . . . 33
LIST OF FIGURES
FIGURE Page
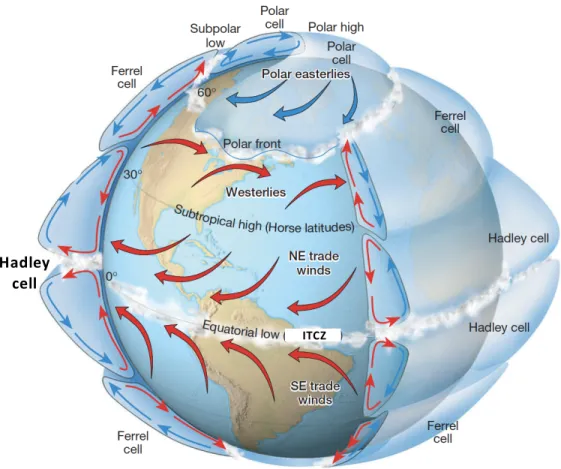
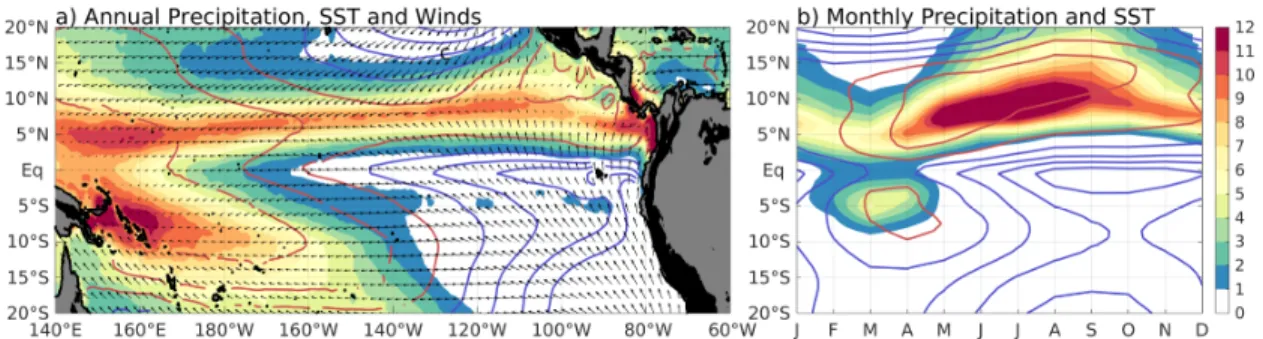
1.1 Idealized global circulation for the three-cell circulation (including Hadley cell) model on a rotating Earth. Reprinted from Lutgens and Tarbuck (2013) 2 1.2 a) Annual mean precipitation from the TRMM PR (1998-2014) in mm d−1
(shaded), sea surface temperature from the OI SST Product (<27◦C in blue and>27◦C in red with contours every 1◦C), and surface winds from ERA-Interim; and b) TRMM PR climatology of monthly precipitation (shaded) and OI SST (contours) from 130◦W to 90◦W. The largest vector wind is around 8 m s−1 . . . 3 1.3 a) Sketch of the meridional circulation along the East Pacific during boreal
fall. The ITCZ located at 8◦N has peaks of vertical velocity at 2 km and 7 km. The maximum vertical velocity at low levels is related with the shal-low circulation showed in red arrows, while the maximum vertical velocity at high levels is associated with deep circulation showed in black arrows. The mid-level inflow suggested by simulations is shown in purple. . . 4 1.4 a) Mean precipitation (mm d−1) from TRMM 3B42 and b) omega in the
northern ITCZ along 95◦W during the EPIC campaign (September-October 2001). Data is from TRMM 2A25 (with standard error, black solid), EPIC dropsondes (black dotted, standard error in grey shading), NCEP/NCAR (purple dashed) and ERA Interim (blue dashed) reanalysis, and the SLH, PRH, CSH and CSH retrievals (red, grey, yellow and green dashed, re-spectively). Adapted from Huaman and Takahashi (2016). . . 5 2.1 Sketch of the precipitation mechanisms in a mesoscale convective
sys-tem including stratiform, convective, and shallow regions. Reprinted from Houze (1989). . . 7 2.2 Idealized latent heating profiles for deep convective, stratiform, and
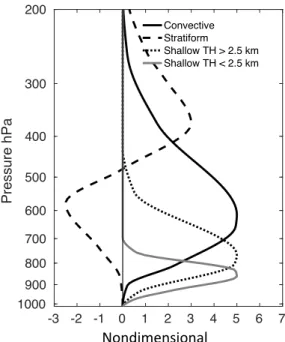
shal-low precipitation with echo-top heights higher/shal-lower than 2.5 km. The x axis is meant to be non-dimensional until a precipitation amount is specified. 9
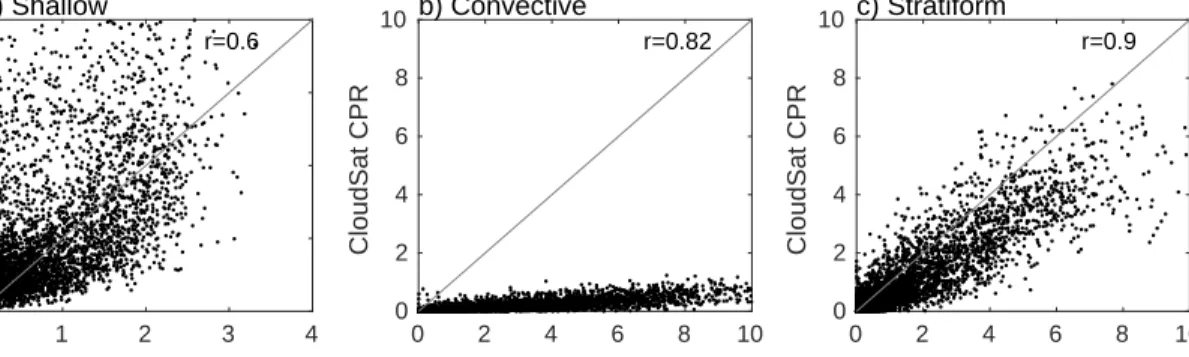
3.1 Mean monthly precipitation from 130◦W to 90◦W from the TRMM PR (left column) and CloudSat CPR (right column) in mm d−1for total (a,b), shallow (c,d), deep convective (e,f), and stratiform (g,h) precipitation. The color scale differs with the type of precipitation. . . 13 3.2 Scatter plots of a) shallow, b) deep convective and c) stratiform
precipi-tation in mm d−1 for the TRMM PR compared to the CloudSat CPR for monthly values over 0.5◦grids between 10◦S-15◦N and 130◦W-90◦W. . . 14 3.3 Composite echo-top height distributions for 1◦x 1◦ cells for deep
convec-tive (red), stratiform (blue) and shallow (black) precipitation in the east Pacific ITCZ (130◦W-90◦W, >3 mm d−1) from the a) TRMM PR and b) CloudSat CPR during DJF (solid), MAM (dashed), JJA (dash-dot) and SON (dotted). Thexaxes differs because of the different horizontal reso-lution and swath width of the TRMM PR and CloudSat CPR. . . 15 3.4 Monthly climatology from 130◦W to 90◦W of a) total precipitation from
the CloudSat CPR and TRMM PR, and percentage of b) deep convec-tive precipitation, c) stratiform precipitation, d) shallow precipitation with echo-top heights above 2.5 km and e) shallow precipitation with echo-top heights under 2.5 km. Solid black line indicates 3 mm d−1.. . . . 17 3.5 a-d) Mean latitude-pressure of latent heating for 130◦W-90◦W from the
Cloudsat CPR and TRMM PR in K d−1. The maximum heating position at each level is indicated by gray points. e-h) Latent heating profiles in the ITCZ (>3 mm d−1) derived from TRMM/CloudSat (black) and TRMM PR-based retrievals: CSH (green), SLH (blue), and PRH (red); i-l) dia-batic heating profiles in K d−1 and m-p) omega profiles in Pa s−1 in the East Pacific ITCZ from MERRA2 (black dashed), ERA-Interim (fuchsia dashed), and NCEP-NCAR (green dashed) for DJF (left column), MAM (middle left column), JJA (middle right column), and SON (right column). 20
3.6 a-l) Mean meridional vertical mass flux in kg m−2 s−1(vectors) and verti-cal velocity in Pa s−1 (shaded) over 130◦W-90◦W from MERRA2, ERA-Interim and NCEP/NCAR for DJF (left column), MAM (middle left col-umn), JJA (middle right colcol-umn), and SON (right column). The maximum heating position at each level is indicated by gray points. The fluxρw has been amplified 100 times to account for the aspect ratio of the plot. The largest flux vector is around 5 kg m−2s−1. m-p) Vertical profiles of merid-ional wind over 130◦W-90◦W and 5◦south of the ITCZ (e. g., during DJF, the southern edge of the ITCZ is at 5◦N and the vertical profile of merid-ional wind corresponds to the average between the equator and 5◦N) from MERRA2 (black), ERA-Interim (black), and NCEP NCAR (green). . . 24 3.7 Meridional wind climatology in m s−1(1998-2014) in shaded and vectors
from (a) radiosondes at 0.4◦S, 89.6◦W and (b) MERRA2, (c) ERA-Interim, and (c) NCEP NCAR at Eq, 90◦W. Negative shading and arrows pointing left indicate northerlies, positive shading and arrows pointing right indicate southerlies. . . 27 3.8 Monthly climatology over 130◦W-90◦W of precipitation (top) and
differ-ences (bottom) in mm d−1against TRMM/CloudSat from MERRA2 (left), ERA-Interim (middle), and NCEP/NCAR (right). Solid black line indi-cates rainfall 3 mm d−1from TRMM/CloudSat. . . 28 4.1 Sketch of the meridional circulation along the East Pacific during a) DJF,
b) MAM, c) JJA, and d) SON. Cold and Warm labels at surface suggest SST below and above 26◦C, respectively. . . 32
LIST OF TABLES
TABLE Page
1. INTRODUCTION AND LITERATURE REVIEW
1.1 The Intertropical Convergence Zone
The intertropical convergence zone (ITCZ) is defined as the dividing line between the southeast and northeast trade winds and corresponds to the ascending branch of the Hadley Cell (Fig. 1.1). The trade winds converge over warm tropical waters and deep convective systems with heavy precipitation are produced over the ITCZ, resulting in a large amount of latent heat release (Philander et al. 1996) (Fig. 1.2a).
The ITCZ follows the seasonal migration of the sun in the zonal-mean sense; however, in East Pacific, the ITCZ mostly resides in the Northern Hemisphere (Xie and Philander 1994), due to the interaction of the warm pool in the northeast Pacific and the cold tongue west of the South American coast and the Andes Mountains (Takahashi and Battisti 2007a) (Fig. 1.2a). The seasonal cycle of the East Pacific ITCZ exhibits a single intense ITCZ located around 8◦N during summer and fall, and a double ITCZ symmetric about the equa-tor during spring (Fig. 1.2b). Important features of the ITCZ are the warm water off the equator and trade wind surface convergence that transports moisture into the ITCZ at low levels. This low-level convergence is in part induced by the strong meridional surface pressure gradient maintained by the equatorial cold tongue, especially during boreal sum-mer and fall when the sum-meridional pressure gradient is strong (Lindzen and Nigam 1987). The double ITCZ appears when the cold tongue is weak and the meridional sea surface temperature (SST) gradient that would induce the surface pressure gradient is muted. This suggests that convection in the double ITCZ during spring is not dominated by low-level convergence, but by the expression of surface thermal conditions (Back and Bretherton 2009).
do not reliably characterize the ITCZ in this region (Lin 2007, Zhang et al. 2015). The bi-ases may originate from interactions between precipitation and the large-scale circulation (Bellucci et al. 2010, Oueslati and Bellon 2015), and therefore more studies are neces-sary to improve our knowledge of the large-scale circulation in the East Pacific, especially associated with the vertical structure of latent heating from convection.
ITCZ Hadley
cell
Figure 1.1: Idealized global circulation for the three-cell circulation (including Hadley cell) model on a rotating Earth. Reprinted from Lutgens and Tarbuck (2013)
Figure 1.2: a) Annual mean precipitation from the TRMM PR (1998-2014) in mm d−1(shaded), sea
surface temperature from the OI SST Product (<27◦C in blue and>27◦C in red with contours every
1◦C), and surface winds from ERA-Interim; and b) TRMM PR climatology of monthly precipitation
(shaded) and OI SST (contours) from 130◦W to 90◦W. The largest vector wind is around 8 m s−1
1.2 Vertical structure of the ITCZ
Our knowledge of the vertical structure of the ITCZ and its associated circulation is limited, particularly with respect to the vertical structure of latent heating in the ITCZs in the East Pacific where in situ observation are scarce. Huaman and Takahashi (2016) documented discrepancies between satellite, in situ observations, and reanalysis fields in the East Pacific ITCZ. Tropical Rainfall Measuring Mission (TRMM) radar-based heating retrievals indicate a top-heavy profile in the Northern Hemisphere ITCZ (Schumacher et al. 2004) (Fig. 1.3, black arrows), while in situ observations during the First Global Atmo-spheric Research Program Global Experiment and Eastern Pacific Investigation of Climate campaign (EPIC) support the existence of a shallow meridional overturning circulation in this region (e.g., Yin and Albrecht 2000, Raymond et al. 2004, Zhang et al. 2004, 2008; Nolan et al. 2007) (Fig. 1.3, red arrows). Atmospheric reanalysis data indicate a predom-inantly bottom-heavy profile, with shallow maximum ascent (Back and Bretherton 2006, 2009; Handlos and Back 2014), while simulations from a regional model show a mid-level inflow around 400-300 hPa (Nolan et al. 2010) (Fig. 1.3, purple arrows). Reanalysis data, however, do not completely reproduce the observed characteristics in the ITCZ
re-Dry Region
20°S ITCZ8°N
DEEP CIRCULATION
SHALLOW CIRCULATION
Figure 1.3: a) Sketch of the meridional circulation along the East Pacific during boreal fall. The
ITCZ located at 8◦N has peaks of vertical velocity at 2 km and 7 km. The maximum vertical velocity
at low levels is related with the shallow circulation showed in red arrows, while the maximum vertical velocity at high levels is associated with deep circulation showed in black arrows. The mid-level inflow suggested by simulations is shown in purple.
gion (Hastenrath 2002), and TRMM-based retrieval algorithms use vertical structures from cloud models and look-up tables (Tao et al. 2006, 2010; Shige et al. 2004, 2007; Kodama et al. 2009) that may not be representative of East Pacific ITCZ conditions.
Fig. 1.4a shows the mean surface precipitation from TRMM 3B42 during the EPIC campaign in September and October 2001 (Raymond et al. 2004). The vertical struc-ture of omega during EPIC from reanalyses, TRMM algorithms, and EPIC measurements is shown in Fig. 1.4b. Both reanalyses agree with EPIC omega estimate up to 900 hPa (NCEP NCAR up to 750 hPa), indicating an adequate representation of the near-surface horizontal convergence (not shown). However, they both exaggerate the extent of the hor-izontal divergence to at least 600 hPa (750 hPa in EPIC and TRMM PR), indicating that surface flow alone might not be a strong constraint on low-level circulation (cf. Handlos and Back 2014).
a)
b)
mm/d
Figure 1.4: a) Mean precipitation (mm d−1) from TRMM 3B42 and b) omega in the northern ITCZ
along 95◦W during the EPIC campaign (September-October 2001). Data is from TRMM 2A25
(with standard error, black solid), EPIC dropsondes (black dotted, standard error in grey shading), NCEP/NCAR (purple dashed) and ERA Interim (blue dashed) reanalysis, and the SLH, PRH, CSH and CSH retrievals (red, grey, yellow and green dashed, respectively). Adapted from Huaman and Takahashi (2016).
in the East Pacific and its seasonality. This study assesses the vertical latent heating struc-ture in the East Pacific ITCZ using satellite radar precipitation datasets from CloudSat and TRMM. It also assesses the vertical structure of the East Pacific ITCZ meridional circula-tion based on reanalyses. The bulk of this thesis work has been published in Huaman and Schumacher (2018). Section 2 explains the data and methodology. Section 3 describes the results including the CloudSat CPR and TRMM PR comparison, a simple latent heating retrieval in the East Pacific, and the vertical motion from reanalyses, followed by summary and conclusions in section 4.
2. DATA AND METHODS
2.1 Satellite data
Data from two satellite radars operated by NASA were used in this study: the TRMM PR for the period 1998–2014 and the CloudSat CPR for the period 2006–16. The TRMM PR was a single wavelength (Ku-band) radar that operated at 13.8 GHz. Its minimum
de-tectable reflectivity was 17 (18) dBZ and it had a swath width of 215 (240) km before (after) 2001 when the satellite was boosted from 350 to 402.5km in order to conserve fuel. This study uses V7 of TRMM product 2A25 (Kummerow et al. 1998; Iguchi et al. 2000), which provides vertical profiles of attenuation corrected reflectivity and estimated precip-itation between 0.25 and 20 km altitude with a horizontal resolution of 5 km at nadir (4.3 km pre boost) and a resolution of 0.25 km in height. TRMM product 2A23 (Awaka et al. 1997) provides the rain type classification (convective, stratiform, shallow, and other) and echo-top height. Funk et al. (2013) describe V7 updates to the 2A23 algorithm, including characterization of the shallow isolated and shallow non-isolated categories.
In this study, the surface precipitation is categorized as convective, stratiform, and shallow. The convective classification refers to regions of deep active convection, where strong vertical air motions dominate and precipitation particles increase in mass by coales-cence and/or riming. The stratiform classification represents regions of aged convection, where weaker vertical motions dominate and precipitation particles increase in mass by va-por deposition (Houze 1989) (Fig. 2.1). The TRMM 2A23 rain type algorithm determines whether a pixel is convective or stratiform by examining the horizontal variability of the echo (Steiner et al. 1995) and the vertical profile of reflectivity. The shallow classification refers to echo tops lower than the climatological 0◦C level (Kodama et al. 2009).
Stratiform Convective
Shallow
Figure 2.1: Sketch of the precipitation mechanisms in a mesoscale convective system including stratiform, convective, and shallow regions. Reprinted from Houze (1989).
94GHz (Stephens et al. 2002). It has a minimum sensitivity of -31 dBZ, a swath width of 1.4 km, and an along-track footprint of 2.5 km (Haynes and Stephens 2007). The CPR provides important measurements of light to moderate precipitation due to the high sen-sitivity of the W-band radar. This study uses the product 2C-PRECIPCOLUMN (Haynes et al. 2009), which provide precipitation rates and classification of stratiform, convective, and shallow rain as well as echo-top heights (i.e., the top of the lowest and highest signif-icant cloud layer). This study used the lowest signifsignif-icant cloud layer in order to focus on shallow cloud characteristics.
CloudSat CPR and TRMM PR observations are interpolated to a 0.5◦grid and monthly averages of stratiform, convective, and shallow precipitation are calculated for each satel-lite dataset. Because of the limited sampling of the nadir-pointing CPR, this study averaged each precipitation field over the East Pacific region between 130◦ and 90◦W. This region excludes any precipitation from the South Pacific convergence zone but includes the lon-gitudes where the double ITCZ is observed from February to April (Fig. 1.2b). This study
calculates a new total precipitation that corresponds to the sum of convective and strati-form precipitation from the TRMM PR and shallow precipitation from the CloudSat CPR (section 3).
Latent heating profiles differ substantially between areas of stratiform, deep convec-tive, and shallow precipitation (Houze 1982). The latent heating look-up table used in this study (Fig. 2.2) was inspired by Schumacher et al. (2004, 2007); however, some modifica-tions based on recent studies were implemented. Similar to Schumacher et al. (2004), the heating profile associated with deep convective rain (Fig. 2.2, solid black line) is positive throughout the troposphere peaking near 4 km (600 hPa), while the stratiform profile (Fig. 2.2, dashed line) is dominated by heating above the climatological 0◦C level (5 km or 500 hPa) and cooling below this level. The heating peak in the stratiform profile is at 8 km (350 hPa), and the cooling has been modified to peak at 4.5 km (570 hPa) because of the strong cooling from melting near 0◦C (Ahmed et al. 2016). Nelson et al. (2016) estimated latent heating profiles for warm precipitation associated with shallow clouds, suggesting positive latent heating throughout the tropospheric extent of the cloud. However, echo-top heights of shallow precipitation vary from 900 hPa up to 500 hPa throughout the year, so two ide-alized profiles were implemented for the shallow precipitation heating: one for echo-top heights located above 750 hPa (Fig. 2.2, dotted black line), similar to Schumacher et al. (2004), and one for echo-top heights located below 750 hPa (Fig. 2.2, solid gray line). This modification adds more height sensitivity to the latent heating profiles and recog-nizes the shallower precipitating convection observable by CloudSat, but does not unduly complicate the lookup table.
To obtain the latent heating profile within each 0.5◦grid box, the idealized latent heat-ing profiles associated with stratiform, convective and shallow precipitation in Fig. 2.2 are linearly combined based on the TRMM/CloudSat precipitation fraction for each rain
-3 -2 -1 0 1 2 3 4 5 6 7 Nodimensional 200 300 400 500 600 700 800 900 1000 Pressure hPa Convective Stratiform Shallow TH > 2.5 km Shallow TH < 2.5 km Nondimensional
Figure 2.2: Idealized latent heating profiles for deep convective, stratiform, and shallow precipi-tation with echo-top heights higher/lower than 2.5 km. The x axis is meant to be non-dimensional until a precipitation amount is specified.
TRMM/CloudSat precipitation at each location (Schumacher et al. 2004):
LHz =
P ×lhz×Lv×g
Cp×∆p
(2.1) whereLHz is the latent heating at heightz,P is the total precipitation,lhzis the latent
heating normalized at heightz,Lv is the latent heat of condensation,gis the gravitational
acceleration,Cpis the specific heat of air at constant pressure, and∆pis the layer depth and
is constant. Thus, the vertical latent heating structure can be estimated for any subset of the TRMM/CloudSat observational period. To minimize sampling errors, this study used monthly to seasonal averages to represent the latitude-pressure latent heating structure in the East Pacific.
products from the Convective Stratiform Heating (CSH) (Tao et al. 2006, 2010), Spectral Latent Heating (SLH) (Shige et al. 2004, 2007), and PR Heating (PRH) (Kodama et al. 2009) algorithms. These algorithms use TRMM PR rain type observations. However, the CSH and SLH estimate latent heating profiles using lookup tables based on simulations of cloud-resolving models, while the PRH algorithm is a retrieval method to evaluate the latent heating profile from the profile of radar reflectivity. Regardless of the lookup ta-ble/method used, it is important to note that latent heating retrievals from radar reflectivity profiles are highly derived and might not capture all the variability in heating profiles that occur in the spectrum of convective and stratiform cloud types across the tropics.
2.2 Reanalyses
The total diabatic heating associated with precipitation systems can be separated into three components: latent heating and cooling associated with condensation and evapora-tion, radiative heating and cooling from solar and infrared absorption and emission within the cloud deck, and the vertical convergence of sensible heat flux associated with cloud-scale updrafts and downdrafts (Yanai et al. 1973). In rainy regions, the latent heating is the dominant component in the total diabatic heating (Houze 1982), thus this study compared the vertical structure of diabatic heating associated with precipitation from three reanalyses with the satellite latent heating retrievals. The three reanalyses are described in Table 2.1 and include the NASA MERRA V2 reanalysis (Bosilovish et al. 2015), the European
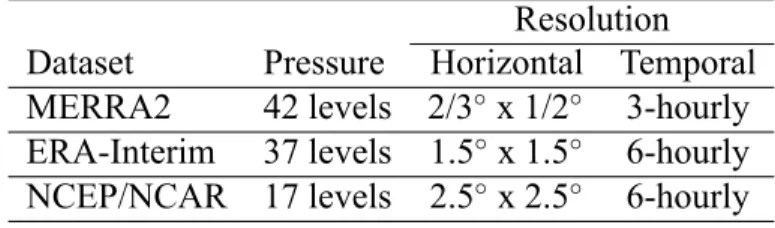
Cen-Table 2.1: Reanalyses data sets used in this study
Resolution Dataset Pressure Horizontal Temporal MERRA2 42 levels 2/3◦x 1/2◦ 3-hourly ERA-Interim 37 levels 1.5◦ x 1.5◦ 6-hourly NCEP/NCAR 17 levels 2.5◦ x 2.5◦ 6-hourly
tre for Medium-Range Weather Forecast (ECMWF) Interim reanalysis (Dee et al. 2011), and the National Center for Environmental Prediction-National Center for Atmospheric Research (NCEP NCAR) reanalysis (Kalnay et al. 1996).
The diabatic heating (Q1) from reanalysis is calculated as the residual of the thermo-dynamics equation on pressure surfaces (Nigam et al. 2000; Hagos et al. 2010):
Q1 = CpT θ (∂θ ∂t +u ∂θ ∂x +v ∂θ ∂y +ω ∂θ ∂p ) (2.2) whereuandvare the zonal and meridional wind components;ωis the vertical pressure velocity;θ =T(ps/p)R/Cp is the potential temperature, withT being the temperature;pis
the pressure andpsthe surface pressure;Cp is the specific heat capacity of air at constant
pressure. Q1 is calculated using central finite differencing at the horizontal grids at the available pressure levels (Table 2.1). ∂θ/∂tis neglected for monthly averages.
This study compares LH andQ1 in the East Pacific ITCZ. TheQ1 profiles correspond to regions with precipitation greater than 3 mm d−1; this condition eliminates the effects of diabatic heating in grid points where precipitation is absent (i.e., where sensible heat fluxes and radiative cooling dominate). Additionally, this study assesses the surface precipitation from reanalyses to see if the seasonal variations between the reanalysis vertical velocity might be related to the diagnosed precipitation since it is well known that large-scale ver-tical motion is related to surface precipitation (e.g., Martin and Schumacher 2012).
2.3 Other data
We also used monthly meridional winds from radiosonde data in the Galapagos Islands (0.43◦S 89.60◦W, 6 meters above sea level) for 1998 to 2014, as well as monthly sea sur-face temperatures (SST) from the optimally interpolated (OI) SST product created from microwave data (Reynold and Smith 1994).
3. RESULTS
3.1 CloudSat CPR and TRMM PR Satellites 3.1.1 Surface precipitation
Figure 3.1 shows the seasonal rainfall in the East Pacific ITCZ separated by rain type for the TRMM PR (left column) and CloudSat CPR (right column). The total precipitation from the CPR is weaker compared to the PR because of the CPR’s attenuation (cf. Figs. 3.1a and b); however, both satellites agree on the seasonal variability and latitudinal struc-ture of the East Pacific ITCZ. From February to March, a double ITCZ is observed, and during June, July, and August (JJA) and September, October, and November (SON), the ITCZ is stronger and further north.
The W-band radar installed on CloudSat is highly sensitive and detects more light pre-cipitation associated with shallow convection compared to the TRMM PR (cf. Figs. 3.1c and d; see also Fig. 3.2a), especially during December, January and February (DJF) when the shallow precipitation average is around 3 mm d−1 (Fig. 3.1d). The lowest Cloud-Sat shallow precipitation values occur during March, April, and May (MAM) with values around 1 mm d−1. This strong seasonal distribution from the CPR is inconsistent with the PR, which shows shallow precipitation values around 1-2 mm d−1throughout the year (Fig. 3.1c). During March and April, CloudSat shallow precipitation is actually lower than TRMM shallow precipitation because some of the precipitation is categorized as deep convective or stratiform in CloudSat and shallow in TRMM. The classification of precipi-tation is based on the cloud top for CloudSat because the CPR has sensitivity to small cloud particles while it is based on the precipitation top for TRMM.
Figure 3.1: Mean monthly precipitation from 130◦W to 90◦W from the TRMM PR (left column)
and CloudSat CPR (right column) in mm d−1 for total (a,b), shallow (c,d), deep convective (e,f),
0 1 2 3 4 TRMM PR 0 1 2 3 4 CloudSat CPR a) Shallow r=0.6 0 2 4 6 8 10 TRMM PR 0 2 4 6 8 10 CloudSat CPR c) Stratiform r=0.9 0 2 4 6 8 10 TRMM PR 0 2 4 6 8 10 CloudSat CPR b) Convective r=0.82
Figure 3.2: Scatter plots of a) shallow, b) deep convective and c) stratiform precipitation in mm
d−1for the TRMM PR compared to the CloudSat CPR for monthly values over 0.5◦grids between
10◦S-15◦N and 130◦W-90◦W.
estimated by the CPR compared to TRMM (cf. Figs. 3.1e and f; see also Fig. 3.2b). The stratiform precipitation is largely seen by the CPR, but it is somewhat affected by attenua-tion especially with precipitaattenua-tion amounts higher than 4 mm d−1(cf. Figs. 3.1g and h; see also Fig. 3.2c).
3.1.2 Echo-tops heights
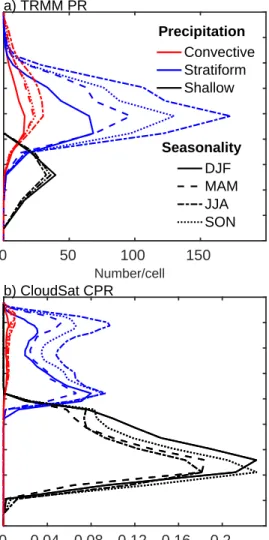
Figure 3.3 explores the variation in echo tops for each rain type and for each radar by season. The PR shows that the convective and stratiform precipitation is associated with deep clouds with echo-top heights between 650 and 300 hPa (Fig. 3.3a). Convective precipitation events are more intense but less horizontally extensive than stratiform pre-cipitation events. Thus small convective areal coverage can result in as much prepre-cipitation as large stratiform areal coverage. Figure 3.3a also shows that there is twice as much areal coverage of the convective and stratiform rain in JJA and SON compared to DJF when convectively coupled equatorial waves (CCEWs) and easterly waves with deep convec-tive and stratiform precipitation predominate in this region (Serra et al. 2008; Kiladis et al. 2009; Yokoyama and Takayabu 2012). The PR-observed echo-top heights for shallow precipitation are between 900 and 600 hPa with the most heights near 2.5 km (750 hPa).
There is also very little seasonal variation in shallow areal coverage observed by the PR. 0 50 100 150 Number/cell 100 200 300 400 500 600 700 800 900 1000 Pressure hPa a) TRMM PR Convective Stratiform Shallow Precipitation 0 0.04 0.08 0.12 0.16 0.2 Number/cell 100 200 300 400 500 600 700 800 900 1000 Pressure hPa b) CloudSat CPR DJF MAM JJA SON Seasonality
Figure 3.3: Composite echo-top height distributions for 1◦ x 1◦ cells for deep convective (red),
stratiform (blue) and shallow (black) precipitation in the east Pacific ITCZ (130◦W-90◦W,>3 mm
d−1) from the a) TRMM PR and b) CloudSat CPR during DJF (solid), MAM (dashed), JJA
(dash-dot) and SON (dotted). Thexaxes differs because of the different horizontal resolution and swath
width of the TRMM PR and CloudSat CPR.
The echo-top heights from CloudSat correspond to the lowest significant cloud layer in a fine swath track associated with the surface precipitation. Figure 3.3b shows that the CPR
echo-top heights for stratiform and convective precipitation have a peak around 200 hPa, which is higher than the PR due to the higher sensitivity of the CPR (i.e., the CPR senses the cloud top while the PR senses the precipitation top) (Li and Schumacher 2011), but the CPR stratiform and convective echo-top counts have a similar seasonal variability as the PR. It is interesting to note another CPR-observed stratiform echo-top peak at 500 hPa, very close to the 0◦C climatological level. This study analyzed samples of these profiles and they appear to have very little ice mass above a diagnosed bright band. The rapid decay of reflectivity above the 0◦C level appears more representative of decaying congestus clouds and these profiles should be considered convective rather than stratiform precipitation. This study only utilizes the shallow precipitation from the CPR in the total rain and latent heating calculations; however, it would be important to review the convective/stratiform categorization from the CloudSat CPR in future studies.
The shallow CPR echo-top heights in Fig. 3.3b are mainly between 900 and 500 hPa with the highest occurrence from 2-2.5 km (800-750 hPa). There is slightly more areal coverage by shallow precipitation during SON and DJF compared to the other seasons. Importantly, shallow convection with echo-top heights under 2.5 km provides as much rain as shallow convection with echo-top heights above 2.5 km throughout the year (not shown), which has implications for how the shallow latent heating is distributed with height and why two shallow profiles were included in the look-up table in Fig. 2.2. It is worth noting that shallow precipitation coverage is larger for the CPR compared to PR, which shows larger coverage of the convective and stratiform precipitation instead. This differ-ence is due to the higher sensitivity of the CPR, which detects more shallow precipitating clouds. However, shallow precipitation rates are less intense than the stratiform and deep convective precipitation rates (Fig. 3.2), so the much greater coverage only marginally adds to the total rainfall.
6 6 6 6 9 9 12 9 12 15 a) Total precipitation CPR-PR
Jan Feb Mar Apr May Jun Jul Aug Sep Oct Nov Dec
10°S 5°S Eq 5°N 10°N 15°N 20°N b) Convective
Jan Feb Mar Apr May Jun Jul Aug Sep Oct Nov Dec
10°S 5°S Eq 5°N 10°N 15°N 20°N c) Stratiform
Jan Feb Mar Apr May Jun Jul Aug Sep Oct Nov Dec
10°S 5°S Eq 5°N 10°N 15°N 20°N
d) Shallow top height >2.5 km
Jan Feb Mar Apr May Jun Jul Aug Sep Oct Nov Dec
10°S 5°S Eq 5°N 10°N 15°N 20°N
e) Shallow top height <2.5 km
Jan Feb Mar Apr May Jun Jul Aug Sep Oct Nov Dec
10°S 5°S Eq 5°N 10°N 15°N 20°N 0% 10% 20% 30% 40% 50% 60% 70%
Figure 3.4: Monthly climatology from 130◦W to 90◦W of a) total precipitation from the CloudSat
CPR and TRMM PR, and percentage of b) deep convective precipitation, c) stratiform precipitation, d) shallow precipitation with top heights above 2.5 km and e) shallow precipitation with
3.1.3 New total precipitation
The new total rainfall is defined as the sum of shallow precipitation from the CPR and the deep convective and stratiform precipitation from the PR (Fig. 3.4a). The total precipitation in the ITCZ is largely dominated by deep convective precipitation throughout the year with more than 50% on the northern side of the ITCZ (Fig. 3.4b). The second dominant regime is the stratiform precipitation with 40% in JJA and SON and around 20% the rest of the year (Fig. 3.4c). These stratiform percentages are lower than the TRMM PR climatology in Schumacher and Houze (2003) but are more consistent with an updated climatology in Funk et al. (2013) that places all shallow rain (both isolated and non-isolated) in the convective category. Figures 3.4d and e show that the shallow precipitation contribution can vary from 10% in MAM and JJA to 25% in DJF in the East Pacific ITCZ. Shallow precipitation with echo-top heights below 2.5 km is predominant south of the ITCZ (Fig. 3.4e), where there is a dry zone with strong subsidence (Takahashi and Battisti 2007b). Within the ITCZ, the shallow precipitation prevails on the southern edge, around 5◦N, while the deep convective precipitation predominates in the northern portion. This south-north gradient in shallow and deep convective precipitation drives a slope in the ITCZ vertical heating and is discussed in the following section.
3.2 Latent heating estimates
3.2.1 Latent heating from TRMM PR and CloudSat CPR
The seasonal latent heating retrievals from the CloudSat CPR and TRMM PR are shown in Figs. 3.5a-d. During DJF (Fig. 3.5a), the ITCZ heating observed at 800 hPa (5◦N) is twice the heating observed at 500 hPa (8◦N), indicating a bottom-heavy structure. During MAM (Fig. 3.5b), a double ITCZ is present. Both ITCZs have a slightly bottom-heavy structure. The latent heating in the southern branch of the ITCZ (5◦S) peaks at 800 hPa and
is commonly observed during February to May, but is more intense in March (Fig. 1.2b). The latent heating in the northern branch of the ITCZ (5◦N) peaks around 700 hPa, deeper than in DJF because of a stronger contribution from deep convective precipitation. During JJA (Fig. 3.5c), the ITCZ is further north (9◦N) and shows strong heating throughout the troposphere with a minimum around 600 hPa because of the cooling associated with stratiform precipitation, consistent with the horizontal divergence between 600 and 500 hPa found by Nolan et al. (2010) and Huaman and Takahashi (2016). This vertical structure is similarly observed in SON but with less intensity (Fig. 3.5d).
It is interesting to note that the ITCZ heating has a meridional slope as a result of the predominance of shallow precipitation in the southern part of the ITCZ and deep convection in the northern part of the ITCZ (Figs. 3.5a-d, gray points). Lindzen and Nigam (1987) argued that low-level moisture convergence driven by the meridional gradient of surface pressure maintained by the equatorial cold tongue dictates the precipitation distribution in the East Pacific ITCZ. More recently, Back and Bretherton (2009) suggested that this low-level convergence preferentially produces only shallow convection and that deeper convection occurs over regions of warmer SST where conditional instability plays a greater role. Based on these results, it appears that the low-level convergence in the southern edge of the ITCZ produces shallow convection and low-level heating and that the convection deepens and heating becomes more top heavy in the center of the ITCZ where SSTs are warmer and thermodynamic effects become more important. In addition, a stable cap layer (i.e., where the radiative cooling is likely dominant) (Nishant et al. 2016) associated with the descending motion of the Walker circulation in the East Pacific displaces the deep convection further north. This meridional ITCZ slope, resulting from the prevalence of shallow (deep) convection in the southern (northern) part of the ITCZ, is strongest during DJF when the Pacific Walker circulation is stronger (Trenberth et al. 2000) and low-level convergence is most pronounced, and weakest during MAM when a double ITCZ is present
1 1 2 3 a) DJF PR-CPR 10°S Eq 10°N 20°N 200 400 600 800 1000 Pressure hPa 0 1 2 3 4 5 K/day 200 400 600 800 1000 Pressure hPa e) DJF LH PR-CPR CSH SLH PRH 0 1 2 3 4 5 K/day 200 400 600 800 1000 Pressure hPa i) DJF Q1 MERRA2 ERA Int. NCEP -0.06 -0.04 -0.02 0 Pa/s 200 400 600 800 1000 Pressure hPa m) DJF Omega 1 1 1 2 3 4 b) MAM PR-CPR 10°S Eq 10°N 20°N 200 400 600 800 1000 0 1 2 3 4 5 K/day 200 400 600 800 1000 f) MAM LH 0 1 2 3 4 5 K/day 200 400 600 800 1000 j) MAM Q1 -0.06 -0.04 -0.02 0 Pa/s 200 400 600 800 1000 n) MAM Omega 1 2 2 3 4 5 5 6 6 c) JJA PR-CPR 10°S Eq 10°N 20°N 200 400 600 800 1000 0 1 2 3 4 5 K/day 200 400 600 800 1000 g) JJA LH 0 1 2 3 4 5 K/day 200 400 600 800 1000 k) JJA Q1 -0.06 -0.04 -0.02 0 Pa/s 200 400 600 800 1000 o) JJA Omega 1 2 2 3 4 4 d) SON PR-CPR 10°S Eq 10°N 20°N 200 400 600 800 1000 0 1 2 3 4 5 K/day 200 400 600 800 1000 h) SON LH 0 1 2 3 4 5 K/day 200 400 600 800 1000 l) SON Q1 -0.06 -0.04 -0.02 0 Pa/s 200 400 600 800 1000 p) SON Omega
Figure 3.5: a-d) Mean latitude-pressure of latent heating for 130◦W-90◦W from the Cloudsat CPR
and TRMM PR in K d−1. The maximum heating position at each level is indicated by gray points.
e-h) Latent heating profiles in the ITCZ (>3 mm d−1) derived from TRMM/CloudSat (black) and
TRMM PR-based retrievals: CSH (green), SLH (blue), and PRH (red); i-l) diabatic heating profiles
in K d−1 and m-p) omega profiles in Pa s−1 in the East Pacific ITCZ from MERRA2 (black
dashed), ERA-Interim (fuchsia dashed), and NCEP-NCAR (green dashed) for DJF (left column), MAM (middle left column), JJA (middle right column), and SON (right column).
and low-level convergence is muted.
South of the equator, the latent heating structure presents significant values during February to March when a double ITCZ appears (Fig. 3.5b); however, a minor amount of latent heating under 800 hPa is observed in the southeast Pacific throughout the year (Figs. 3.5a, c, and d). This latent heating structure is dominated by light precipitation associated with shallow clouds below 2.5 km (Fig. 3.4e), but is insignificant compared to the impor-tant radiative cooling contribution in this dry region with strong subsidence (Takahashi and Battisti 2007b).
3.2.2 Latent heating from TRMM-only algorithms
Latent heating profiles (PR-CPR) are compared with other TRMM-only retrievals (Figs. 3.5e-h). The latent heating profiles from PR-CPR (black) agree to varying degrees with other PR-based algorithms, although the PR-CPR vertical latent heating integrals, equiva-lent to the surface precipitation, match most closely with CSH (green). The CSH retrieval is based only on TRMM PR precipitation, which underestimates low-level precipitation and latent heating, and suggests top-heavy profiles during all seasons. It is important to mention that the CSH algorithm is a similar method to that used in this study, except that it employs a database of stratiform and convective latent heating profiles based on cloud-resolving model runs in different regions of the tropics. In comparison, the SLH (blue) and PRH (red) algorithms present vertical latent heating integrals that are not consistent with the surface precipitation (i.e., their heating magnitudes are too weak). A remarkable bottom-heavy profile during DJF is shown by the SLH algorithm (Fig. 3.5e), with a peak around 900 hPa apparently dominated by shallow precipitation; however, this algorithm is based on one model run from the West Pacific TOGA COARE field campaign and it is not necessarily representative for the study region. The SLH during the other seasons and the PRH throughout the year present a top-heavy structure with peaks at 400 and 500 hPa,
respectively.
3.2.3 Diabatic heating from reanalyses
The seasonal Q1 profiles from the reanalyses are shown in Figs. 3.5i-l. During DJF (Fig. 3.5i), the Q1retrievals have a strong bottom-heavy structure peaking around 800 hPa. Above 600 hPa, Q1is close to zero, suggesting a cloud-free layer. During MAM and SON (Figs. 3.5j and 3.5l, respectively), the heating profiles are more distributed throughout the troposphere but still exhibit a low-level peak around 800 hPa. During JJA (Fig. 3.5k), reanalyses show significant disagreement- while ERA-Interim has heating distributed uni-formly throughout the troposphere, MERRA2 and NCEP Q1 peaks around 400-500 hPa, and all exhibit large differences in magnitude.
3.3 Vertical Motion from Reanalyses
Although reanalysis data might not reliably characterize the vertical motion in the East Pacific ITCZ because of the lack of observational constraints (reanalyses depend on model parameterizations in regions without observational data), an analysis of the reanalysis omega and meridional circulation is included in order to evaluate variations in the merid-ional overturning circulation associated with differences in heating. Agreement between reanalyses does not guarantee that the result is correct, but lack of agreement ensures that at least one reanalysis is incorrect. It is worth mentioning that wind fields from MERRA2 in the East Pacific have been much less studied compared to NCEP and ERA-Interim. Pre-vious studies compared reanalyses against a wind profiler and soundings at the Galapagos Islands (0.4◦S; 86◦W) (Zhang et al. 2008; Huaman and Takahashi 2016). The reanalyses reproduce the correct seasonal cycle of the shallow meridional circulation between the sur-face and 2.5 km (750 hPa), but are in disagreement with a southerly midlevel flow shown by the wind profilers and soundings at 700 hPa.
3.3.1 Meridional Overturning Circulation
The seasonal omega profiles in the East Pacific ITCZ from reanalysis are shown in Figs. 3.5m-p, the associated meridional circulations are shown in Figs. 3.6a-l, and the meridional wind profiles south of the ITCZ are shown in Figs. 3.6m-p. During DJF, reanalyses agree on the bottom-heavy omega structure (i. e., maximum omega occurs at 850 hPa) (Fig. 3.5m). Indeed, the omega profile is consistent with that of Q1 (Fig. 3.5i) since the vertical velocity term is the principal contributor to Q1 in Eq. 2 (Mapes and Houze 1995; Holton and Hakim 2012; Johnson et al. 2016), and somewhat consistent with PR-CPR latent heating estimations that suggest shallow heating predominates during DJF (Fig. 3.5a), although shallow PR-CPR heating is deeper than that observed by the reanalyses in Fig. 3.5i. A southern meridional shallow circulation is seen in MERRA2 (Fig. 3.6a,m) and ERA-Interim (Fig. 3.6b,m) with overturning winds at 800-700 hPa and strongest at 3◦N. NCEP (Fig. 3.6c,m) does not show a clear meridional shallow circulation and instead has small values of vertical motion up to 300 hPa.
Additionally, all reanalyses show a northern overturning cell that extends higher into the troposphere than the southern cell and have descending motion at 15-20◦N associ-ated with cold sea surface temperatures and upwelling in the Costa Rica dome, which is strongest during this season (Xie et al. 2005).
During MAM, upper level omega increases in each reanalysis (Fig. 3.5n) consistent with the increase in heating aloft (Fig. 3.5j) although omega values near 800 hPa remain quite strong. The vertical motion in the northern ITCZ at 5◦N deepens while a second, shallower maximum in omega occurs south of the equator around 5◦S in all reanalyses (Figs. 3.6d-f). The omega in the southern branch of the ITCZ resides solely at low levels in the reanalyses, contrary to PR-CPR latent heating estimations that suggest convection up to 300 hPa (Fig. 3.5b). Regardless, the shallow meridional circulation is weak in MERRA2
Figure 3.6: a-l) Mean meridional vertical mass flux in kg m−2s−1(vectors) and vertical velocity in
Pa s−1(shaded) over 130◦W-90◦W from MERRA2, ERA-Interim and NCEP/NCAR for DJF (left
column), MAM (middle left column), JJA (middle right column), and SON (right column). The
maximum heating position at each level is indicated by gray points. The fluxρw has been amplified
100 times to account for the aspect ratio of the plot. The largest flux vector is around 5 kg m−2
s−1 . m-p) Vertical profiles of meridional wind over 130◦W-90◦W and 5◦ south of the ITCZ (e.
g., during DJF, the southern edge of the ITCZ is at 5◦N and the vertical profile of meridional wind
corresponds to the average between the equator and 5◦N) from MERRA2 (black), ERA-Interim
and ERA-Interim and absent in NCEP (Fig. 3.6n) during boreal spring, possibly because of the disruption caused by the appearance of the southern ITCZ branch.
The main ITCZ is strongest and deepest in boreal summer (Figs. 3.5c, g, and k). Ac-cordingly, during JJA, upper level omega increases dramatically in MERRA2 and NCEP, although the MERRA2 is twice as strong as NCEP, while ERA-Interim remains stub-bornly bottom heavy even though there is some increase in its omega aloft (Fig. 3.5o). These variations in omega distinctly impact the meridional overturning in each reanalysis. MERRA2 exhibits strong shallow (between the surface and 500 hPa) and deep (above 500 hPa) meridional cells (Fig. 3.6g,m) while ERA-Interim′s deep meridional overturning is much weaker because of the weaker omega aloft (Fig. 3.6h,o). Low-level omega in NCEP is weak enough that it does not produce a shallow meridional cell but divergent flow aloft is strong (Fig. 3.6i,o).
Boreal fall represents a transition season between the deep and robust summer ITCZ and the much more shallow winter ITCZ. This transition is evident in the weakening of upper level ascending motion in all three reanalyses in SON (Fig. 3.5p) and a muting of their deep meridional overturning (Figs. 3.6j-l). However, the SON shallow overturning cells south of the ITCZ in MERRA2 and ERA-Interim are arguably the strongest observed during the year (Fig. 3.6p). These vertical meridional cross-sections from reanalyses are comparable with Zhang et al. (2008, their Fig. 14) who highlighted the disagreement in the shallow meridional circulation between the ERA-40 and NCEP reanalyses.
It is also worth noting that each of the reanalyses show a meridional slope in their ver-tical circulations similar to the meridional slope observed in the TRMM/CloudSat latent heating cross sections in Figs. 3.5a-d across seasons. So while there may be issues with how the heating and omega profiles are produced in each reanalysis, at least the latitu-dinal structure of the East Pacific ITCZ is conceptually consistent between the satellite retrievals and reanalysis fields in this respect, suggesting large-scale dynamical controls
that the models do well.
Overall, Fig. 3.6 indicates that there is significant disagreement amongst the reanaly-ses concerning the shallow meridional circulation in the East Pacific ITCZ. NCEP appears unable to produce a robust shallow overturning circulation in any season (Fig. 3.6m-p), consistent with Zhang et al. (2008). During JJA and SON, MERRA2 has a shallow cir-culation with overturning winds at 700 hPa south of the ITCZ (Figs. 3.6g and j), while the ERA-Interim overturning extends up to 500 hPa (Figs. 3.6h and k). In order to assess the shallow meridional circulation, this study compares the meridional wind climatology in the Galapagos Islands (0.4◦S; 89.6◦W) from radiosondes with the winds from each re-analysis at the closest point (0◦; 90◦W) in Fig. 3.7. This structure agrees with Zhang et al. (2008, their Fig. 2), who compared meridional winds at this point using a wind profiler and reanalyses between the surface and 600 hPa. The radiosondes (Fig. 3.7a) suggest a shallow overturning that is strongest at 800 hPa throughout the year and a weak southerly flow around 700-600 hPa during MAM and JJA associated with a midlevel moisture con-vergence in the ITCZ suggested by Huaman and Takahashi (2016). MERRA2 (Fig. 3.7b) shows the shallow overturning circulation best (i.e., winds over 2 m s−1 at 800 hPa during JJA and SON), but the southerly midlevel flow is located at 1◦N (not shown). ERA-Interim (Fig. 3.7c) shows winds about 1 m s−1 around the mid-troposphere and the southerly mi-dlevel flow is displaced to 5◦N. NCEP (Fig. 3.7d) shows a weak northerly flow not related to the shallow meridional circulation and barely shows the midlevel inflow at this grid point.
Figure 3.7: Meridional wind climatology in m s−1 (1998-2014) in shaded and vectors from (a)
radiosondes at 0.4◦S, 89.6◦W and (b) MERRA2, (c) ERA-Interim, and (c) NCEP NCAR at Eq,
90◦W. Negative shading and arrows pointing left indicate northerlies, positive shading and arrows
pointing right indicate southerlies.
3.3.2 Precipitation from reanalyses
Surface precipitation is equivalent to the column-integrated latent heating and as such is related to the large-scale vertical motion (Rose and Lin 2003). Therefore, the discrep-ancy between vertical velocity fields in reanalyses should be mirrored by a disagreement
Figure 3.8: Monthly climatology over 130◦W-90◦W of precipitation (top) and differences
(bot-tom) in mm d−1 against TRMM/CloudSat from MERRA2 (left), ERA-Interim (middle), and
NCEP/NCAR (right). Solid black line indicates rainfall 3 mm d−1from TRMM/CloudSat.
between the surface precipitation fields. Figure 3.8 shows the diagnosed surface precipi-tation from each reanalysis and its differences compared to the total precipiprecipi-tation from the TRMM/CloudSat product. All reanalyses have a similar seasonal latitudinal arrangement of precipitation (i.e., the ITCZ is located at 5◦N and 10◦N during MAM and JJA, respec-tively); however, the strength of the precipitation within the ITCZ varies. MERRA2 shows 6 mm d−1 of precipitation during DJF and MAM and over 14 mm d−1 during JJA (Fig. 3.8 a). This rain distribution is generally similar to TRMM/CloudSat, although MERRA2 produces about 2 mm d−1 less rain around 7◦N throughout the year and 1 mm d−1 more rain on the northern edge of the ITCZ in JJA (Fig. 3.8 b). The rain difference is small-est during JJA when MERRA2 has strong vertical motion throughout the troposphere. By comparison, ERA-Interim shows precipitation over 6 mm d−1 during DJF and MAM and around 12 mm d−1 during JJA (Fig. 3.8 c). This precipitation pattern is also less than TRMM/CloudSat by about 2 mm d−1 around 7◦N (i.e., within the most active part of the ITCZ) as well as in the northern part of the ITCZ during JJA and SON (Fig. 3.8d). The rain difference is largest during JJA when ERA-Interim suggests the predominance of shallow
convection. Finally, NCEP/NCAR shows smaller values of rainfall than the other reanaly-ses and is less than TRMM/CloudSat by 6 mm d−1in JJA and 4 mm d−1the rest of the year (Figs. 3.8 e and 3.8 f). This large rain deficit could lead to possible errors in the vertical velocity in NCEP NCAR in the East Pacific ITCZ.
4. SUMMARY AND CONCLUSIONS
This study uses the TRMM and CloudSat satellite radars to estimate seasonal varia-tions in the vertical latent heating structure in the East Pacific ITCZ (130◦W-90◦W), along with three reanalysis datasets (MERRA2, ERA-Interim and NCEP NCAR) to characterize the vertical motion and meridional overturning circulation in the region. The TRMM PR underestimates light precipitation and latent heating at low levels. On the other hand, the CloudSat CPR has a high sensitivity to light precipitation, but suffers attenuation when deep precipitation is detected. This study combined the long-term climatology of strat-iform and deep convective precipitation from the PR and shallow precipitation from the CPR to estimate the seasonal variability of the vertical latent heating structure in the East Pacific ITCZ. The ITCZ latent heating has a meridional slope as a result of the predomi-nance of shallow precipitation in the southern part of the ITCZ and deep convection in the northern part of the ITCZ. The shallow heating in the southern part of the ITCZ is related to low-level moisture convergence overlain by a stable drier capping layer (Neggers et al. 2007), and the deep heating occurs over the warmest SSTs.
Figure 4.1 shows a schematic of the seasonal meridional circulation associated with the latent heating distribution in the ITCZ. During DJF (Fig. 4.1a), bottom-heavy vertical motion (peaking at 700 hPa) is associated with the prevalence of shallow precipitation and the shallow meridional overturning circulation south of the ITCZ. During MAM (Fig. 4.1b), the double ITCZ has a single vertical motion peak at 700 hPa mantained by a weak shallow overturning circulation and a mid-level inflow at 700 hPa suggested by radiosonde data. A double vertical motion peak is found during JJA (Fig. 4.1c) and SON (Fig. 4.1d); the low-level peak is associated with the strong meridional SST gradient and low-level convergence, while the upper level peak is related to the thermal conditions and the increase
of deep convective and stratiform rain.
In the reanalyses, the DJF and MAM Q1and omega vertical structure in the East Pacific ITCZ are overestimated at low levels and underestimated at upper levels compared to the TRMM/CloudSat heating retrievals. This suggests a potential problem in the convection scheme in reanalyses in marginal convective environments (i.e., during the weak boreal winter ITCZ when subsidence from the Walker circulation is strongest or when a double ITCZ is present in boreal spring and low-level trade wind flows are disrupted) and agrees with the strong sensitivity of GCM convection to humidity variations (Derbyshire et al. 2004). During JJA and SON, CCEWs, easterly waves, and other large-scale features of the environment (like SST patterns) are more conducive to producing deep convective systems; however, this is when the reanalyses disagree most strongly and suggests major difficulties in the representation of more organized convection in GCMs.
It appears that MERRA2 best captures the strengthening and deepening of the ITCZ and its associated shallow and deep meridional overturning circulations during boreal sum-mer compared to the satellite and sounding observations presented, while NCEP produces a very weak ITCZ with no shallow meridional overturning. ERA-Interim struggles to pro-duce enough upper level heating to match the satellite retrievals during JJA, thus producing a deep meridional overturning circulation that is possibly too weak; in addition, its shal-low meridional overturning appears to extend too far into the mid-troposphere compared to radiosonde observations. Furthermore, an overlaying cell structure above 700 hPa is sug-gested by Huaman and Takahashi (2016) and present in the radiosonde data; however, it is misrepresented in ERA-Interim and NCEP, which show an absolute shallow circulation.
Even though MERRA2 is closest to the observational results, reanalyses remain dubi-ous sources to characterize the vertical motion in the East Pacific because of observational constraints in that region. Although satellites provide valuable information, their retrievals may also contain errors and inaccuracies. Therefore, it is necessary to obtain and use more
Figure 4.1: Sketch of the meridional circulation along the East Pacific during a) DJF, b) MAM, c)
JJA, and d) SON. Cold and Warm labels at surface suggest SST below and above 26◦C, respectively.
in situ observations to validate and improve reanalyses and satellite retrievals and likely the representation of convection in GCMs in general in this region such as the upcom-ing Organization of Tropical East Pacific Convection (OTREC) 2019 project (Fuchs and Raymond 2017).
4.1 Challenges
The different spatial sampling of the TRMM PR and CloudSat PR datasets was a major issue. Although both datasets have around 16 swaths each day, the CloudSat CPR has higher horizontal resolution but a more narrow swath compared to the TRMM PR. This study interpolates all variables from CloudSat and TRMM to a horizontal grid of 0.5◦ and
calculates daily and then monthly averages in order to compare both datasets.
It is also important to mention that the CloudSat dataset has not been validated using in situ data in the East Pacific. This study assumes that CloudSat only underestimates heavy precipitation (i.e., large drops) but estimates well the shallow precipitation (Hudak et al. 2008) due to the W-band radar nature. Additionally, this study used precipitation from 2C-PRECIP-COLUMN product due to the long-term data availability. It has been documented that this product has problems with warm rain estimates, primarily related to inappropriate drop size distribution assumptions for warm rain and not appropriately considering the attenuation due to cloud water. For future studies, it is recommend to use the updated product 2C-RAIN-PROFILE to obtain surface precipitation (Lebsock and L’Ecuyer 2001).
This study also identified a potential error in the Cloudsat algorithm to categorize type of precipitation. Fig. 3.3 shows two peaks of stratiform echo tops; however, the lowest peak, around 500 hPa, does not correspond to stratiform structures but convective struc-tures due the lack of bright band and ice concentration above this height. However, this is a minor limitation in this study since stratiform precipitation from CloudSat is not used to calculate latent heating profiles in the East Pacific.
The calculation and comparison of vertical profiles of latent heating was another lim-itation. Latent heating, which depends on net condensation, is not available as a variable in reanalysis data and its estimation was approximated to the total diabatic heating in rainy regions (Hagos et al. 2010).
4.2 Further Study
Future studies involve the characterization of convection in the East Pacific ITCZ at different time scales using observational and model datasets. The upcoming work aims to improve the understanding and prediction of convective systems associated with tropical
propagating modes in the East Pacific using TRMM satellite observations and MERRA2 reanalysis data.
Additional studies will include the OTREC campaign data in order to study the local vertical structure of the East Pacific ITCZ and its interaction with tropical propagating waves. Finally, the vertical structure of the ITCZ will also be studied using multiple re-analyses and CMIP6 models in order to see which models performs best in this complicated region of strong SST gradients and dry mid-troposphere. The effects of meridional SST gradients on tropical propagating modes impacting the East Pacific will be analyzed in CMIP6 models, which are expected to have varying degrees of realism and biases from model to model.
REFERENCES
Ahmed, F., C. Schumacher, Z. Feng, and S. Hagos, 2016: A retrieval of tropical latent heating using the 3D structure of precipitation features. Journal of Applied Meteorology and Climatology, 55(9), 1965-1982.
Awaka, J., T. Iguchi, H. Kumagai, and k. I. Okamoto, 1997: Rain type classification algorithm for TRMM precipitation radar. In Geoscience and Remote Sensing, 1997. IGARSS’97. Remote Sensing-A Scientific Vision for Sustainable Development., 1997 IEEE International (Vol. 4, pp. 1633-1635). IEEE.
Back, L. E., and C. S. Bretherton, 2006: Geographic variability in the export of moist static energy and vertical motion profiles in the tropical Pacific. Geophysical Research Letters,33(17).
Back, L. E., and C. S. Bretherton, 2009: A simple model of climatological rainfall and vertical motion patterns over the tropical oceans. Journal of Climate, 22(23), 6477-6497.
Bellucci, A., S. Gualdi, and A. Navarra, 2010: The double-ITCZ syndrome in coupled general circulation models: The role of large-scale vertical circulation regimes. Journal of Climate,23(5), 1127-1145.
Bosilovich, M. G., R. Lucchesi, and M. Suarez, 2015: MERRA-2: File specification. Bretherton, C. S., 2007: Challenges in numerical modeling of tropical circulations. The
Global Circulation of the Atmosphere, 3026330.
Dee, D. P., S. M. Uppala, A. J. Simmons, P. Berrisford, P. Poli, and Coathors, 2011: The ERA�Interim reanalysis: Configuration and performance of the data assimilation sys-tem. Quarterly Journal of the Royal Meteorological Society,137(656), 553-597. Derbyshire, S. H., I. Beau, P. Bechtold, J. Y. Grandpeix, J. M. Piriou, J. L. Redelsperger,
and P. M. M. Soares, 2004: Sensitivity of moist convection to environmental humidity.
Quarterly Journal of the Royal Meteorological Society,130(604), 3055-3079.
Fuchs, Z, and D. Raymond, 2018: OTREC: Organization of Tropical East Pacific Convec-tion (Available at https://swcwc.files.wordpress.com/2018/07/ortec-short-explanaConvec-tion.pdf). Funk , A., C. Schumacher, and J. Awaka, 2013: Analysis of rain classifications over the
tropics by version 7 of the TRMM PR 2A23 algorithm. Journal of the Meteorological Society of Japan. Ser. II,91(3), 257-272.
Hagos, S., C. Zhang, W. K. Tao, S. Lang, Y. N., Takayabu, S. Shige, M. Katsumata, B. Olson and T. L’Ecuyer, 2010: Estimates of tropical diabatic heating profiles: common-alities and uncertainties. Journal of Climate,23(3), 542-558.
Handlos, Z. J., and L.E. Back, 2014: Estimating vertical motion profile shape within trop-ical weather states over the oceans. Journal of Climate,27(20), 7667-7686.
Hastenrath, S, 2002: The intertropical convergence zone of the eastern Pacific revisited.
International Journal of Climatology,22(3), 347-356.
Haynes, J. M., and G. L. Stephens, 2007: Tropical oceanic cloudiness and the incidence of precipitation: Early results from CloudSat. Geophysical Research Letters, 34(9). Haynes, J. M., T. S. L’Ecuyer, G. L. Stephens, S. D. Miller, C. Mitrescu, N. B. Wood,
and S. Tanelli, 2009: Rainfall retrieval over the ocean with spaceborne W�band radar.
Journal of Geophysical Research: Atmospheres, 114(D8).
Holton, J. R., and G. J. Hakim, 2012: An introduction to dynamic meteorology (Vol. 88).
Academic press.
Houze, R. A., 1982: Cloud clusters and large-scale vertical motions in the tropics. Journal of the Meteorological Society of Japan. Ser. II,60(1), 396-410.
Houze, R. A., 1989: Observed structure of mesoscale convective systems and implica-tions for large-scale heating. Quarterly Journal of the Royal Meteorological Society,
115(487), 425-461.
Huaman, L., and K. Takahashi, 2016: The vertical structure of the eastern Pacific ITCZs and associated circulation using the TRMM Precipitation Radar and in situ data. Geo-physical Research Letters, 43(15), 8230-8239.
Huaman, L., and C. Schumacher, 2018: Assessing the vertical latent heating structure of the East Pacific ITCZ using the CloudSat CPR and TRMM PR. Journal of Climate,
31(7), 2563-2577.
Hudak, D., P. Rodriguez, and N. Donaldson, 2008: Validation of the CloudSat precipitation occurrence algorithm using the Canadian C band radar network. Journal of Geophysical Research: Atmospheres,113(D8).
Iguchi, T., T. Kozu, R. Meneghini, J. Awaka, and K. I. Okamoto, 2000: Rain-profiling algorithm for the TRMM precipitation radar. Journal of Applied Meteorology,39(12), 2038-2052.
Johnson, R. H., P.E. Ciesielski, and T. M Rickenbach, 2016: A Further Look at Q1 and Q2 from TOGA COARE, Meteorological Monographs, 56, 1.1–1.12, doi: 10.1175. AMSMONOGRAPHS-D-15-0002.1.
Kalnay, E., M. Kanamitsu, R. Kistler, W. Collins, D. Deaven, and Coathors, 1996: The NCEP/NCAR 40-year reanalysis project. Bulletin of the American Meteorological So-ciety,77(3), 437-471.
Kiladis, G. N., M. C. Wheeler, P. T. Haertel, K. H. Straub, and P. E. Roundy, 2009: Con-vectively coupled equatorial waves. Reviews of Geophysics,47(2).
Kodama, Y. M., M. Katsumata, S. Mori, S. Satoh, Y. Hirose, and H. Ueda, 2009: Climatol-ogy of warm rain and associated latent heating derived from TRMM PR observations.
Journal of Climate,22(18), 4908-4929.
Measuring Mission (TRMM) sensor package. Journal of Atmospheric and Oceanic Technology,15(3), 809-817.
Lebsock, M. D., and T. S. L’Ecuyer, 2011: The retrieval of warm rain from CloudSat.
Journal of Geophysical Research: Atmospheres,116(D20).
Li, W., and C. Schumacher, 2011: Thick anvils as viewed by the TRMM precipitation radar. Journal of Climate,24(6), 1718-1735.
Lin, J. L, 2007: The double-ITCZ problem in IPCC AR4 coupled GCMs: Ocean–atmosphere feedback analysis. Journal of Climate,20(18), 4497-4525.
Lindzen, R. S., and S. Nigam, 1987: On the role of sea surface temperature gradients in forcing low-level winds and convergence in the tropics. Journal of the Atmospheric Sciences,44(17), 2418-2436.
Lutgens, F. K., and E. J. Tarbuck, 2013: The Atmosphere – An Introduction to Meteorol-ogy.
Mapes, B. E., and R. A. Houze Jr, 1995: Diabatic divergence profiles in western Pacific mesoscale convective systems. Journal of the Atmospheric Sciences, 52(10), 1807-1828.
Martin, E. R., and C. Schumacher, 2012: The relationship between tropical warm pool precipitation, sea surface temperature, and large-scale vertical motion in IPCC AR4 models. Journal of the Atmospheric Sciences,69(1), 185-194.
Neggers, R. A., J. D. Neelin, and B. Stevens, 2007: Impact mechanisms of shallow cumulus convection on tropical climate dynamics. Journal of Climate,20(11), 2623-2642. Nelson, E. L., T. S. L’Ecuyer, S. M