Universidade de São Paulo
2014
Regular graph construction for
semi-supervised learning
Journal of Physics: Conference Series, Bristol, v.490, p.012022-1-012022-4, 2014
http://www.producao.usp.br/handle/BDPI/44841
Downloaded from: Biblioteca Digital da Produção Intelectual - BDPI, Universidade de São Paulo
Biblioteca Digital da Produção Intelectual - BDPI
This content has been downloaded from IOPscience. Please scroll down to see the full text.
Download details:
IP Address: 143.107.183.235
This content was downloaded on 13/03/2014 at 18:29
Please note that terms and conditions apply.
View the table of contents for this issue, or go to the journal homepage for more 2014 J. Phys.: Conf. Ser. 490 012022
Regular graph construction for semi-supervised learning
Didier A. Vega-Oliveros, Lilian Berton, Andre Mantini Eberle, Alneu de Andrade Lopes, Liang Zhao
Instituto de Ciˆencias Matem´aticas e de Computac¸˜ao, Universidade de S˜ao Paulo - Campus de S˜ao Carlos, CP 668 - S˜ao Carlos, SP - Brazil
E-mail:davo,lberton,andre,alneu,[email protected]
Abstract. Semi-supervised learning (SSL) stands out for using a small amount of labeled points for data clustering and classification. In this scenario graph-based methods allow the analysis of local and global characteristics of the available data by identifying classes or groups regardless data distribution and representing submanifold in Euclidean space. Most of methods used in literature for SSL classification do not worry about graph construction. However, regular graphs can obtain better classification accuracy compared to traditional methods such ask-nearest neighbor (kNN), sincekNN benefits the generation of hubs and it is not appropriate for high-dimensionality data. Nevertheless, methods commonly used for generating regular graphs have high computational cost. We tackle this problem introducing an alternative method for generation of regular graphs with better runtime performance compared to methods usually find in the area. Our technique is based on the preferential selection of vertices according some topological measures, like closeness, generating at the end of the process a regular graph. Experiments using the global and local consistency method for label propagation show that our method provides better or equal classification rate in comparison withkNN.
1. Introduction
Semi-supervised learning (SSL) uses large amount of unlabeled data and available labeled data to build classifiers applyied to real problems. As SSL requires less human effort and gives higher accuracy, it is of great interest [10], [2]. Among the current SSL methods, graph based approaches have emerged and highlighted, specially, when no parametric information is available about the data distribution.
Several graph-based methods were developed and much of them are similar to each other. Zhu (2005) [10] arguments that it is more important to construct a good graph than to choose among the methods. However, graph construction is not a well studied area. Only recently, the issue of graph construction has received attention [8], [4], [5].
The most common method used for graph construction is neighbor graphs, for examplek-Nearest Neighbors (kNN) graph, where each item is connected to its knearest neighbors under some distance measure. AskNN method greedily connects theknearest neighbors to each vertex and may return graphs where some vertices have more than k neighbors, Jebara et al. (2009) [4] proposed the b-matching, which ensures the graph is regular (every vertex withbneighbors) and by experimental results suggest that a regular graph can achieve better classification results compared tokNN. Huang and Jebara (2007) [3] developed an implementation based on belief propagation, but the guaranteed running time of the implementation is O(bn3). In some cases, like in the work of Ozaki et al. (2011) [6], building a b -matching graph is inviable in terms of computational cost.
In the supervised context, nearest neighbor classification does not work properly in high-dimensional space. Radovanovic et al. (2010) [7] argue that this happen because a hub is an example close to many
2nd International Conference on Mathematical Modeling in Physical Sciences 2013 IOP Publishing Journal of Physics: Conference Series490(2014) 012022 doi:10.1088/1742-6596/490/1/012022
Content from this work may be used under the terms of theCreative Commons Attribution 3.0 licence. Any further distribution of this work must maintain attribution to the author(s) and the title of the work, journal citation and DOI.
thekclosest neighbors of the other example in the original space.
To test this hipotesis, that regular graph can be better for SSL, we introduce a new method for generation of graphs with no hubs. Our method has quadratic time complexity, as kNN algorithm. To evaluate if this technique is better than other that generates hubs, like kNN, we compare the classification accuracy between them using Local and Global Consistency (LGC) algorithm [9] for the label propagation task. The classification results from UCI [1] and Chapelle [2] data sets show the presented method achieves results better or equal thankNN method.
The remainder of this paper is organized as follows. Section 2 defines basic concepts. Section 3 provides the details of the graph construction method introduced and the experimental validation results for the algorithm on benchmark datasets. Concluding remarks are then provided in Section 4.
2. Definitions
Given a set ofnexamples,X ={x1, . . . , xn}, semi-supervised classification methods utilizellabeled
examples{(x1, y1), . . . ,(xl, yl)}and the remainingu=n−lunlabeled examples{xl+1, . . . , xl+u}to
infer the missing labels {yl+1, . . . , yl+u}corresponding to the unlabeled examples. For using a
graph-based algorithm it is necessary the estimation of a weighted undirected sparse graphGderived from the input dataX. In this paper we are interested in how to construct a regular graph fromX.
A graphG= (V, E)is formed by a setV of vertices (nodes) and a setEof edges (links) that connect pairs of vertices. The cardinality ofV is usually denoted byn, the cardinality ofEbym. If two vertices are joined by an edge, they are adjacent and we call them neighbors. Often it is useful to associate numerical values (weights) to the edges or vertices of a graphG. Edge weights can be represented as a functionw:E → <that assigns to each edgee∈ E a weightw(e). In the context of this work, edge weights describe similarity between the adjacent vertices.
A graph G can be described by the adjacency matrix P, a N × N square matrix whose entry pij (i, j= 1, . . . , N)is equal to1when the linkpij exists, and0otherwise. The degreediof a nodeiis
the number of edges incident with it, and is defined in terms of the adjacency matrixPasdi =Pj∈Npij.
If a node has a degree much bigger than the others nodes, it is called hub. The averaged degree for a network is defined ashdi= N1 P
n∈Ndn. Graph-based methods are in general transductive, that means
it only works on the labeled and unlabeled training data, and not handle unseen data. Algorithm 1SequencialkNN method
input:data baseX,kmax
symbols:P - adjacency matrix; R- set of vertices order by a relevance criterium; G- set of vertices degree initialized asG: [0, . . . ,0]1×N
1: computekNN←getK-NearestNeighbor(X) 2: computeR←getOrderByRelevance(X) 3: vi,vj,k= 1 4: repeat 5: vi←getNextNode(R) 6: vj←getNearestPossibleNeighbor(vi,k,kmax,kNN) 7: if vj 6=NULL 8: connect(P,vi,vj,G) 9: else 10: k←k+ 1 11: until∃vi|G(vi)< kmax 12: output:P 2
3. Regular graph construction
We introduce a new method for regular graph construction calledSequencialkNN(S-kNN). The method consists in create connections incrementaly, from k = 1to a maximum kmax value. In the process a
vertex is chosen by a relevance criterium and establish a connection with the disponible nearest neighbor. The relevance criterium order the vertices by a Complex Network measure. Here we use the measure closeness:Ci = P 1
xj∈Vkxi−xjk, wherek.kis some distance kernel, and we use Euclidian distance.
Algorithm 1 describes the steps for the graph construction. After computing theknearest neighbors vector for the vertices and order it by a relevance criterium, we take vertices from the ordered vector and try to connect each vertex to the nearest neighbor into thekmax neighbors, that have a degree smaller
thank. If it is not possible, we incrementkand then, we repeat the process. The algorithm ends when all the vertices have degree bigger or equal thankmax. If it does not happen, the vertex that have degree
smaller thankmax will connect to theknearest neighbor with smallest degree. The complexity is the
same askNN algorithm.
The experiments were carried out on ten data sets. The first seven are from UCI Machine Learning Repository [1] and the last three are from Chapelle et al. (2006) [2]. For USPS, DIGIT1 and COil2 we
apply Principal Component Analysis (PCA) to all data sets reducing the dimensions to 50. The matrix was symmetrized as followsPij =max(Pij, Pji). To generate the weighted graphW we use the binary
weighting approach, whereW =P. The labeled points was randomly selected from all the points. The parameter kmax was varied from 1 to 20. Averaged classification accuracy of 30 runs is used as the
evaluation measure and the results are shown in Table 1.
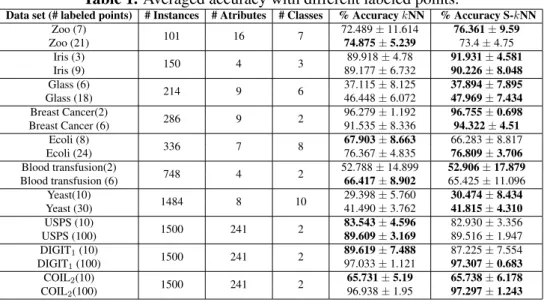
Table 1.Averaged accuracy with different labeled points.
Data set (# labeled points) # Instances # Atributes # Classes % AccuracykNN % Accuracy S-kNN
Zoo (7) 101 16 7 72.489±11.614 76.361±9.59 Zoo (21) 74.875±5.239 73.4±4.75 Iris (3) 150 4 3 89.918±4.78 91.931±4.581 Iris (9) 89.177±6.732 90.226±8.048 Glass (6) 214 9 6 37.115±8.125 37.894±7.895 Glass (18) 46.448±6.072 47.969±7.434 Breast Cancer(2) 286 9 2 96.279±1.192 96.755±0.698 Breast Cancer (6) 91.535±8.336 94.322±4.51 Ecoli (8) 336 7 8 67.903±8.663 66.283±8.817 Ecoli (24) 76.367±4.835 76.809±3.706 Blood transfusion(2) 748 4 2 52.788±14.899 52.906±17.879 Blood transfusion (6) 66.417±8.902 65.425±11.096 Yeast(10) 1484 8 10 29.398±5.760 30.474±8.434 Yeast (30) 41.490±3.762 41.815±4.310 USPS (10) 1500 241 2 83.543±4.596 82.930±3.356 USPS (100) 89.609±3.169 89.516±1.947 DIGIT1(10) 1500 241 2 89.619±7.488 87.225±7.554 DIGIT1(100) 97.033±1.121 97.307±0.683 COIL2(10) 1500 241 2 65.731±5.19 65.738±6.178 COIL2(100) 96.938±1.95 97.297±1.243
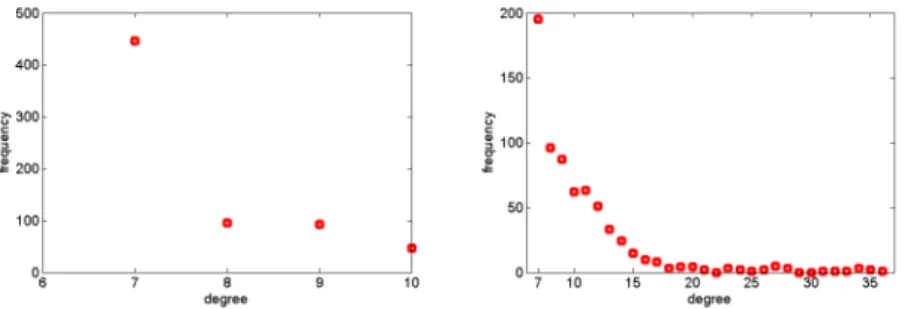
Figure 1 shows the degree distribution for S-kNN andkNN graphs built using the Breast-Cancer data set withk = 7. We notice that S-kNN method has almost all vertices with a degree equal7, less than 250 vertices have degree equal8,9,10. It generated 2597 edges with the averaged degree equal7.6. The kNN method has vertices with vary different degree where less than 200 vertices have degree equal7, the remainig have degree from8 to36. It generated 3548 edges with the averaged degree equal 10.4. Figure 2 shows a graph built using the Glass data set withk = 5. Bigger the points, bigger the vertice degree. ThekNN graph has more bigger points compared to S-kNN.
4. Conclusion
From the experiments results we notice that the introduced method achieves better or equals results than kNN algorithm. This indicates that regular graphs also have good classification accuracy in graph-based
2nd International Conference on Mathematical Modeling in Physical Sciences 2013 IOP Publishing Journal of Physics: Conference Series490(2014) 012022 doi:10.1088/1742-6596/490/1/012022
Figure 1. Degree distribution for S-kNN andkNN graphs built using the Breast-Cancer data set,k= 7.
Figure 2.S-kNN andkNN graphs built using the Glass data set,k= 5.
SSL. For future work we will do statistic tests to detect if there are differences among algorithms. We also will compare the results tob-matching method and test other measures for the relevance criterium. 5. Acknowledgments
Grant 2011/21880-3, Sao Paulo Research Foundation (FAPESP) and National Council for Scientific and Technological (CNPq). The opinions, assumptions, and conclusions or recommendations expressed in this material are those of the author(s) and do not necessarily reflect the views of FAPESP and CNPQ. References
[1] Bache, K.; Lichman, M. (2013).UCI Machine Learning Repository[http://archive.ics.uci.edu/ml]. Irvine, CA: University of California, School of Information and Computer Science.
[2] Chapelle, O.; Schlkopf, B.; Zien, A. editors (2006)Semi-Supervised Learning. MIT Press, Cambridge, MA.
[3] Huang, B.; Jebara, T. (2007)Loopy belief propagation for bipartite maximum weight b-matching. Int. Workshop on Artificial Intelligence and Statistics.
[4] Jebara, T.; Wang, J.; Chang, S.F. (2009)Graph construction and b-matching for semi-supervised learning. In Proceedings of the 26th Annual International Conference on Machine Learning, p. 441-448.
[5] Maier, M.; Luxburg, U. (2009) Influence of graph construction on graph-based clustering measures. The Neural Information Processing Systems, v. 22, p. 1025-1032.
[6] Ozaki, K.; Shimbo, M.; Komachi, M.; Matsumoto, Y. (2011)Using the Mutual k-Nearest Neighbor Graphs for Semi-supervised Classification of Natural Language Data. In Proceedings of the 15th Conference on Computational Natural Language Learning, p. 154-162.
[7] Radovanovic, M.; Nanopoulos, A; Ivanovic, M. (2010)Hub in space: popular nearest neighbors in high-dimensional data. Journal of Machine Learning Research, v.11.
[8] Wang, F.; Zhang, C. (2008)Label propagation through linear neighborhoods. IEEE Transactions on Knowledge and Data Enginineering, v. 20, p. 55-67.
[9] Zhou, D.; Bousquet, O.; Lal, T. N.; Weston, J.; Schlkopf, B. (2004) Learning with local and global consistency. In Advances in Neural Information Processing Systems, v. 16, p. 321-328: MIT Press.
[10] Zhu, X. (2005)Semi-supervised learning literature survey. Technical report 1530 - Computer Sciences, University of Wisconsin-Madison.