WHO PARTICIPATES IN EQIP?
Laura McCannaJennifer Núñezb
Paper prepared for presentation at the American Agricultural Economics Association Annual Meeting. Providence, Rhode Island. July 24-27, 2005. (Abstract #136438)
Copyright 2005 by Laura McCann and Jennifer Núñez. All rights reserved. Readers may make verbatim copies of this document for non-commercial purposes by any means, provided that this copyright notice appears on all such copies.
Acknowledgements: This research was supported by the Missouri Agricultural Experiment Station and a University of Missouri Research Council Grant.
a Dr. Laura McCann is an assistant professor, Department of Agricultural Economics, University of Missouri-Columbia, 214 Mumford Hall, Missouri-Columbia, MO 65211. Tel.: (573) 882-1340; email: [email protected] b Jennifer Núñez is a master’s candidate in the Department of Agricultural Economics, University of Missouri-Columbia, 318 Mumford Hall, Missouri-Columbia, MO 65211. Tel.: (573) 882-7330; email: [email protected]
Abstract
The Environmental Quality Incentive Program is designed to improve environmental stewardship of crop and livestock production. Funds requested through the program greatly exceed the supply. Recent changes make the program more attractive for larger farmers. A survey of farmers in Missouri and Iowa found that larger farmers (in terms of farm sales) and those without a personal concern for water quality in their county are significantly more likely to be aware of EQIP. Those who plan to expand in the next five years, and those who use and trust public information sources, are more likely to be aware of the program and also to participate in EQIP. Age and education variables were not significant.
Key Words EQIP, adoption, farm size.
Introduction
The Environmental Quality Incentive Program (EQIP) was initiated in the 1996 Farm Act to promote improved environmental stewardship on lands in agricultural production. This is in contrast to the Conservation Reserve Program that retired land in order to promote
environmental objectives. Demand for participation in EQIP exceeds the funds available even though the 2002 Farm Act significantly increased funding for the program from $200 million per year up to 1.3 billion in 2007. About $1 is available for every $10 that are requested (Carpenter). In the amended program, livestock practices are to receive 60% of the available funding,
compared to 50% under the 1996 Farm Act. The maximum payment was raised to $450,000 over the life of the farm bill, which may make the program relatively more attractive for larger farmers. Also, under the 2002 Farm Act, CAFOs are able to apply for EQIP funding. Livestock farms, whether they are CAFOs or not, are required to have Comprehensive Nutrient
participation. Ribaudo et al. (2004) indicate that costs associated with CNMP development and record-keeping may be relatively more important on small farms. There are also resource constraints as far as the capacity of NRCS to write CNMP’s (Carpenter).
The issue of who actually participates in EQIP is of interest since there may be distributional and structural impacts as well as environmental impacts. Cochrane and Runge indicate that, contrary to the goal of preserving small family farms, agricultural income support policies have actually hastened their demise. Batie indicates that EQIP can be considered a form of “green payment” that has advantages relative to other forms of agricultural income support with respect to future trade negotiations. Previous work regarding the effects of EQIP funding on the costs of improved nutrient management strategies for different hog farm sizes assumed that the application and success rates were similar for all sizes (Ribaudo et al. 2003, Key). A benefit cost analysis of the new rules predicted that the changes in the program would result in participation by an additional 31,000 AFOs and 3,000 CAFOs (Atwood et al.). The benefits of animal waste management practices were higher for livestock operations with more than 1000 animal units but fairly similar for the other size classes. However, participation by small and mid-sized livestock farms is important since they account for 80 percent of animals, 52 percent of excess manure nitrogen from confined operations, and 48 percent of excess manure
phosphorus from confined operations (Gollehon). Conceptual model
There are multiple stages in the process of adoption of an innovation. The first stage is knowledge or awareness of the innovation (Nowak, Rogers). Farmers must first be aware of the EQIP program before they can decide whether to participate. A University of Georgia survey of Extension agents found the number one reason farmers didn’t participate in EQIP was that they
weren’t aware of the program. Since the program is voluntary, environmental benefits will ultimately depend on who successfully applies. The literature shows that adoption is a function of farm and farmer characteristics as well as perceptions regarding the practice itself (Rogers, Stoneman). The same set of variables was used for the analysis of both awareness and participation and the variables are discussed below.
It has been argued that a need for the innovation must exist before the individual is receptive to receiving information regarding the innovation (Rogers). More specifically, awareness of water quality and other environmental factors are sometimes considered the first step toward a decision to adopt conservation-agricultural practices (Hoban et al., Traoré et al.). We would thus expect that people who are concerned with environmental issues are more likely to be aware of EQIP and more likely to participate. In addition, people who regularly interact with government agencies such as Extension and the Natural Resources Conservation Service (NRCS) would be more likely to be aware of government programs including EQIP. Age is sometimes found to be an important characteristic in the adoption of innovations, with younger people generally being more likely to adopt (Rogers). Educationis a categorical variable with less than high school, high school graduate (the base) and more than high school as categories. Generally higher levels of education are linked to higher levels of adoption. It is expected that education will result in lower information costs and thus increased awareness and participation. McLean-Meyinsse et al. examined the participation in CRP of small Louisiana farmers and found that farmers with higher education levels and incomes were more likely to be aware of the program. Off-farm income has been found to be both positively (Feder et al.) and negatively (Gillespie et al.) associated with adoption of innovations. McLean-Meyinsse et al. found that farmers who worked full-time on the farm were more likely to participate in CRP.
Programs such as EQIP can lower the costs of improved environmental practices and thus increase adoption. Expectations about future regulations and plans for the farm would be
expected to affect participation in programs such as EQIP. Whether farmers expected water quality regulations to become more strict in five years and whether they expected to expand their operation in five years were included as categorical variables. Percent rented was included since renters are assumed to be less interested in the long-term impacts on land than owners and would thus be less interested in conservation practices (Sunding and Zilberman). In addition, whether the farm had livestock and crops, or was crop only, and whether the farm was located in
Missouri or Iowa were included as explanatory variables.
The probability of being aware of (participating in) EQIP as a function of farm and farmer characteristics can be modeled as a binary logit model:
(
)
[
]
j m j j i n i i u u P X X P∑
∑
= = + + = − 1 1 1 / log α β βwhere Pu = Probability of being aware of (participating in) EQIP (1-Pu) = Probability of not being aware (participating) Xi = Farm characteristics
Xj = Farmer characteristics
A survey of both crop only and livestock/crop farmers in Iowa and Missouri was conducted in the winter of 2004 to examine environmental practices (In 2003 did you…?) and attitudes (using Liekert scale responses). Survey design and implementation followed Dillman. Surveys were sent to 1500 farmers and resulted in a response rate (after deleting people who had moved or were no longer farming) of 51%. There were 449 usable surveys for this analysis due to missing responses for some questions.
Results and Discussion
Farmers wrote some comments on the questionnaire. Some of the comments relating to EQIP reflected a desire to participate, saying “not yet” or that they had applied to the program but didn’t qualify. Other comments complained about the program: "Some of the help is not really help", "Poorly managed", "Not a good program" but it is difficult to tell what specific problems they were referring to. Other comments seemed to indicate that the program wasn’t fair: "Not equal-some get help others don't", "Some receive money that others could get if they were told."
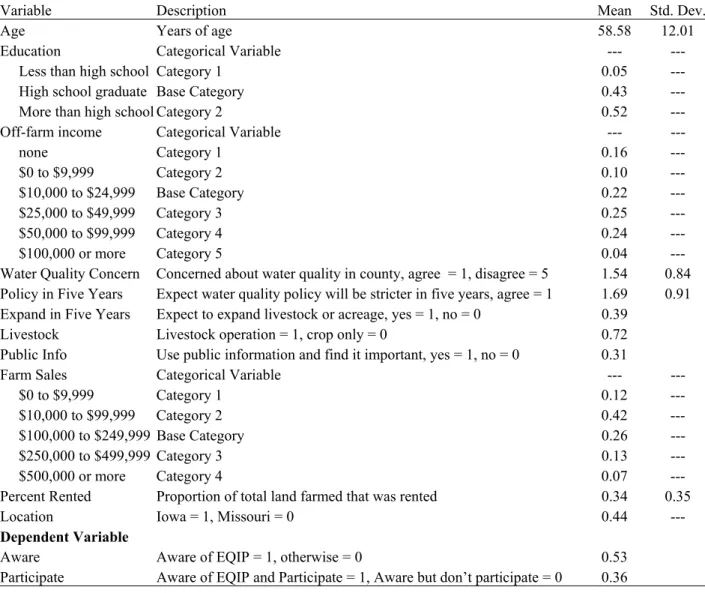
Summary statistics are presented in Table 1. Fifty-three percent of respondents were aware of EQIP, which is similar to the awareness levels found by McLean-Meyinsse et al. for the CRP program in Louisiana after four years of operation. About 14% of all the respondents indicated that they participate in EQIP. Sixteen percent of the crop only respondents and 13% of the livestock farmers participate. Thirteen percent of Missouri respondents and 16% of Iowa respondents participate. Lack of awareness seems to be a barrier as only 42% of those not participating were aware of the program. Most respondents are concerned about water quality in their county and expect that water quality policies regarding agriculture will become more strict in the next five years. A majority of the farmers have at least $25,000 in off-farm income. The response rate was somewhat lower for Iowa than for Missouri.
Two logit analyses were conducted to determine factors affecting awareness of EQIP, and for those farmers who were aware of the program, factors affecting participation. Results of the logit analysis using SAS showed that the awareness model as a whole was highly significant (p < 0.0001) for the likelihood ratio and Wald statistic although the max-rescaled R2 was only 0.19. Concern for water quality in their county was a significant predictor of EQIP awareness but since the scale ranged from Agree = 1 to Disagree = 5, it is the opposite sign from what was
expected. Whether they expected that environmental regulations would become more stringent in the next 5 years was not significant. If farmers planned to expand their operations in the next five years, they were more likely to participate. If farmers used information provided by public sector agencies such as NRCS and found it valuable, they were significantly more likely to be aware of the program which was expected. The farm sales categories of $0-9,999 and $10,000-99,999 were significantly less likely to be aware of the EQIP program than the base category (of $100,000 to 249,999). Those with sales over $500,000 were significantly more likely to be aware of the program.
There were no significant differences between crop only and livestock/crop farmers or between farmers in Iowa and Missouri. The percent of cropland rented was also not a significant predictor of EQIP participation. Off-farm income was modeled as a categorical variable and none of the five categories differed significantly from the base category of $10,000-24,999. Neither age nor education was a significant predictor of EQIP awareness.
Results of the participation model were less satisfactory. The model as a whole was not significant for the likelihood ratio or the Wald statistic and the max-rescaled R2 was only 0.13. Given that at least one of the respondents had applied but not been successful, the questionnaire should have included a question regarding whether they had applied which may explain this result. Water quality concern and whether they expected that environmental regulations would become more stringent in the next 5 years were not significant. If farmers planned to expand their operations in the next five years, they were significantly more likely to participate. Also similar to the awareness model, if farmers used information provided by public sector agencies such as NRCS and found it valuable, they were significantly more likely to be aware of the program. None of the farm sales categories were significantly different from the base category.
There were no significant differences between crop only and livestock/crop farmers or between farmers in Iowa and Missouri.
These results are interesting in a number of respects. It seems that farmers are motivated to apply for EQIP funds in order to position themselves for the future and are less motivated by a desire to protect the environment. It should be noted however that there was little variation in the concern for water quality variable, with almost 89% agreeing that they were concerned (1 or 2 on a five-point Liekert scale). Those participating are commercial farmers that plan to expand their crop or livestock operations in the future. Smaller farmers are less likely to be aware of the program and would thus be less likely to apply which means that the positive effects on profits for small hog operations shown by Key may be questionable. For those who are aware of the program however, there were no significant differences in participation rates by size.
It is surprising that off-farm income does not affect participation since a number of researchers have shown that it can affect adoption of conservation practices due to lessening capital constraints or increasing the opportunity cost of time. Age may not be significant since the life-cycle factor is accounted for by whether they plan to expand the operation. Interestingly, education levels were not significant for either awareness or participation and this was true even when the public information variable was omitted.
Conclusions and Further Research
Farmers who are in contact with the Extension Service and NRCS are more likely to be aware of EQIP and to participate in the program. It may be useful to disseminate information on the program more widely. However, given the limited funds, this may also result in a larger number of people being frustrated if their applications are not successful. It seems that farmers may be using EQIP funds to expand their operations since those who had plans to expand were
more likely to participate in the program. This group of farmers would be less interested in land retirement programs such as CRP. Additional funds were allocated to livestock operations to help them comply with the new EPA regulations but, at least so far, this use of the funds is not supported since, if anything, livestock operations were less likely to participate. Smaller farmers were significantly less likely to be aware of the program and larger farms were significantly more likely to be aware of the program. One would expect that smaller farms would be more likely to need additional assistance to implement water quality improvement practices.
Given that acceptance of farmer plans by NRCS depends in part on the environmental benefits expected, the participation model could be improved by obtaining information on factors that make up the composite environmental index for each farm such as its erosion potential or endangered species habitat. In addition, perceived complexity of the program and application process may affect participation and this was not specifically addressed in the survey. Also, farmers were not asked whether they had applied to EQIP, only whether they were aware and whether they participated in the program. Given the large numbers of farmers that apply
unsuccessfully, there are actually three stages rather than two, which is different from the case of adoption of conservation practices more generally.
Since the survey asked about 2003 practices and demographic information, the 2002 changes in EQIP are probably not reflected in our results. One would expect to find that more and larger livestock operations would participate in the program in the future. One would also expect that awareness of the program would increase with time. A follow-up survey could be conducted in several years to examine the impact of the changes on awareness and participation.
References
Atwood, J., L. Knight, A. Cattaneo, P. Smith. 2003. “Benefit Cost Analysis of the 2002 EQIP Farm Bill Provisions” Selected Paper at the AAEA Annual Meeting, Montreal, Canada, July 27-30, 2003.
Batie, S. 1999. “Green Payments as Foreshadowed by EQIP” Staff Paper 99-45, Department of Agricultural Economics, Michigan State University.
Carpenter, G. 2005. “USDA-NRCS: Farm Bill and Other Programs Addressing Animal Operations” Presentation at “What’s Under the CAFO Radar Screen? Exploring Water Quality Concerns Related to Small and Mid-Size Animal Operations in the U.S.” Maritime Institute, Linthicum, Maryland, May 2-3, 2005.
Cochrane, W. and C.F. Runge. 1992. Reforming Farm Policy: Toward a National Agenda Iowa State Univ. Press, Ames, Iowa.
Dillman, D. A. 2000. Mail and Internet Surveys: The Tailored Design Method Second ed. New York: John Wiley & Sons, Inc.
Feder, G., R.E. Just, and D. Zilberman. "Adoption of Agricultural Innovations in Developing Countries." Economic Development and Cultural Change 30(January 1985): 59-72. Gillespie, J. M., C. G. Davis, and N. C. Rahelizatovo. "Factors Influencing the Adoption of
Breeding Technologies in U.S. Hog Production." Journal of Agricultural and Applied Economics 36, no. 1(2004): 35-47.
Gollehon, N. 2005. “Status and Trends in Small and Mid-Sized Animal Operations in the U.S.” Presentation at “What’s Under the CAFO Radar Screen? Exploring Water Quality Concerns Related to Small and Mid-Size Animal Operations in the U.S.” Maritime Institute, Linthicum, Maryland, May 2-3, 2005.
Hoban, T. J., W. B. Clifford, M. Futreal, and M. McMillan. 1997. "North Carolina producers' adoption of waste management practices." Journal of Soil and Water Conservation 52(5): 332-339.
Key, N. 2004. “Manure Application Standards and EQIP Payments: The Distribution of
Economic and Environmental Costs and Benefits Across US Hog Farms” Selected Paper at the AAEA Annual Meeting, Denver, Colorado, August 1-4, 2004.
McLean-Meyinsse, P.E, J. Hui, and R. Joseph, Jr. 1994. “An Empirical Analysis of Louisiana Small Farmers’ Involvement in the Conservation Reserve Program”, J. of Agricultural and Applied Economics 26(2), December 1994, 379-385.
Nowak, P.J. 1983. "Strategies for Increasing the Adoption of Conservation Strategies." The Rural Sociologist 3(4): 243-246.
Ribaudo, M., J. Agapoff, A. Cattaneo. 2003. “Can EQIP be Effective in Helping Farmers Meet Manure Management Goals?” Selected Paper at the AAEA Annual Meeting, Montreal, Canada, July 27-30, 2003.
Ribaudo, M, A. Cattaneo, and J. Agapoff. 2004. “Cost of Meeting Manure Nutrient Application Standards in Hog Production: The Roles of EQIP and Fertilizer Offsets”, Review of Agricultural Economics 26(4), Winter 2004, 430-444.
Rogers, E. M. Diffusion of Innovations. 4th ed. New York: The Free Press, 1995.
Stoneman, P. The Economics of Technological Diffusion. Oxford: Blackwell Pub. Ltd, 2002.
Traoré, N., R. Landry, and N. Amara. 1998. "On-farm Adoption of Conservation Practices: The Role of Farm and Farmer Characteristics, Perceptions, and Health Hazards." Land Econ. 74(1): 114-127. University of Georgia Cooperative Extension Service. “Participation in Farm Conservation Programs:
Table 1: Descriptive Statistics of Variables
Variable Description Mean Std. Dev.
Age Years of age 58.58 12.01
Education Categorical Variable --- --- Less than high school Category 1 0.05 --- High school graduate Base Category 0.43 --- More than high school Category 2 0.52 --- Off-farm income Categorical Variable --- ---
none Category 1 0.16 --- $0 to $9,999 Category 2 0.10 --- $10,000 to $24,999 Base Category 0.22 --- $25,000 to $49,999 Category 3 0.25 --- $50,000 to $99,999 Category 4 0.24 --- $100,000 or more Category 5 0.04 --- Water Quality Concern Concerned about water quality in county, agree = 1, disagree = 5 1.54 0.84 Policy in Five Years Expect water quality policy will be stricter in five years, agree = 1 1.69 0.91 Expand in Five Years Expect to expand livestock or acreage, yes = 1, no = 0 0.39
Livestock Livestock operation = 1, crop only = 0 0.72 Public Info Use public information and find it important, yes = 1, no = 0 0.31
Farm Sales Categorical Variable --- --- $0 to $9,999 Category 1 0.12 --- $10,000 to $99,999 Category 2 0.42 --- $100,000 to $249,999 Base Category 0.26 --- $250,000 to $499,999 Category 3 0.13 --- $500,000 or more Category 4 0.07 --- Percent Rented Proportion of total land farmed that was rented 0.34 0.35 Location Iowa = 1, Missouri = 0 0.44 ---
Dependent Variable
Aware Aware of EQIP = 1, otherwise = 0 0.53 Participate Aware of EQIP and Participate = 1, Aware but don’t participate = 0 0.36
Table 2: Results of Logit Model of EQIP Awareness (n=319)
Variable Estimate St Error Probability
Constant -0.545 0.800 0.496
Age 0.003 0.010 0.790
Education, less than high school -0.058 0.356 0.879 Education, more than high school 0.229 0.207 0.268 Off farm income (0) -0.138 0.248 0.578 Off farm income (0-9.9) 0.047 0.299 0.876 Off farm income (25-49.9) -0.014 0.202 0.945 Off farm income (50-99.9) 0.189 0.217 0.386 Off farm income (100+) 0.077 0.430 0.858 WQ concern 0.294** 0.136 0.031 Policy in Five Years -0.154 0.125 0.219 Expand in Five Years 0.477** 0.216 0.028 Livestock 0.145 0.233 0.534 Public Information 0.733*** 0.222 0.001 Farm Sales (0-9.9) -0.948*** 0.304 0.002 Farm Sales (10-99.9) -0.674*** 0.183 0.000 Farm Sales (250-499.9) 0.386 0.248 0.121 Farm Sales (500+) 1.058*** 0.365 0.004 Percent Rented -0.171 0.333 0.608 Location -0.001 0.217 0.996
Notes: ***indicates that the variable is significant at the 0.01 level ** indicates that the variable is significant at the 0.05 level and * indicates that the variable is significant at the 0.10 level.
Table 3: Results of Logit Model of EQIP
Participation (n=183)
Variable Estimate St Error Probability
Constant -3.002** 1.318 0.022
Age 0.026 0.017 0.127
Education, less than HS -0.206 0.760 0.786 Education, some college -0.056 0.419 0.893 Off farm income (0) 0.306 0.373 0.411 Off farm income (0-9.9) 0.073 0.471 0.877 Off farm income (25-49.9) 0.217 0.318 0.495 Off farm income (50-99.9) 0.455 0.368 0.216 Off farm income (100+) -0.740 0.710 0.297 WQ concern 0.139 0.223 0.532 Policy in Five Years -0.295 0.235 0.209 Expand in Five Years 0.736** 0.344 0.033 Livestock -0.465 0.361 0.193 Public Information 0.836** 0.341 0.014 Farm Sales (0-9.9) -0.539 0.679 0.428 Farm Sales (10-99.9) 0.009 0.315 0.977 Farm Sales (250-499.9) 0.196 0.358 0.584 Farm Sales (500+) 0.319 0.422 0.450 Percent Rented 0.098 0.562 0.862 Location 0.140 0.333 0.675
Notes: ***indicates that the variable is significant at the 0.01 level ** indicates that the variable is significant at the 0.05 level and * indicates that the variable is significant at the 0.10 level.