Forecasting Bank Loan Portfolio Credit Quality
Abstract
Bank failures are a result of the bank’s financial condition. A bank’s financial condition is impacted heavily by the performance of its loan portfolio. Asset quality is an important determinant of portfolio performance and improved forecasts of portfolio credit quality provide banks, their regulators, and policy makers enhanced surveillance capabilities. In this Research Note, we characterize the relationship between the WAIN Street Business Default Index (BDX) and the credit quality of loan portfolios at US banks. Our analysis shows that incorporating BDX data into regression models improves prediction accuracy of portfolio delinquency rates and charge-offs. In a majority of instances, a causality between the BDX and portfolio credit quality can be established, providing a stronger basis for forecasting. The analysis shows that there is a strong relationship between BDX data concerning very small businesses and bank loan portfolio credit quality.
Data
We use the WAIN Street Business Default Index (BDX) and its business-size based sub-indices as the predictor (independent) variable. The BDX is a monthly gauge of nationwide business defaults derived from the credit performance of nearly 18 million US businesses across all industries, geographies, and business size. The index is quoted as a seasonally adjusted annualized rate. The index inception date is December 2009. The monthly series is aggregated into a quarterly series and seasonally adjusted to remove residual seasonality for this analysis.
Business Default Index Definition
Aggregate All businesses
Solo Businesses without paid employees
E20 Businesses with 1 to 19 employees
E100 Businesses with 20 to 99 employees
E100+ Businesses with 100 or more employees
For the dependent variable, we use the delinquency rate and net charge-offs of loan portfolios of bank peer groups based on asset size. We get the non-seasonally adjusted, quarterly data starting from Q1 1991 from the Federal Reserve. The data is seasonally adjusted for this analysis. Table 5 describes the 28 dependent series.
Our final data set covers twenty-two quarters from Q1 2010 to Q2 2015.
Seasonal Adjustment
We use the Census Bureau’s X-13ARIMA-SEATS program for seasonal adjustment. We set the sensitivity for outlier detection to low1 since our analysis encompasses a brief and extraordinary period.
Data Detrending
Both the BDX and portfolio credit quality data exhibit a strong time trend. We use the Hodrick–Prescott filter2 to identify the trend component. We de-trend each value by taking the ratio of the observed value
and the trend. Hence, for the final series, values greater than/less than one indicate that the observed value is above/below trend. The Kwiatkowski–Phillips–Schmidt–Shin (KPSS) test confirms that all final series are trend stationary.
Methodology
As a compromise between managerial and academic perspectives, we fix the time horizon for this analysis at six quarters. Thus, our analysis incorporates at most six lags of any variable. We perform a pairwise analysis of each BDX predictor and portfolio credit quality dependent variable. We identify predictors for each portfolio credit quality series that improve prediction accuracy and Granger cause. All models that are not significant at the 0.05 level are discarded.
Assessing improvement in prediction accuracy
To gauge the improvement in prediction accuracy we fit two separate regression models3. The restricted
model consists solely of lags of the dependent variable. The unrestricted model includes lags of both the dependent and independent variables. We gauge improvement in prediction accuracy by comparing model standard errors. We calculate the ratio of the standard errors of the unrestricted and restricted models and consider values less than one to be an improvement since that indicates the unrestricted model has a lower standard error. Similarly, we calculate the ratio of the adjusted R-squared values of the unrestricted and restricted models and consider values greater than one to be an improvement since that indicates increased explanatory power of the unrestricted model.
Establishing causality
Granger causality determines whether a predictor time series is useful in forecasting a dependent time series based on the presence of a statistically significant relationship between the dependent variable and lagged values of the predictor variable. In other words, a variable X Granger causes variable Y if variable Y can be better predicted using the histories of both X and Y than it can be predicted using the history of Y alone. A challenge in testing for Granger causality is identifying the amount of history to incorporate – the lag order. We take a pragmatic approach and search for the smallest lag order less than or equal to six quarters at which the BDX Granger causes portfolio credit quality at the 0.05 significance level.
Results
We report both the improvement in prediction accuracy and Granger causality results in Table 4. The BDX based on very small businesses, E20 and Solo, is a good predictor of bank loan portfolio credit quality for a majority of cases. We report the best predictor for each portfolio credit quality measure and whenever
1 We set the value to which the absolute values of the outlier t-statistics are compared to as 4.
2 We use a smoothing parameter, lambda, value of 25,600 for the quarterly data which is higher than the “standard”
1,600 and in line with recent suggestions of using larger values for lambda.
the best predictor is not a very small business predictor, we additionally report the very small business predictor.
Identifying best predictors
Our goal is to forecast and hence, we use standard error rather than adjusted R-squared to choose amongst predictors. We define the best predictor to be the one that provides the greatest improvement in standard error and prefer predictors that also Granger cause. We break ties by using the p-value of the Granger causality test.
Commercial loans
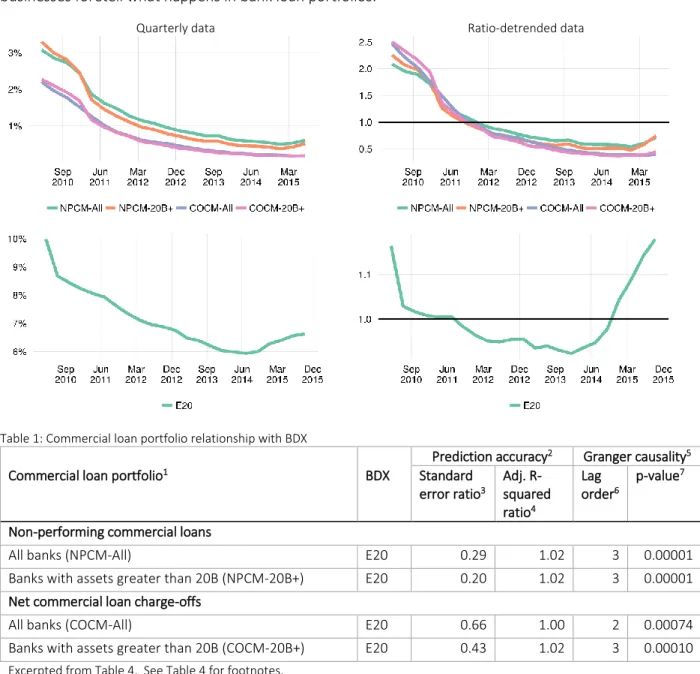
The E20 BDX substantially improves prediction accuracy and Granger causes commercial loan portfolio delinquencies and charge-offs for all banks as a group and also for the largest banks – banks with assets in excess of 20B. Consistent with practitioner experience, our analysis demonstrates that very small businesses foretell what happens in bank loan portfolios.
Quarterly data Ratio-detrended data
Table 1: Commercial loan portfolio relationship with BDX
Prediction accuracy2 Granger causality5
Commercial loan portfolio1 BDX Standard
error ratio3 Adj. R-squared ratio4 Lag order6 p-value7
Non-performing commercial loans
All banks (NPCM-All) E20 0.29 1.02 3 0.00001
Banks with assets greater than 20B (NPCM-20B+) E20 0.20 1.02 3 0.00001
Net commercial loan charge-offs
All banks (COCM-All) E20 0.66 1.00 2 0.00074
Banks with assets greater than 20B (COCM-20B+) E20 0.43 1.02 3 0.00010
Commercial real estate
The E20 and Solo BDX improve forecasts of commercial real estate (CRE) portfolio delinquencies and charge-offs. The result is intuitive. As business finances weaken, businesses falter in meeting their CRE obligations. Smaller banks are impacted later than the largest banks likely because of the local knowledge and relationships that smaller banks have with their customers.
Quarterly data Ratio-detrended data
Table 2: Commercial real estate portfolio relationship with BDX
Prediction accuracy2 Granger causality5
Commercial real estate portfolio1 BDX Standard
error ratio3 Adj. R-squared ratio4 Lag order6 p-value7 Delinquency rate
100 largest banks (CRED-100) E100 0.62 1.00 1 0.00695
100 largest banks (CRED-100) E20 0.65 1.00 1 0.00053
Non 100 largest banks (CRED-Other) Solo 0.70 1.00 5 0.01840
Charge-off rate
100 largest banks (CRECO-100) E20 0.10 1.03 3 0.00005
Non 100 largest banks (CRECO-Other) E100+ 0.43 1.00 4 0.02261
Non 100 largest banks (CRECO-Other) E20 0.45 1.01 4 0.00036
Consumer loans
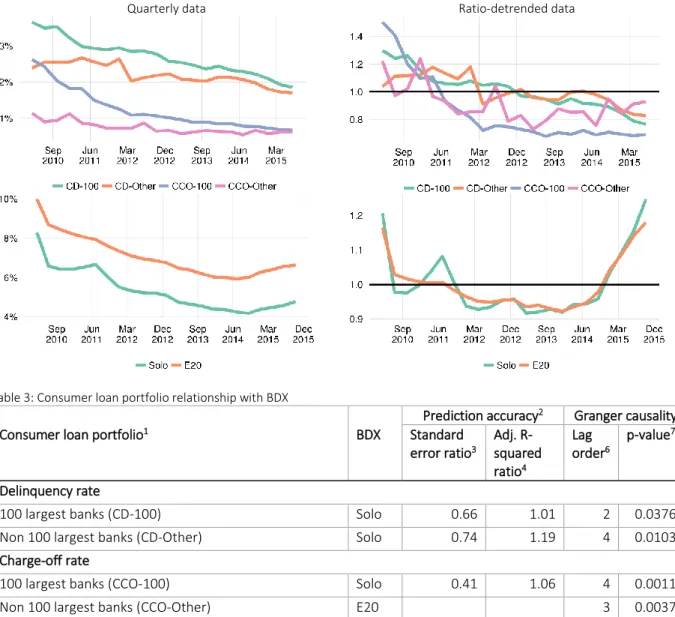
The Solo BDX Granger causes and improves prediction accuracy by over 25% for consumer loan portfolios. For the smallest banks, the E20 BDX is a net improvement as it provides new predictive power. Although, the BDX is a gauge of business credit performance, the Solo and E20 sub-indices having predictive power for consumer loan portfolios is intuitive. It reflects the real life interaction between the finances of the business and its principals. The Solo BDX tracks the credit performance of the self-employed and sole proprietors whose business and personal lives are intricately intertwined. Challenges on the business front quickly translate into personal financial challenges. Similarly, the E20 tracks the smallest of the small businesses. These businesses lack capital and often a personal guarantee is the only way to get capital. When the business suffers, the principal/guarantor suffers and a consumer default event occurs.
Quarterly data Ratio-detrended data
Table 3: Consumer loan portfolio relationship with BDX
Prediction accuracy2 Granger causality5
Consumer loan portfolio1 BDX Standard
error ratio3 Adj. R-squared ratio4 Lag order6 p-value7 Delinquency rate
100 largest banks (CD-100) Solo 0.66 1.01 2 0.03767
Non 100 largest banks (CD-Other) Solo 0.74 1.19 4 0.01039
Charge-off rate
100 largest banks (CCO-100) Solo 0.41 1.06 4 0.00111
Non 100 largest banks (CCO-Other) E20 3 0.00375
Limitations
For this Research Note, we evaluated 28 portfolio credit quality series (dependent variables) against five business default rate series (independent variables). At various points in each evaluation, we employ heuristics to automate decisions concerning model selection and other model inputs. Each technique suffers from well-known challenges. Granger causality testing is highly sensitive to the choice of lag order and tends to overfit. Lagged regression models can always benefit from additional diagnostics and tuning for outliers. We are confident of our results and happy to acknowledge that specific models could always benefit from a more robust analysis.
Conclusion
This Research Note establishes that the WAIN Street Business Default Index (BDX) has explanatory power for the credit quality of loan portfolios at US banks. We find a strong causal relationship between credit performance as gauged by the BDX and actual bank portfolio experience. A methodology incorporating BDX data improves portfolio surveillance capabilities and by leveraging monthly BDX data, early warning of forthcoming quarterly results can be obtained. As the BDX reflects macroeconomic trends, it’s inclusion into a stress testing framework can be valuable. Finally, this Research Note adds to the knowledge base of very small businesses foretelling macroeconomic trends.
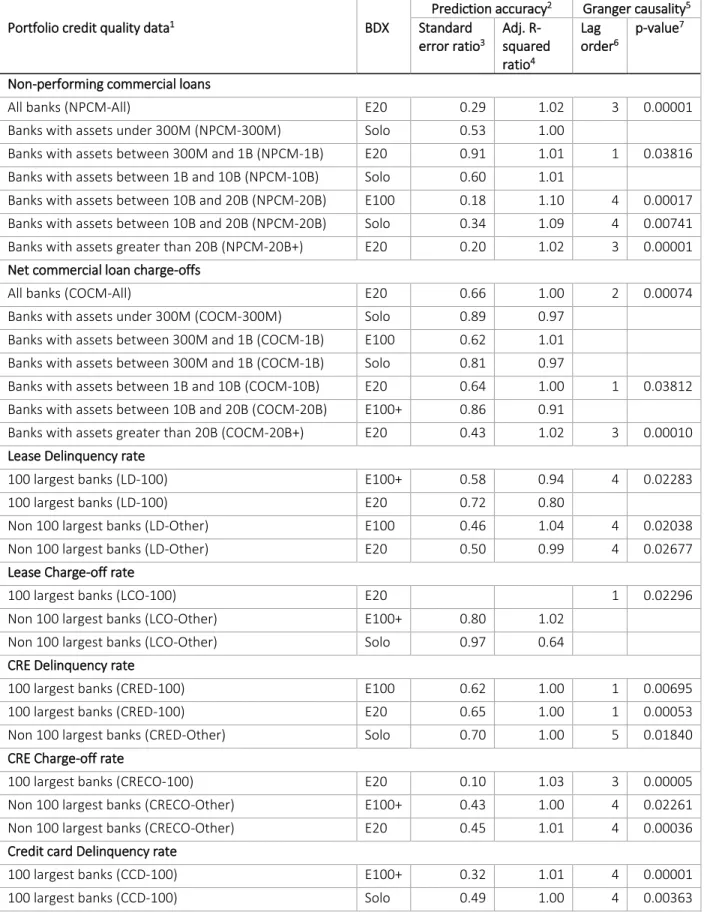
Table 4: Relationship between BDX and portfolio credit quality
Prediction accuracy2 Granger causality5
Portfolio credit quality data1 BDX Standard
error ratio3 Adj. R-squared ratio4 Lag order6 p-value7
Non-performing commercial loans
All banks (NPCM-All) E20 0.29 1.02 3 0.00001
Banks with assets under 300M (NPCM-300M) Solo 0.53 1.00
Banks with assets between 300M and 1B (NPCM-1B) E20 0.91 1.01 1 0.03816
Banks with assets between 1B and 10B (NPCM-10B) Solo 0.60 1.01
Banks with assets between 10B and 20B (NPCM-20B) E100 0.18 1.10 4 0.00017
Banks with assets between 10B and 20B (NPCM-20B) Solo 0.34 1.09 4 0.00741
Banks with assets greater than 20B (NPCM-20B+) E20 0.20 1.02 3 0.00001
Net commercial loan charge-offs
All banks (COCM-All) E20 0.66 1.00 2 0.00074
Banks with assets under 300M (COCM-300M) Solo 0.89 0.97
Banks with assets between 300M and 1B (COCM-1B) E100 0.62 1.01
Banks with assets between 300M and 1B (COCM-1B) Solo 0.81 0.97
Banks with assets between 1B and 10B (COCM-10B) E20 0.64 1.00 1 0.03812
Banks with assets between 10B and 20B (COCM-20B) E100+ 0.86 0.91
Banks with assets greater than 20B (COCM-20B+) E20 0.43 1.02 3 0.00010
Lease Delinquency rate
100 largest banks (LD-100) E100+ 0.58 0.94 4 0.02283
100 largest banks (LD-100) E20 0.72 0.80
Non 100 largest banks (LD-Other) E100 0.46 1.04 4 0.02038
Non 100 largest banks (LD-Other) E20 0.50 0.99 4 0.02677
Lease Charge-off rate
100 largest banks (LCO-100) E20 1 0.02296
Non 100 largest banks (LCO-Other) E100+ 0.80 1.02
Non 100 largest banks (LCO-Other) Solo 0.97 0.64
CRE Delinquency rate
100 largest banks (CRED-100) E100 0.62 1.00 1 0.00695
100 largest banks (CRED-100) E20 0.65 1.00 1 0.00053
Non 100 largest banks (CRED-Other) Solo 0.70 1.00 5 0.01840
CRE Charge-off rate
100 largest banks (CRECO-100) E20 0.10 1.03 3 0.00005
Non 100 largest banks (CRECO-Other) E100+ 0.43 1.00 4 0.02261
Non 100 largest banks (CRECO-Other) E20 0.45 1.01 4 0.00036
Credit card Delinquency rate
100 largest banks (CCD-100) E100+ 0.32 1.01 4 0.00001
Non 100 largest banks (CCD-Other) E20 0.36 1.11 5 0.03588 Credit Card Charge-off rate
100 largest banks (CCCO-100) E20 0.38 1.20 1 0.01501
Non 100 largest banks (CCCO-Other) E100 0.61 1.53
Non 100 largest banks (CCCO-Other) E20 0.69 1.44
Consumer Delinquency rate
100 largest banks (CD-100) Solo 0.66 1.01 2 0.03767
Non 100 largest banks (CD-Other) Solo 0.74 1.19 4 0.01039
Consumer Charge-off rate
100 largest banks (CCO-100) Solo 0.41 1.06 4 0.00111
Non 100 largest banks (CCO-Other) E20 3 0.00375
1. Table 5 describes the data.
2. Prediction accuracy is evaluated by comparing two models. The restricted model consists solely of lags of the dependent variable. The unrestricted model includes lags of both the dependent and independent variables. When blank, only an unrestricted model could be fitted and hence, the improvement is unbounded.
3. The ratio of the standard error of unrestricted model and restricted model. Values less than one indicate unrestricted model has a lower standard error.
4. The ratio of adjusted R-squared of the unrestricted model and restricted model. Values greater than one indicate unrestricted model has greater explanatory power.
5. The results are for Granger causality from the BDX to portfolio credit quality. When blank, there was no Granger causality at the 0.05 significance level.
6. Lag order at which Granger causality was tested.
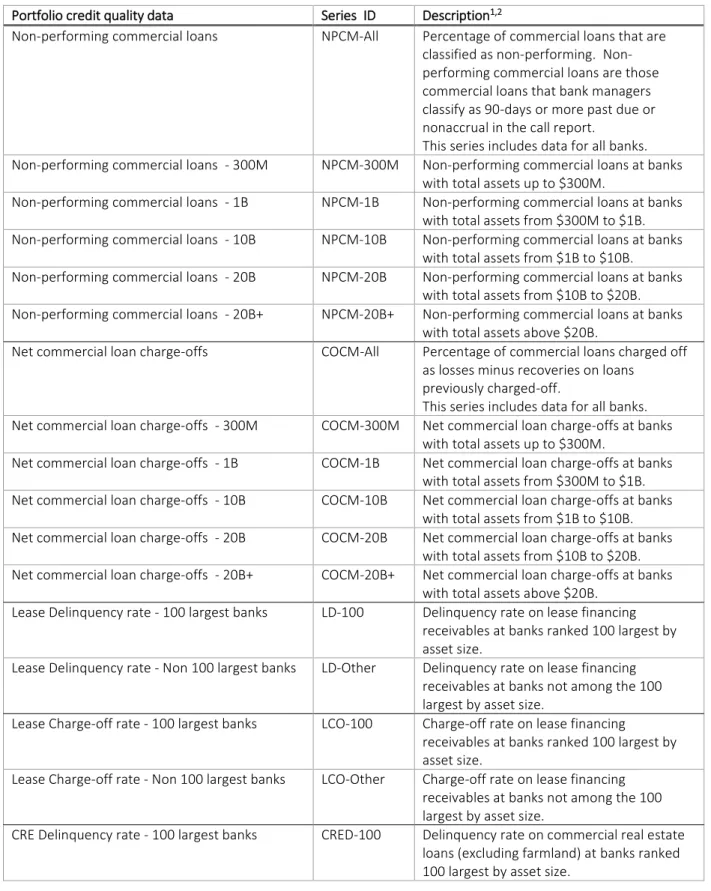
Table 5: Definition of portfolio credit quality data variables
Portfolio credit quality data Series ID Description1,2
Non-performing commercial loans NPCM-All Percentage of commercial loans that are
classified as non-performing. Non-performing commercial loans are those commercial loans that bank managers classify as 90-days or more past due or nonaccrual in the call report. This series includes data for all banks.
Non-performing commercial loans - 300M NPCM-300M Non-performing commercial loans at banks
with total assets up to $300M.
Non-performing commercial loans - 1B NPCM-1B Non-performing commercial loans at banks
with total assets from $300M to $1B.
Non-performing commercial loans - 10B NPCM-10B Non-performing commercial loans at banks
with total assets from $1B to $10B.
Non-performing commercial loans - 20B NPCM-20B Non-performing commercial loans at banks
with total assets from $10B to $20B.
Non-performing commercial loans - 20B+ NPCM-20B+ Non-performing commercial loans at banks
with total assets above $20B.
Net commercial loan charge-offs COCM-All Percentage of commercial loans charged off
as losses minus recoveries on loans previously charged-off.
This series includes data for all banks.
Net commercial loan charge-offs - 300M COCM-300M Net commercial loan charge-offs at banks
with total assets up to $300M.
Net commercial loan charge-offs - 1B COCM-1B Net commercial loan charge-offs at banks
with total assets from $300M to $1B.
Net commercial loan charge-offs - 10B COCM-10B Net commercial loan charge-offs at banks
with total assets from $1B to $10B.
Net commercial loan charge-offs - 20B COCM-20B Net commercial loan charge-offs at banks
with total assets from $10B to $20B.
Net commercial loan charge-offs - 20B+ COCM-20B+ Net commercial loan charge-offs at banks
with total assets above $20B.
Lease Delinquency rate - 100 largest banks LD-100 Delinquency rate on lease financing
receivables at banks ranked 100 largest by asset size.
Lease Delinquency rate - Non 100 largest banks LD-Other Delinquency rate on lease financing
receivables at banks not among the 100 largest by asset size.
Lease Charge-off rate - 100 largest banks LCO-100 Charge-off rate on lease financing
receivables at banks ranked 100 largest by asset size.
Lease Charge-off rate - Non 100 largest banks LCO-Other Charge-off rate on lease financing
receivables at banks not among the 100 largest by asset size.
CRE Delinquency rate - 100 largest banks CRED-100 Delinquency rate on commercial real estate
loans (excluding farmland) at banks ranked 100 largest by asset size.
CRE Delinquency rate - Non 100 largest banks CRED-Other Delinquency rate on commercial real estate loans (excluding farmland) at banks not among the 100 largest by asset size.
CRE Charge-off rate -100 largest banks CRECO-100 Charge-off rate on commercial real estate
loans (excluding farmland) at banks ranked 100 largest by asset size.
CRE Charge-off rate - Non 100 largest banks CRECO-Other Charge-off rate on commercial real estate
loans (excluding farmland) at banks not among the 100 largest by asset size.
Credit card Delinquency rate - 100 largest banks CCD-100 Delinquency rate on credit card loans at
banks ranked 100 largest by asset size. Credit card Delinquency rate - Non 100 largest
banks
CCD-Other Delinquency rate on credit card loans at
banks not among the 100 largest by asset size.
Credit Card Charge-off rate - 100 largest banks CCCO-100 Charge-off rate on credit card loans at banks
ranked 100 largest by asset size. Credit Card Charge-off rate - Non 100 largest
banks
CCCO-Other Charge-off rate on credit card loans at banks
not among the 100 largest by asset size.
Consumer Delinquency rate - 100 largest banks CD-100 Delinquency rate on other consumer loans at
banks ranked 100 largest by asset size. Consumer Delinquency rate - Non 100 largest
banks
CD-Other Delinquency rate on other consumer loans at
banks not among the 100 largest by asset size.
Consumer Charge-off rate - 100 largest banks CCO-100 Charge-off rate on other consumer loans at
banks ranked 100 largest by asset size. Consumer Charge-off rate - Non 100 largest
banks
CC0-Other Charge-off rate on other consumer loans at
banks not among the 100 largest by asset size.
1. Delinquent loans and leases are those past due thirty days or more and still accruing interest as well as those in nonaccrual status.
2. Charge-offs are the value of loans and leases removed from the books and charged against loss reserves. Charge-off rates are annualized, net of recoveries.
For more information: Vidur Dhanda Publisher WAIN Street [email protected] 413-303-9765 www.WAINStreet.com
Copyright Notices and Legal Disclaimers
The opinions expressed in this publication are for general information only and are not intended to provide or be construed as providing specific investment advice or recommendations for any entity. No content may be modified, reverse engineered, reproduced or distributed in any form by any means, or stored in a database or retrieval system, without the prior written permission of WAIN Street.
This publication is based upon information obtained from sources believed to be reliable. However, due to the possibility of human, mechanical or other error or omission, WAIN Street does not guarantee the accuracy, adequacy or completeness of the material, is not responsible for any errors or omissions therein and makes no representations or warranties as to the results to be obtained from its use. In no event shall WAIN Street be liable to any party for any direct, indirect, incidental, exemplary, compensatory, punitive, special or consequential damages, costs, expenses, legal fees, or losses in connection with any use of the content even if advised of the possibility of such damages.
© 2015 WAIN Street, LLC. All rights reserved. Redistribution, reproduction and/or photocopying in whole or in part is prohibited without written permission.