Turin Networks Inc.
Operations Documentation
Release OPS3.1.x
Publication Date: April 2007Document Number: 800-0011-OPS31 Rev. A
Node Operations and
Maintenance Guide
FCC Compliance
This equipment has been tested and found to comply with the limits for a Class A digital device, pursuant to
Part 15 of the FCC Rules. This equipment generates, uses, and can radiate radio frequency energy and, if not
installed and used in accordance with the installation instructions may cause harmful interference to radio
communications.
Canadian Compliance
This Class A digital apparatus meets all requirements of the Canadian Interference-Causing Equipment
Regulations. Cet appareil numérique de la classe A respects toutes les exigences du Règlement sur le
matériel brouilleur du Canada.
Japanese Compliance
This is a Class A product based on the standard of the Voluntary Control Council for Interference by
Information Technology Equipment (VCCI). If this equipment is used in a domestic environment, radio
disturbance may occur, in which case, the user may be required to take corrective actions.
International Declaration of Conformity
We, Turin Networks, Inc. declare under our sole responsibility that the Traverse platform (models: Traverse
2000, Traverse 1600, and Traverse 600) to which this declaration relates, is in conformity with the following
standards:
EMC Standards
EN55022
EN55024
CISPR-22
Safety Standards
EN60950
CSA 22.2 No. 60950, ASINZS 3260
IEC 60950 Third Edition. Compliant with all CB scheme member country deviations.
Following the provisions of the EMC Directive 89/336/EEC of the Council of the European Union.
Copyright © 2007 Turin Networks, Inc.
All rights reserved. This document contains proprietary and confidential information of Turin Networks,
Inc., and may not be used, reproduced, or distributed except as authorized by Turin Networks. No part of this
publication may be reproduced in any form or by any means or used to make any derivative work (such as
translation, transformation or adaptation) without written permission from Turin Networks, Inc.
Turin Networks reserves the right to revise this publication and to make changes in content from time to time
without obligation on the part of Turin Networks to provide notification of such revision or change. Turin
Networks may make improvements or changes in the product(s) described in this manual at any time.
Turin Networks Trademarks
Turin Networks, the Turin Networks logo, Traverse, TraverseEdge, TransAccess, TransNav, and Creating
The Broadband Edge are trademarks of Turin Networks, Inc. or its affiliates in the United States and other
countries. All other trademarks, service marks, product names, or brand names mentioned in this document
are the property of their respective owners.
Government Use
Use, duplication, or disclosure by the U.S. Government is subject to restrictions as set forth in FAR 12.212
(Commercial Computer Software-Restricted Rights) and DFAR 227.7202 (Rights in Technical Data and
Computer Software), as applicable.
N
ODE
O
PERATIONS
AND
M
AINTENANCE
G
UIDE
Contents
About this Document . . . iii Section 1 Fault Management
Chapter 1
Managing Alarms and Events . . . 1-1 Chapter 2
Alarms, Events, and Recommended Actions . . . 1-19 Chapter 3
TransNav GUI Service Error Codes . . . 1-105 Section 2 Performance Monitoring
Chapter 1
Managing Performance . . . 2-1 Chapter 2
SONET Performance Parameters. . . 2-17 Chapter 3
SDH Performance Parameters . . . 2-35 Chapter 4
Ethernet Performance Parameters . . . 2-55 Section 3 Equipment LED Status
Chapter 1
LEDs and Module Status. . . 3-1 Section 4 Diagnostics
Chapter 1
Diagnostics Overview . . . 4-1 Chapter 2
Traverse Transmit and Receive Signal Levels . . . 4-3 Chapter 3
TraverseEdge 100 Transmit and Receive Signal Levels . . . 4-7 Chapter 4
Loopback Tests . . . 4-9 Chapter 5
Other Diagnostics . . . 4-21 Section 5 Test Access
Chapter 1
Traverse Test Access . . . 5-1 Chapter 2
Traverse Test Access Guidelines for the Spirent BRTU Interface . . . 5-23 Section 6 Routine Maintenance
Node Operations and Maintenance Guide
Page ii Turin Networks Release OPS3.1.x
Routine Maintenance. . . 6-1 Chapter 2
Node Database Backup and Restore . . . 6-23 Section 7 Software Upgrades
Chapter 1
Release TR2.1.x Traverse Software Upgrade. . . 7-1 Chapter 2
Release 3.0.x TE-100 System Software Upgrade . . . 7-49 Section 8 Hardware Upgrades
Chapter 1
Replacing Existing Traverse Hardware . . . 8-1 Chapter 2
Upgrade to a Traverse Front Inlet Fan Tray . . . 8-37 Section 9 Appendices
Appendix A
Module Placement Planning and Guidelines . . . 9-1 Appendix B
Traverse SNMP v1/v2c Agent and MIBs . . . 9-21
Node Operations and Maintenance [OPS3.1.x] Document Description
About this Document
Introduction
This description contains the following documentation topics:
■
Traverse System Product Documentation, page iv
■
TraverseEdge System Product Documentation, page v
■
TransNav Management System Product Documentation, page vi
■
Operations Documentation, page vii
■
Information Mapping, page vii
■
If You Need Help, page vii
Traverse System Product Documentation
Page iv Turin Networks Release OPS3.1.x
Traverse
System
Product
Documentation
The Traverse
®system product documentation set includes the documents described in
the table below.
Table 1 Traverse System Product Documentation
Document Description Target Audience
Traverse Product Overview
This document provides a detailed overview of the Traverse system. It also includes engineering and planning information.
Anyone who wants to understand the Traverse system and its applications. Traverse
Installation and Configuration
This document provides required equipment, tools, and step-by-step procedures for:
■ Hardware installation
■ Power cabling
■ Network cabling
■ Node power up
■ Node start-up
Installers, field, and network engineers
Traverse Provisioning
This document provides step-by-step procedures for provisioning a network of Traverse nodes using the TransNav management system. See the TransNav Management System Product Documentation.
Network engineers, provisioning, and net-work operations center (NOC) personnel
TraverseEdge System Product Documentation
TraverseEdge
System
Product
Documentation
The TraverseEdge™ 100 User Guide includes the sections described in the table below.
Table 2 TraverseEdge 100 System Product Documentation
Section Description Target Audience
Product Overview This section provides a detailed overview of the TraverseEdge system.
Anyone who wants to understand the Traver-seEdge system and its applications
Description and Specifications
This section includes engineering and planning infor-mation.
Field and network engi-neers
Installation and Configuration
This document identifies required equipment and tools and provides step-by-step procedures for:
■ Hardware installation
■ Power cabling
■ Network cabling
■ Node power up
■ Node start-up
Installers, field, and network engineers
Provisioning the Network
This section provides step-by-step procedures for provisioning a TraverseEdge network using the Tran-sNav management system. Also see the TranTran-sNav Management System Product Documentation.
Network engineers, provisioning, and net-work operations center (NOC) personnel Configuring
Equip-ment
This section provides step-by-step procedures for configuring module and interface parameters of a TraverseEdge using the TransNav management sys-tem. Also see the TransNav Management System Product Documentation.
Network engineers, provisioning, and net-work operations center (NOC) personnel Creating TDM
Ser-vices
This section provides step-by-step procedures for provisioning a TraverseEdge network using the Tran-sNav management system. Also see the TranTran-sNav Management System Product Documentation.
Network engineers, provisioning, and net-work operations center (NOC) personnel Creating Ethernet
Services
This section provides step-by-step procedures for provisioning a TraverseEdge network using the Tran-sNav management system. See the TranTran-sNav Man-agement System Product Documentation.
Network engineers, provisioning, and net-work operations center (NOC) personnel Appendices This section provides installation and provisioning
checklists, compliance information, and acronym descriptions.
Installers and anyone who wants reference information.
TransNav Management System Product Documentation
Page vi Turin Networks Release OPS3.1.x
TransNav
Management
System
Product
Documentation
The TransNav™ management system product documentation set includes the
documents described in the table below.
Table 3 TransNav Management System Product Documentation
Document Description Target Audience
TransNav Man-agement System Product Overview
This document provides a detailed overview of the TransNav management system.
This document includes hardware and software requirements for the management system. It also includes network management planning information.
Anyone who wants to understand the Tran-sNav management sys-tem
TransNav Man-agement System Server Guide
This document describes the management server com-ponent of the management system and provides proce-dures and troubleshooting information for the server.
Field and network engi-neers, provisioning, and network opera-tions center (NOC) personnel TransNav
Man-agement System GUI Guide
This document describes the graphical user interface including installation instructions and logon proce-dures.
This document describes every menu, window, and screen a user sees in the graphical user interface. TransNav
Man-agement System CLI Guide
This document includes a quick reference to the com-mand line interface (CLI). Also included are compre-hensive lists of both the node-level and domain-level CLI commands.
TransNav Man-agement System TL1 Guide
This document describes the syntax of the TL1 lan-guage in the TransNav environment.
This document also defines all input commands and expected responses for retrieval commands as well as autonomous messages that the system outputs due to internal system events.
Operations Documentation
Operations
Documentation
The document below provides operations and maintenance information for Turin’s
TransNav managed products.
Information
Mapping
Traverse, TransNav, and TraverseEdge 100 system documentation uses the Information
Mapping format which presents information in small units or blocks. The beginning of
an information block is identified by a subject label in the left margin; the end is
identified by a horizontal line. Subject labels allow the reader to scan the document and
find a specific subject. Its objective is to make information easy for the reader to
access, use, and remember.
Each procedure lists the equipment and tools and provides step-by-step instructions
required to perform each task. Graphics are integrated into the procedures whenever
possible.
If You Need
Help
If you need assistance while working with Traverse products, contact the Turin
Networks Technical Assistance Center (TAC):
■
Inside the U.S., toll-free: 1-866-TURINET (1-866-887-4638)
■
Outside the U.S.: 916-348-2105
■
Online:
www.turinnetworks.com/html/support_assistance.htm
TAC is available 6:00AM to 6:00PM Pacific Time, Monday through Friday (business
hours). When the TAC is closed, emergency service only is available on a callback
basis. E-mail support (24-hour response) is also available through:
.
Table 4 Operations Documentation
Document Description Target Audience
Node Operations and Maintenance
This document identifies required equipment and tools. It also provides step-by-step procedures for:
■ Alarms and recommended actions
■ Performance monitoring
■ Equipment LED and status
■ Diagnostics
■ Test access (SONET network only)
■ Routine maintenance
■ Node software upgrades
■ Node hardware upgrades
Field and network engineers
Calling for Repairs
Page viii Turin Networks Release OPS3.1.x
Calling for
Repairs
If repair is necessary, call the Turin Repair Facility at 1-866-TURINET (866-887-4638)
for a Return Material Authorization (RMA) number before sending the unit. The RMA
number must be prominently displayed on all equipment cartons. The Repair Facility is
open from 6:00AM to 6:00PM Pacific Time, Monday through Friday.
When calling from outside the United States, use the appropriate international access
code, and then call 916-348-2105 to contact the Repair Facility.
When shipping equipment for repair, follow these steps:
1.
Pack the unit securely.
2.
Enclose a note describing the exact problem.
3.
Enclose a copy of the invoice that verifies the warranty status.
4.
Ship the unit PREPAID to the following address:
Turin Networks, Inc.
Turin Repair Facility
Attn: RMA # ________
1415 North McDowell Blvd.
Petaluma, CA 94954 USA
S
ECTION
1 F
AULT
M
ANAGEMENT
SECTION 1SYSTEM MONITORING SECTION 1
Contents
Chapter 1
Managing Alarms and Events
Introduction . . . 1-1 Events . . . 1-1 Alarms . . . 1-1 Event Types . . . 1-2 Provisioning events . . . 1-2 Performance events . . . 1-2 Security events . . . 1-2 Normal operational events. . . 1-2 Fault events (alarms). . . 1-2 Event Logs . . . 1-2 Events Tab . . . 1-3 Alarms Tab . . . 1-4 Network Alarm Summary Window. . . 1-5 Service Affecting Status . . . 1-5 Alarm Severity Levels . . . 1-5 Alarm Hierarchy. . . 1-6 Customizing Alarms . . . 1-6 Alarm Profiles . . . 1-6 Sort by Column . . . 1-6 Creating a New Alarm Profile . . . 1-7 Assigning an Alarm Profile . . . 1-9 Assigning a Port Alarm Profile. . . 1-9 Assigning a Subport Alarm Profile. . . 1-10 Assigning a Service Path Alarm Profile. . . 1-10 Suppressing Alarms . . . 1-12 Suppress Port Alarms . . . 1-12 Service CTP Path Alarm Suppression . . . 1-13 Viewing Alarms . . . 1-15 Alarm Tallies . . . 1-15 Detail View. . . 1-15 Map View Display . . . 1-16 New Window . . . 1-16 Print . . . 1-16 Save . . . 1-16 Set Filters . . . 1-17 Sort by Column . . . 1-17 StickyMode . . . 1-18
Node Operations and Maintenance Guide, Section 1 Fault Management
Page viii Turin Networks Release OPS3.1.x
Chapter 2
Alarms, Events, and Recommended Actions
Introduction . . . 1-19 Alarms/Events, A through C . . . 1-20 Alarms/Events, D through K . . . 1-37 . . . 1-56 Alarms/Events, L through S . . . 1-57 Alarms/Events, TA200 . . . 1-91 Alarms/Events, TB through TZ . . . 1-92 Alarms/Events U through Z . . . 1-99 Chapter 3
TransNav GUI Service Error Codes
Introduction . . . 1-105 Service Activation Failure . . . 1-106 TransNav GUI Service Error Codes . . . 1-107
List of Figures
Figure 1-1 Map View, Events Tab. . . 1-3 Figure 1-2 Alarms Tab . . . 1-4 Figure 1-3 Network Alarm Summary Window . . . 1-5 Figure 1-4 Alarm Profile Dialog Box . . . 1-6 Figure 1-5 Alarm Profiles Dialog Box . . . 1-7 Figure 1-6 Alarm Profile Dialog Box . . . 1-8 Figure 1-7 Service Tab . . . 1-10 Figure 1-8 Path Display for Services Screen . . . 1-11 Figure 1-9 Service Tab . . . 1-13 Figure 1-10 Path Display for Services Screen . . . 1-14 Figure 1-11 Alarm Filter Dialog Box . . . 1-17 Figure 1-12 Hardware Fault Detection Descriptions . . . 1-55 Figure 1-13 TransNav GUI Service Request Error Window . . . 1-105 Figure 1-14 Service Request Failure . . . 1-106 Figure 1-15 Services Menu—Show Last Error Option . . . 1-106
List of Tables
Table 1-1 Creating a New Alarm Profile . . . 1-7 Table 1-2 Assigning a Port Alarm Profile . . . 1-9 Table 1-3 Assigning a Subport Alarm Profile . . . 1-10 Table 1-4 Assigning a Service Path Alarm Profile . . . 1-10 Table 1-5 Suppress Port Alarms . . . 1-12 Table 1-6 Suppress Service CTP Path Alarms . . . 1-13 Table 1-7 Viewing Alarms . . . 1-15 Table 1-8 Alarms, Events and Recommended Actions, A through C . . . 1-20 Table 1-9 Alarms, Events and Recommended Actions, D through K . . . 1-37
Node Operations and Maintenance Guide, Section 1 Fault Management
Table 1-10 Alarms, Events and Recommended Actions, L through S . . . 1-57 Table 1-11 Alarms, Events and Recommended Actions, TA200 . . . 1-91 Table 1-12 Alarms, Events and Recommended Actions, TB through TZ . . . . 1-92 Table 1-13 Alarms, Events and Recommended Actions, U through Z . . . 1-99 Table 1-14 Service Request—Show Last Error . . . 1-106 Table 1-15 Service Error Codes and Recommended Actions. . . 1-107
Node Operations and Maintenance Guide, Section 1 Fault Management
SECTION 1FAULT MANAGEMENT
Chapter 1
Managing Alarms and Events
Introduction
During normal operation of the Turin product family, various conditions may arise that
require attention by network operations. Events and alarms alert you to system
operational changes.
Events
Events (other than alarm fault events) are state-less alerts indicating configuration
changes, operator actions, performance changes, and other standard operations.
Alarms
Alarms are
fault events
indicating abnormal single-state or multi-state conditions
requiring system operator attention. A single-state condition example is a hardware
device failure. The hardware device is either in the failed condition or not. Each alarm
is characterized by alarm severity, service affecting status, and whether the alarm is
active
or
clear
. If a condition persists, the alarm is
active
. If the fault condition is
resolved, either automatically or by operator action, the alarm is
clear
.
This chapter provides information on:
■
Event Types, page 1-2
■
Event Logs, page 1-2
■
Events Tab, page 1-3
■
Alarms Tab, page 1-4
■
Network Alarm Summary Window, page 1-5
■
Customizing Alarms, page 1-6
■
Suppressing Alarms, page 1-12
■
Viewing Alarms, page 1-15
For management system reference, see the TransNav Management System GUI Guide,
Section 8—
Maintenance and Testing
, Chapter 2—“Alarms.”
Contact the Turin Technical Assistance Center if you need assistance while working
with this product.
Node Operations and Maintenance Guide, Section 1: Fault Management
Event Types
Page 1-2 Turin Networks Release OPS3.1.x
Event Types
Events alert the operator to changes to the system. Each of these changes are logged
and can be any one of the following event types:
Provisioning events.
The node has made a change to its configuration in response to
a request from a management entity.
Performance events.
The value of a Performance Management (PM) parameter has
crossed a provisioned threshold. This threshold crossing alert (TCA) may indicate
service deterioration and require operator attention.
Security events.
A user has logged in or out of the node, an attempted login has
failed, or a user has made some change to the user account database.
Normal operational events.
Normal and expected occurrences, such as initialization
completed or control plane connection established with other nodes. They are logged
for information only.
Fault events (alarms).
Fault conditions that may affect service and require operator
attention. Fault events generate and clear
alarms
. The system raises an alarm when it
first detects a fault condition. While the fault condition persists, the alarm is
active
.
When the system detects that a fault condition no longer exists, it
clears
the alarm. The
clearing may be automatic or a result of an operator action (e.g., replacing a bad
module).
Event Logs
All events (including alarm fault events) are logged on either the Traverse General
Control Module (GCM) or TraverseEdge 100 System module. The events logged are
not persistent—reboots clear the logs. For user-accessible, longer-term secure storage,
an Event Log is stored on the TransNav server. This log provides easy access to
information about recent events.
Included in the TransNav server Event Log is the following information:
■
Type of event (configuration, fault, performance, and security)
■
Timestamp
■
Component or subsystem detecting the event
■
Descriptive text about the event
The Event Log maintains a configurable number of events for a specified length of
time. The oldest events are deleted after the limit has been reached; the default is 30
days. This length of time is also configurable.
Turin recommends performing regular backups of the log files. One way to accomplish
this is to use the Report Scheduler and set up a regularly generated report on events. For
details, see the TransNav Management System GUI Guide, Section 2—
Administrative
Chapter 1 Managing Alarms and Events
Events Tab
Events Tab
The TransNav GUI Events tab displays a list of events for the user to quickly view and
analyze state-less alerts.
Node Operations and Maintenance Guide, Section 1: Fault Management
Alarms Tab
Page 1-4 Turin Networks Release OPS3.1.x
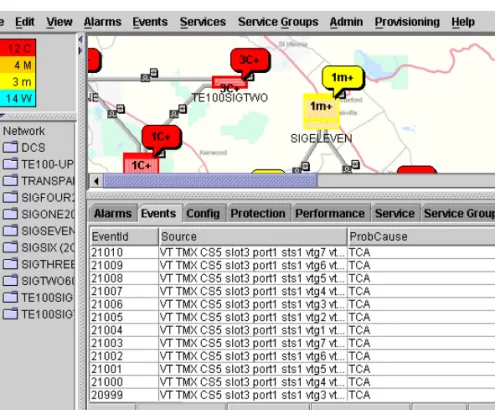
Alarms Tab
The TransNav GUI Alarms tab displays a list of alarms for the user to quickly view,
analyze, and resolve fault conditions.
If a node is in an alarm state, it will be displayed on the Map View node object in the
color of the highest level alarm severity with a caption indicating the number and type
of alarm. For example, in Figure 1-2, the node TE100SIGTWO has four critical (4C)
alarms, so it is colored red with the caption 4C.
For alarms tab definitions, refer to:
■
Customizing Alarms, page 1-6
■
Alarm Severity Levels, page 1-5
■
Alarm Hierarchy, page 1-6
Figure 1-2 Alarms Tab StickyMode Detail View Set Filters New Window Command Command Command Print Command Save Command View Selector Sort by Column Map View Alarm Caption Node Object Alarms Display List Alarm Tab
Chapter 1 Managing Alarms and Events
Alarm Severity Levels
Network Alarm
Summary
Window
The TransNav network alarm summary window shows counts of outstanding Critical
(C), Major (M), Minor (m) alarms, and Warnings (W).
Figure 1-3 Network Alarm Summary Window
Service
Affecting
Status
Two levels of service affecting status are used in the alarm definitions:
■
Service Affecting (SA): Indicates that a service affecting condition has occurred
and an immediate corrective action is required.
■
Non-Service Affecting (NSA): Indicates that a non-service affecting condition
has occurred.
Service affecting alarms apply when protection is not available. This same alarm is
considered non-service affecting if the equipment or facility is protected and
configured using automatic protection switching—APS (multiplex section
protection—MSP) mode. Alarms listed as non-service affecting do not affect service
regardless of equipment or facility protection scheme.
Alarm Severity
Levels
Some alarms are always service affecting, some are always non-service affecting, and
some can be either, depending on the circumstances. Alarms on
unprotected
equipment
or facilities are, by default, always critical. However, this same alarm is not considered
critical if the equipment or facility is
protected
and configured using APS (MSP).
Alarms listed as minor or warning are not considered service affecting regardless of the
protection scheme.
The following severity levels, from the most severe to the least severe, are defined and
used in the alarm and event definitions:
■
Critical (red): A severe, service affecting condition has occurred. Immediate
corrective action is imperative, regardless of the time of the day or day of the week.
■
Major (orange): A hardware or software condition has occurred that indicates a
serious disruption of service or the malfunctioning or failure of important circuits.
This requires the immediate attention and response of a technician to restore or
maintain system capability. The urgency is less than in critical situations because of
a lesser immediate or impending effect on service or system performance.
■
Minor (yellow): Trouble has occurred that does not have a serious affect on
service to customers, or trouble in circuits has occurred that is not essential to node
operation. Corrective action should be taken in order to prevent a more serious
fault.
Node Operations and Maintenance Guide, Section 1: Fault Management
Alarm Hierarchy
Page 1-6 Turin Networks Release OPS3.1.x
■
Warning (cyan): A potential or impending service affecting event may occur; no
significant effects have been felt. Action should be taken to further diagnose, if
necessary, and correct the problem in order to prevent it from becoming a more
serious fault.
In general, severity levels of Critical, Major, Minor, and Warning are reported to the
Alarms and Events tabs in the GUI. A severity level of Info is reported to the Events
tab only.
Alarm
Hierarchy
This system conforms to the alarm reporting hierarchy set forth in the Telcordia
General Requirements GR-253, ETSI 300-417-3-1, and ITU recommendation G.783.
Customizing
Alarms
The TransNav GUI provides functions for creating new, modifying default, and
assigning alarm profiles in order to customize alarm parameter settings (e.g., severity
level) based on your network requirements. Refer to the following topics:
■
Alarm Profiles, page 1-6
■
Creating a New Alarm Profile, page 1-7
■
Assigning a Port Alarm Profile, page 1-9
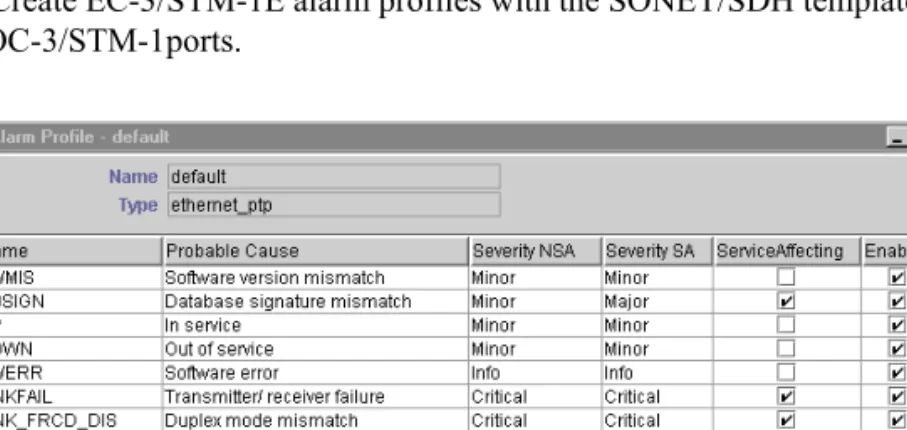
Alarm Profiles
Alarm profiles allow the user to customize alarms based on severity, service affecting
status, and whether to enable or disable (suppress) alarm generation.
Note:
Create EC-3/STM-1E alarm profiles with the SONET/SDH templates, like that
for the OC-3/STM-1ports.
Sort by Column
Click a column heading to sort the alarms by that category. The Name and Probable
Cause columns can be sorted in alphabetical or reverse alphabetical order. The
Severity NSA and Severity SA columns can be sorted in ascending or descending
severity. The ServiceAffecting and Enabled columns can be sorted by select/clear.
Click the column heading again to switch from one sorting category to the other.
Chapter 1 Managing Alarms and Events
Creating a New Alarm Profile
Creating a New
Alarm Profile
The following procedure describes how to create an Alarm Profile template.
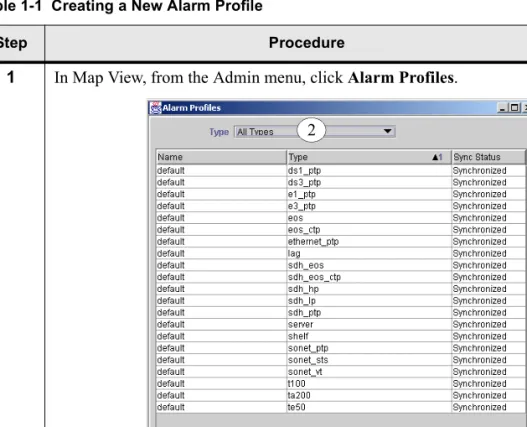
Table 1-1 Creating a New Alarm Profile
Step Procedure
1
In Map View, from the Admin menu, click Alarm Profiles.
Figure 1-5 Alarm Profiles Dialog Box
Node Operations and Maintenance Guide, Section 1: Fault Management
Creating a New Alarm Profile
Page 1-8 Turin Networks Release OPS3.1.x
2
From the Type drop-down list, select the type of alarm profile you want to
create:
■
ds1_ptp: SONET DS1 port
■
ds3_ptp: SONET DS3/EC1 ports (previously called ds_ptp)
■
e1_ptp: SDH E1 port
■
e3_ptp: SDH E3 port
■
eos: SONET EOS port
■
eos_ctp: SONET EOS connection termination point.
■
ethernet_ptp: Ethernet port
■
lag: (Ethernet) Link aggregated group
■
sdh_eos: SDH EOS port
■
sdh_eos_ctp: SDH EOS connection termination point
■
sdh_hp: SDH high order path (VC4 or VC3)
■
sdh_lp: SDH VC3 low order path
■
sdh_ptp: SDH port
■
server: TransNav server platform
■
shelf: Traverse or TraverseEdge node
(Planned for future release.)
■
sonet_ptp: SONET port
■
sonet_sts: SONET STS path
■
sonet_vt: SONET VT path
■
t100: TransAccess 100 Mux
■
ta200: TransAccess 100 Mux
3
Click Add to view the alarm profile, then enter a Name for the alarm
profile. The example shown below is an ethernet_ptp alarm profile with
default values.
Figure 1-6 Alarm Profile Dialog Box Table 1-1 Creating a New Alarm Profile (continued)
Step Procedure
Chapter 1 Managing Alarms and Events
Assigning a Port Alarm Profile
Assigning an
Alarm Profile
Choose one of the following topics by object type (e.g., port) to assign an alarm profile:
■
Assigning a Port Alarm Profile, page 1-9
■
Assigning a Subport Alarm Profile, page 1-10
■
Assigning a Service Path Alarm Profile, page 1-10
Assigning a
Port Alarm
Profile
The following procedure describes how to assign a port alarm profile template to a port.
4
To modify the alarm entry settings, make a selection from the drop-down
list or check the box in the row of the following columns:
■
Severity NSA: Alarm severity when it is non-service affecting.
■
Severity SA: Alarm severity when it is service affecting; this severity
only applies if ServiceAffecting is selected.
■
ServiceAffecting: Select to make the alarm service affecting. Clear
the checkbox to make the alarm non-service affecting.
■
Enabled: Select to enable the alarm. Clear to disable the alarm.
Click OK. A user prompt appears.
5
Click Yes to synchronize the alarm profile to make it available to other
nodes. Click No if you do not want to synchronize the new template.
6
Click Done in the Alarm Profiles dialog box.
7
The Creating a New Alarm Profile procedure is complete.
Table 1-1 Creating a New Alarm Profile (continued)
Step Procedure
Table 1-2 Assigning a Port Alarm Profile
Step Procedure
1
In Shelf View, select a module port (or a TransAccess 100 Mux).
2
Click the Config tab.
3
From the Alarm Profiles list, select a port (
ptp) alarm profile template.
4
Click Apply.
Node Operations and Maintenance Guide, Section 1: Fault Management
Assigning a Subport Alarm Profile
Page 1-10 Turin Networks Release OPS3.1.x
Assigning a
Subport Alarm
Profile
The following procedure describes how to assign a port alarm profile template to a DS3
Transmux subport.
Assigning a
Service Path
Alarm Profile
The following procedure describes how to assign a path alarm profile template to a
service connection termination point (CTP) within an end-to-end transport path.
Table 1-3 Assigning a Subport Alarm Profile
Step Procedure
1
In Shelf View, select a DS3 Transmux module port.
2
Click the Config tab.
3
From the Subport row, Alarm Profile column list, select a port (ptp)
alarm profile template matching the embedded signal subport type (e.g.,
ds1_ptp).
4
Click Apply
.
5
The Assigning a Subport Alarm Profile procedure is complete.
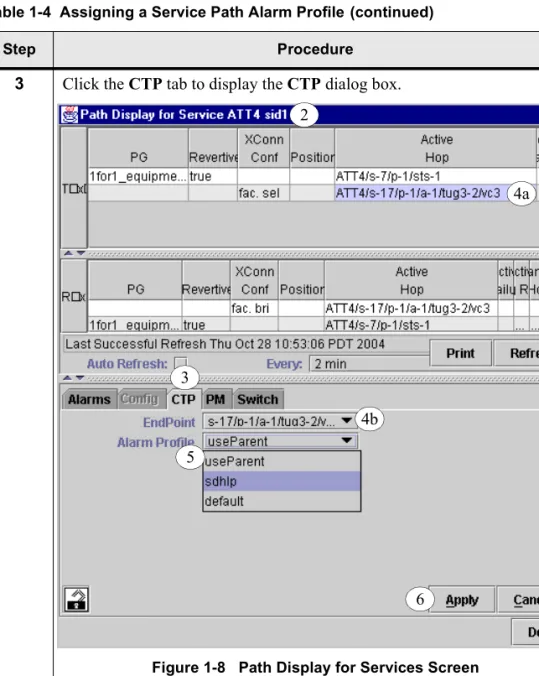
Table 1-4 Assigning a Service Path Alarm Profile
Step Procedure
1
From any view, click the Service tab.
Figure 1-7 Service Tab
2
Select a service. Right-click and select the Show Tx/Rx Path option to
display the Path Display for Services screen.
2
Chapter 1 Managing Alarms and Events
Assigning a Service Path Alarm Profile
3
Click the CTP tab to display the CTP dialog box.
Figure 1-8 Path Display for Services Screen
4
From the Path Display for Service screen, Tx or Rx table row, select an
Active Hop (4a). Your selection is placed in the EndPoint field of the
CTP screen (4b).
Table 1-4 Assigning a Service Path Alarm Profile (continued)
Step Procedure
3
2
4a
4b
5
6
Node Operations and Maintenance Guide, Section 1: Fault Management
Suppressing Alarms
Page 1-12 Turin Networks Release OPS3.1.x
Suppressing
Alarms
The TransNav GUI provides an alarm suppression function through the administrative
state of an object. When the administrative state of a containing object is set to suppress
alarms, then any object contained within obeys the parent object without consideration
of its own current administrative state.
Refer to the following topics:
■
Suppress Port Alarms, page 1-12
■
Service CTP Path Alarm Suppression, page 1-13
Suppress Port
Alarms
The following procedure describes how to suppress port (line and path) alarms. Alarm
suppression occurs also for all objects contained within the port.
5
From the Alarm Profile list, select one of the following profile values:
■
useParent: The alarm profile of the containing object (Parent) based
on the following (superset and subset) definitions:
–
Port: Contains line and path alarms and is the superset.
–
High-order path: Contains high- and low-order path alarms and is
a subset of port profiles.
–
Low-order path: Contains only low-order path alarms and is a
finer subset of high-order path profiles.
–
STS path. Contains STS and VT path alarms and is a subset of
port profiles.
–
VT path: Contains only VT path alarms and is a finer subset of
STS path profiles.
■
default: The
default
alarm profile matching the CTP object type.
■
<
user-defined
>: Depending on the CTP object type, a user-defined
alarm profile of one of the following path alarm profile types:
–
sdh_hp
–
sdh_lp
–
sonet_sts
–
sonet_vt
6
Click Apply
.
7
The Assigning a Service Path Alarm Profile procedure is complete.
Table 1-4 Assigning a Service Path Alarm Profile (continued)
Step Procedure
Table 1-5 Suppress Port Alarms
Step Procedure
1
In Shelf View, select the module port.
Chapter 1 Managing Alarms and Events
Service CTP Path Alarm Suppression
Service CTP
Path Alarm
Suppression
The following procedure describes how to suppress service CTP (connection
termination point) path alarms.
3
Click the Lock icon
at the bottom left portion of the screen to change
the administrative state to locked and
click
Apply.
4
The Suppress Port Alarms procedure is complete.
Table 1-5 Suppress Port Alarms (continued)
Step Procedure
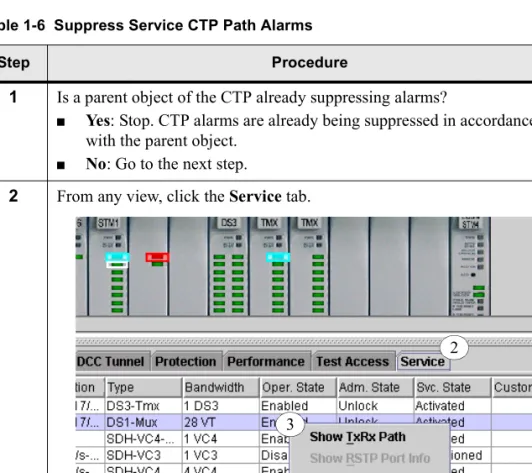
Table 1-6 Suppress Service CTP Path Alarms
Step Procedure
1
Is a parent object of the CTP already suppressing alarms?
■
Yes: Stop. CTP alarms are already being suppressed in accordance
with the parent object.
■
No: Go to the next step.
2
From any view, click the Service tab.
Figure 1-9 Service Tab
3
Node Operations and Maintenance Guide, Section 1: Fault Management
Service CTP Path Alarm Suppression
Page 1-14 Turin Networks Release OPS3.1.x
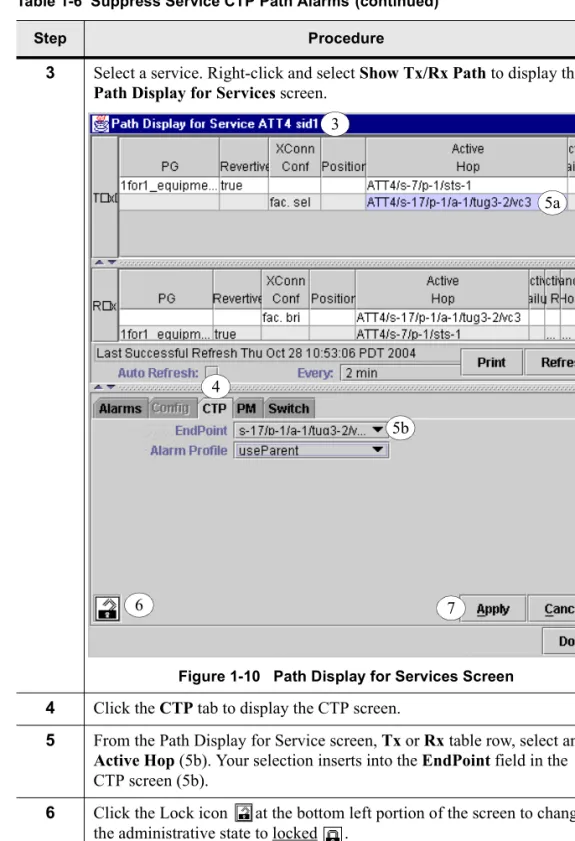
3
Select a service. Right-click and select Show Tx/Rx Path to display the
Path Display for Services screen.
Figure 1-10 Path Display for Services Screen
4
Click the CTP tab to display the CTP screen.
5
From the Path Display for Service screen, Tx or Rx table row, select an
Active Hop (5b). Your selection inserts into the EndPoint field in the
CTP screen (5b).
6
Click the Lock icon
at the bottom left portion of the screen to change
the administrative state to locked
.
7
Click Apply
.
8
The Suppress Service CTP Path Alarms procedure is complete.
Table 1-6 Suppress Service CTP Path Alarms (continued)
Step Procedure
4
3
5a
5b
6
7
Chapter 1 Managing Alarms and Events
Viewing Alarms
Viewing
Alarms
The TransNav GUI displays alarm information for the user to view, analyze, and
resolve fault conditions quickly. The alarms shown can be for different levels of object
granularity: all nodes, one node, a module, a port, or a service connection termination
point (CTP) within an end-to-end transport path.
The following procedure describes how to view alarms per callout item in Figure 1-2.
Table 1-7 Viewing Alarms
Step Procedure
1
Which alarms to view?
■
All nodes. In Map View, click the Alarms tab to view the alarm list
and functions. Go to Step 3.
■
Node. In Map View, double-click a node.
■
Module. In Shelf View, select a module.
■
Port. In Shelf View, select a port.
■
Service CTP
.
–
Click the Services tab.
–
Right-click on a service and select Show Tx/Rx Path.
–
Select an Active Hop.
2
Click the Alarms tab to view the alarm list and functions.
3
Choose one (or more) of the following viewing functions:
■
Alarm Tallies, go to the next step
■
Detail View, go to Step 5
■
Map View Display, go to Step 7
■
New Window, go to Step 8
■
Print, go to Step 9
■
Save, go to Step 10
■
Set Filters, go to Step 11
■
Sort by Column, go to Step 12
■
StickyMode, go to Step 13
4
Alarm TalliesDraw your attention to the lower-left corner of the alarm tab to see the
alarm tallies as follows:
■
Raised Alarms: The number of alarms raised by the system.
■
Displayed Alarms: The number of alarms in the display list.
Go to Step 14.
5
Detail ViewNode Operations and Maintenance Guide, Section 1: Fault Management
Viewing Alarms
Page 1-16 Turin Networks Release OPS3.1.x
6
Click Detail View to display the Alert Detail (View Main) dialog box and
view highlighted alarm details.
Go to Step 14.
7
Map View DisplayDraw your attention to the upper half of the GUI screen to see the Map
View alarm screen.
If a node is in an alarm state, it will be displayed on the Map View node
object in the color of the highest level alarm severity with a caption
indicating the number and type of alarm. For example, in Figure 1-2, the
node TE100SIGTWO has four critical (4C) alarms, so it is colored red
with the caption 4C.
For definitions of the severity levels, see Alarm Severity Levels,
page 1-5.
Go to Step 14.
8
New WindowFrom the Alarms tab, click New Window to open a new alarm window.
Note:
Multiple alarm windows can be opened, each with independently
configurable filters.
Go to Step 14.
9
PrintClick Print to print the contents of the Alarms tab alarms list.
Go to Step 14.
10
SaveClick Save to save alarm information to a text file.
Go to Step 14.
Table 1-7 Viewing Alarms (continued)
Chapter 1 Managing Alarms and Events
Viewing Alarms
11
Set FiltersFrom the Alarms tab, click Set Filters to set the alarm filters.
Note:
Alarms can be filtered by Source, Probable Cause, Time, Severity,
and Acknowledged By categories.
Figure 1-11 Alarm Filter Dialog Box
Go to Step 14.
12
Sort by ColumnClick a column heading to sort the alarms by that category. The Name,
Probable Cause, and AckBy (acknowledged by) columns can be sorted in
alphabetical or reverse alphabetical order. The Severity NSA and Severity
SA columns can be sorted in ascending or descending severity. The
ServiceAffecting and Enabled columns can be sorted by select/clear.
Click the column heading again to switch from one sorting category to the
other.
Go to Step 14.
Table 1-7 Viewing Alarms (continued)
Node Operations and Maintenance Guide, Section 1: Fault Management
Viewing Alarms
Page 1-18 Turin Networks Release OPS3.1.x
13
StickyModeSelecting this checkbox freezes the current alarm screen. Alarms remain in
the order displayed at the time the check box was selected, regardless of a
change in severity level. For example, if alarms are currently sorted by
decreasing severity level, critical alarms display first, followed by major,
minor, and so on. New alarms are not reported, but deleted alarms are
removed (when a node is deleted, all of its alarms are deleted). If the
StickyMode check box is clear, when a critical alarm is cleared, it is
moved to the bottom of the list. If the StickyMode check box is selected,
that alarm remains at the top of the list, while its severity would change
from Critical to Clear.
Turin recommends that you open a new window before you select
StickyMode so that new alarms continue to be reported.
14
Do you want to perform another alarm display function?
■
Yes. Go to Step 3.
■
No. The Viewing Alarms procedure is complete.
Table 1-7 Viewing Alarms (continued)
SECTION 1FAULT MANAGEMENT
Chapter 2
Alarms, Events, and Recommended Actions
Introduction
During normal operation of the Turin product family, various conditions may arise that
require attention by network operations. Events and alarms alert you to Traverse
system operational changes.
This chapter includes the following alarms, events, and recommended actions.
■
Alarms/Events, A through C, page 1-20
■
Alarms/Events, D through K, page 1-37
■
Alarms/Events, L through S, page 1-57
■
Alarms/Events, TA200, page 1-91
■
Alarms/Events, TB through TZ, page 1-92
■
Alarms/Events U through Z, page 1-99
Each alarm or event contains the following information:
■
The alarm or event as viewed on the Alarms or Events tab in the TransNav GUI.
■
The Alarm Profile which contains the alarm or event. This is provided in case you
want to change the service affecting status, severity or enabled status of the alarm.
■
Alarm or event definition/probable cause.
■
Alarm or event Service Affecting or Non-Service Affecting status by default on the
Alarm Profile.
■
Alarm or event default severity when it is Service Affecting (unprotected), and its
severity when it is Non-Service Affecting (protected).
■
Recommended action when the alarm or event is received.
Note:
The Traverse backplane provides hardware support for sixteen environmental
alarm inputs and eight environmental alarm outputs. The environmental telemetry
inputs and outputs are supported by the optional Environmental Alarm Module (EAM)
located on the main backplane. These alarms are defined using the TransNav
management system. Refer to the Traverse Installation and Commissioning Guide or
the TraverseEdge 100 User Guide for details on environmental alarm connections.
Note:
For Loss of Signal alarms, see the information in Section 4—
Diagnostics
,
Chapter 2—“Traverse Transmit and Receive Signal Levels,” page 4-3 or
Chapter 3—“TraverseEdge 100 Transmit and Receive Signal Levels,” page 4-7.
Contact the Turin Technical Assistance Center (TAC) if you need assistance.
N ode Op er at ions an d M aint ena nce Gu ide , S ec tion 1: Faul t Ma nag eme nt Alarms /Events , A through C P age 1-20 T u rin N et w o rk s R e lea se O P S 3.1 .x
Alarms/Events,
A through C
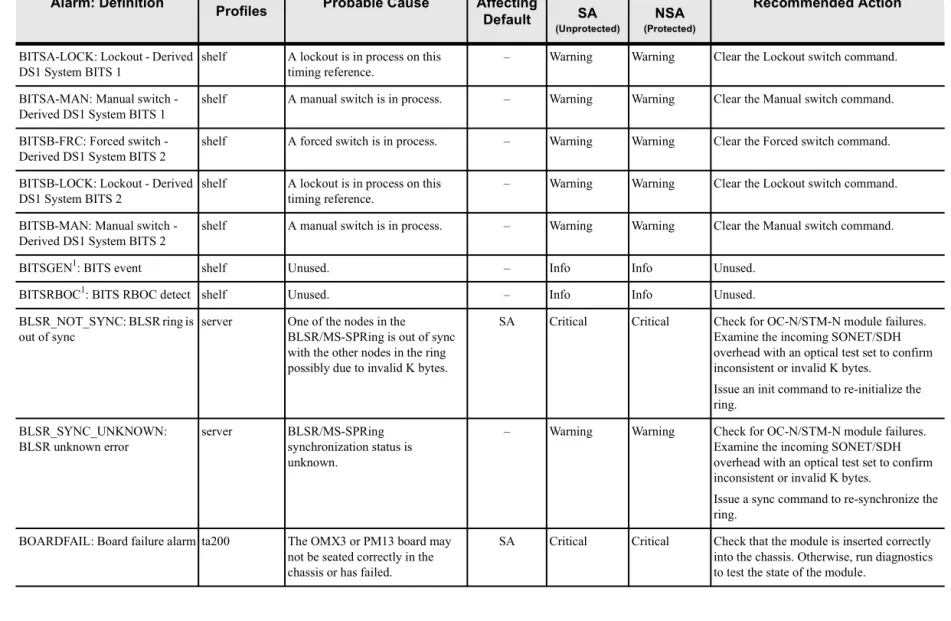
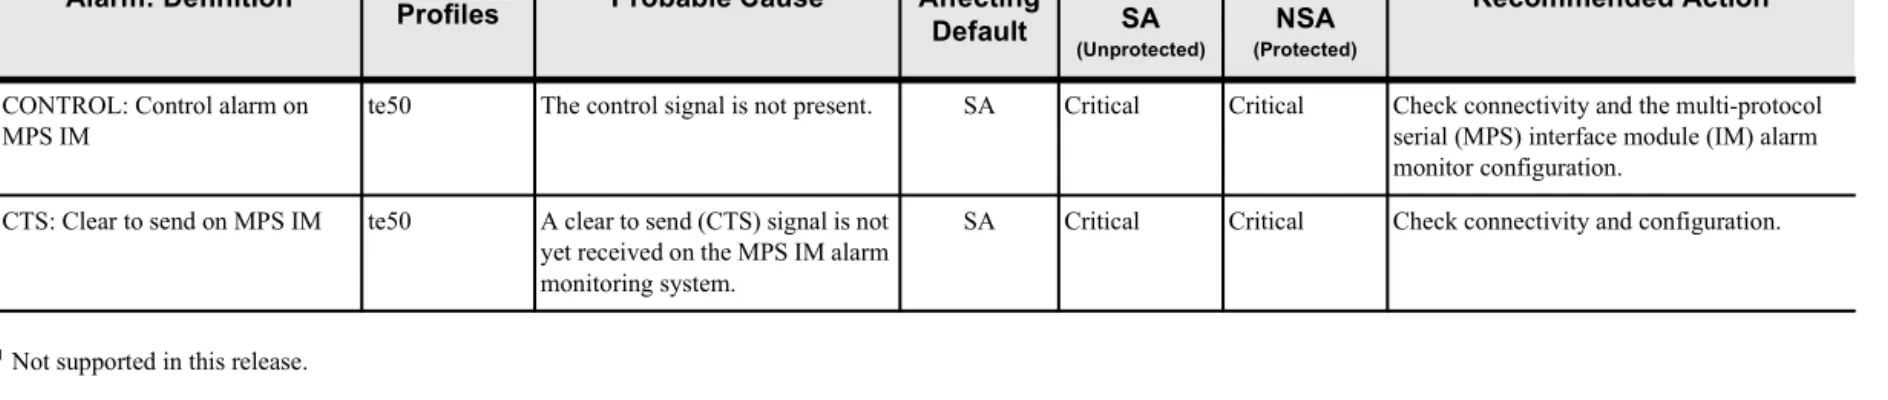
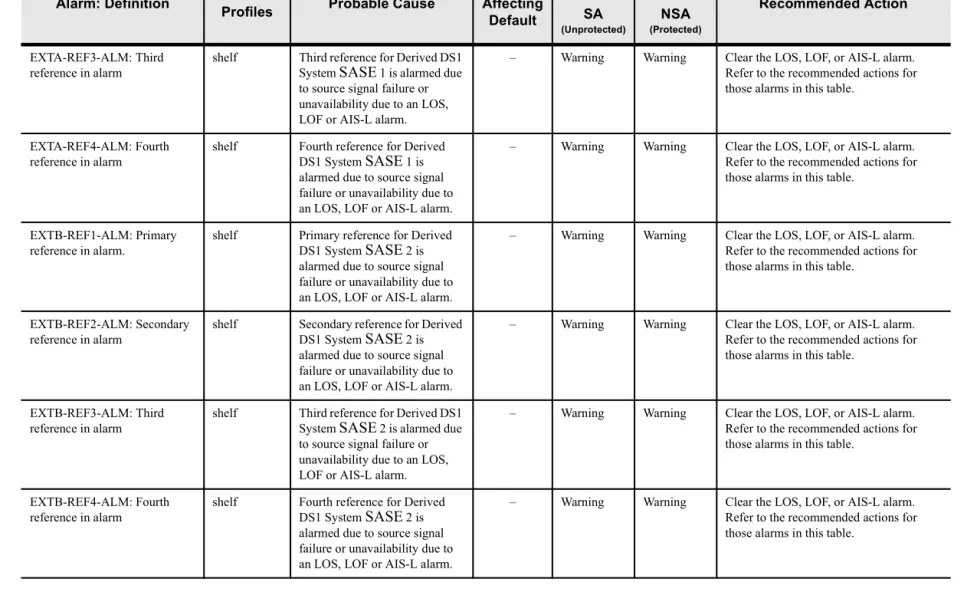
Table 1-8 Alarms, Events and Recommended Actions, A through C
Alarm: Definition ProfilesAlarm Probable Cause
Service Affecting Default Default Severity Recommended Action SA (Unprotected) NSA (Protected)
ACO: Alarm Cut Off shelf The audible alarm is cut off (silenced) because the operator pressed the ACO/LED control button.
– Info Info (Informational; no action required.)
ACO_CLEAR: Clear Alarm Cut Off
shelf Alarm cutoff is now clear. – Info Info (Informational; no action required.) ADMINTASK1: Administrative
task
server An administrative task was executed.
– Info Info (Informational; no action required.) AIRCOND: Air Conditioning
System Fail
shelf Air conditioning system failed. – Minor Minor Check and repair the air conditioning equipment, as necesary.
AIRDRYR: Air Dryer Fail shelf Air dryer failed. – Minor Minor Check and repair the air dryer equipment, as necesary.
AIS-L: Alarm indication signal – Line ds1_ptp ds3_ptp (ds_ptp) e3_ptp1 ta200 te50
The input signal on a DS1, DS3, or EC-1 interface contains an AIS.
SA ical Critical Check the equipment (module/port) upstream.
Clear upstream alarms.
shelf The locally received BITS signal contains an AIS. This indicates a remote BITS failure.
SA Critical Minor Check the BITS upstream. Clear upstream alarms. sonet_ptp The locally received OC-N signal
contains an AIS. This indicates a remote OC-N level failure.
SA Critical Minor Check the equipment (module/port) upstream.
C h apte r 2 A la rm s, E ve nts, and R eco mme nde d A ction Alarms /Events , A through C Rele ase O PS3 .1.x Turin Netw orks Pa ge 1 -2
AIS-P: Alarm indication signal – Path ds3_ptp (ds_ptp) e3_ptp ta200 te50
The STS signal demultiplexed from the DS3 or EC-1 contains an AIS. This AIS can result from an upstream failure along the STS path.
SA Critical Critical Check the equipment (module/port) upstream.
Clear upstream alarms. Verify your payload connections. sonet_ptp
sonet_sts
The STS signal demultiplexed from the OC-N/STM-N contains an AIS. This AIS can result from an upstream failure along the STS path.
SA Critical Minor Check the equipment upstream. Clear upstream alarms. Verify your payload connections. AIS-S1: Alarm indication signal –
Service ds3_ptp (ds_ptp) e3_ptp sdh_ptp sonet_ptp sonet_service
An upstream failure occurred at the Service layer.
– Warning Info Check the equipment upstream. Clear upstream alarms.
AIS-V1: Alarm indication signal – VT ds1_ptp ds3_ptp (ds_ptp) e3_ptp shelf sonet_ptp sonet_vt sonet_sts
An upstream failure occurred at the VT path layer.
SA Critical Minor Check the equipment upstream. Clear upstream alarms.
Verify your VT payload connections.
ta200 te50
An upstream failure occurred at the VT path layer.
SA Critical Critical Check the equipment upstream. Clear upstream alarms.
Verify your VT payload connections.
sdh_ptp See TU-AIS. n/a n/a n/a See TU-AIS.
Table 1-8 Alarms, Events and Recommended Actions, A through C (continued)
Alarm: Definition Alarm
Profiles Probable Cause
Service Affecting Default Default Severity Recommended Action SA (Unprotected) NSA (Protected)
N ode Op er at ions an d M aint ena nce Gu ide , S ec tion 1: Faul t Ma nag eme nt Alarms /Events , A through C P age 1-22 T u rin N et w o rk s R e lea se O P S 3.1 .x
AIS-VC: Alarm indication signal - VC
e1_ptp sdh_ptp
An upstream failure occurred at the VC path layer.
SA Critical Minor Check the equipment upstream. Clear upstream alarms.
Verify your VC payload connections. ALS: Automatic laser shutdown ethernet_ptp
sdh_ptp sonet_ptp
Transmitter of the optical interface has been turned off automatically after detection of LOS on the receiver.
– Critical Minor Transmitter has been shutdown per G.664. Check remote port transmitter state and fiber and resolve LOS condition.
ALS-TX-OFF: Transmitter automatically disabled
ethernet_ptp sdh_ptp sonet_ptp
Event logged against the optical interface upon ALS alarm condition.
– Info Info (Informational; no action required.)
APS-AIS-P1: Automatic protection ( multiplex section protection - MSP) Administrative Unit switching Alarm Indication Signal – Path
shelf A protection switch has occurred due to an AIS-P alarm.
– Info Info See AIS-P.
APS-LOP-P1: Automatic protection switching (multiplex section protection - MSP) Loss of Pointer – Path
shelf A protection switch has occurred due to an LOP-P alarm.
– Info Info See LOP-P.
APS-SDBER-P1: Automatic protection switching (multiplex section protection - MSP) Signal Degrade Bit Error Rate – Path
shelf A protection switch has occurred because of an SDBER-P alarm.
– Info Info See SDBER-P.
APS-SFBER-P1: Automatic protection switching (multiplex section protection - MSP) Signal Fail Bit Error Rate – Path
shelf A protection switch has occurred because of an SFBER-P alarm.
– Info Info See SFBER-P.
Table 1-8 Alarms, Events and Recommended Actions, A through C (continued)
Alarm: Definition ProfilesAlarm Probable Cause
Service Affecting Default Default Severity Recommended Action SA (Unprotected) NSA (Protected)
C h apte r 2 A la rm s, E ve nts, and R eco mme nde d A ction Alarms /Events , A through C Rele ase O PS3 .1.x Turin Netw orks Pa ge 1 -2 APS-UNEQ-P1: Automatic protection switching (multiplex section protection - MSP) Unequipped – (High Order) Path
shelf A protection switch has occurred because of an UNEQ STS path alarm.
– Info Info See UNEQ-P.
APSAISCLEAR1: Automatic protection switching (multiplex section protection - MSP) Alarm Indication Signal Clear
shelf A protection switch which occurred because of an AIS alarm has been cleared.
– Info Info If frequent protection switching occurs, check the revertive WTR period setting.
APSB: Automatic protection switch (multiplex section protection - MSP) byte failure
sonet_ptp sdh_ptp
On a 2F BLSR, the APS K1/K2 bytes are in an invalid state.
– Minor Minor Check for OC-N module failures. Examine the incoming SONET overhead with an optical test set to confirm inconsistent or invalid K bytes. APSBF: Automatic protection
switch byte failure APSCFGMIS: Automatic protection switch (multiplex section protection - MSP) configuration mismatch
sonet_ptp sdh_ptp
1+1 linear APS reports this alarm if bidirectional mode is set and K2 bits 6-8 are any of these values: 0,1,2,3.
– Minor Minor ■ Check that the fiber is connected properly to the remote node.
■ Check that a remote 1+1 linear PG exists. APSCM: Automatic protection
switch (multiplex section protection - MSP) channel mismatch
sonet_ptp sdh_ptp
On a 2F BLSR, the local Traverse node is not receiving the K1/K2 values it is expecting.
– Minor Minor Check for OC-N module failures. Examine the incoming SONET overhead with an optical test set to confirm inconsistent or invalid K bytes. APSIMP: Improper automatic
protection switching (multiplex section protection - MSP) code
sonet_ptp sdh_ptp
On a 2F BLSR, the automatic protection switching codes are improper. Indicates invalid K bytes.
– Minor Minor Reseat the modules at the near end and upstream nodes.
Examine the incoming SONET overhead with an optical test set to confirm invalid K bytes.
Table 1-8 Alarms, Events and Recommended Actions, A through C (continued)
Alarm: Definition Alarm
Profiles Probable Cause
Service Affecting Default Default Severity Recommended Action SA (Unprotected) NSA (Protected)
N ode Op er at ions an d M aint ena nce Gu ide , S ec tion 1: Faul t Ma nag eme nt Alarms /Events , A through C P age 1-24 T u rin N et w o rk s R e lea se O P S 3.1 .x
APSINC: Inconsistent automatic protection switching (multiplex section protection - MSP) code
sonet_ptp sdh_ptp
On a 2F BLSR, the automatic protection switching codes are inconsistent. Three consecutive frames do not contain identical APS bytes, giving the receiving equipment conflicting commands about switching.
– Minor Minor Check for other alarms, especially BERSD-L and BERSF-L. Clear these alarms.
Verify the local receive optical levels, as well as the upstream transmit optical levels. Clean the optical connectors.
Reseat the modules at the near end and upstream nodes.
Check the protection mode for the far-end node.
APSLOPCLEAR1: Automatic protection switching (multiplex section protection - MSP) Loss of Pointer Clear
shelf A protection switch which occurred because of an LOP-P alarm has been cleared.
– Info Info If frequent protection switching occurs, check the revertive WTR period setting.
APSLOS1: Automatic protection switching (multiplex section protection - MSP) Loss of Signal
shelf A protection switch has occurred because of an LOS alarm.
– Info Info See LOS.
APSLOSCLEAR1: Automatic protection switching (multiplex section protection - MSP) Loss of Signal Clear
shelf A protection switch which occurred because of an LOS alarm has been cleared.
– Info Info If frequent protection switching occurs, check the revertive WTR period setting.
APSMM1: Automatic protection switch (multiplex section protection - MSP) mode mismatch
sonet_ptp sdh_ptp
There is a mismatch of the protection switching schemes at the two ends of the span.
– Minor Minor Check protection modes at both ends. Verify that both ends are set for bidirectional or unidirectional.
APSPATHCLEAR1: Automatic protection switching (multiplex section protection - MSP) Path Clear
shelf A protection switch which occurred because of a path alarm has been cleared.
– Info Info If frequent protection switching occurs, check the revertive WTR period setting. Table 1-8 Alarms, Events and Recommended Actions, A through C (continued)
Alarm: Definition ProfilesAlarm Probable Cause
Service Affecting Default Default Severity Recommended Action SA (Unprotected) NSA (Protected)
C h apte r 2 A la rm s, E ve nts, and R eco mme nde d A ction Alarms /Events , A through C Rele ase O PS3 .1.x Turin Netw orks Pa ge 1 -2
APSPDI1: Automatic protection switching (multiplex section protection - MSP) Path Defect Indication
shelf A protection switch has occurred because of a PDI alarm.
– Info Info See PDI.
APSPDICLEAR1: Automatic protection switching (multiplex section protection - MSP) Path Defect Indication Clear
shelf A protection switch which occurred because of a PDI alarm has been cleared.
– Info Info If frequent protection switching occurs, check the revertive WTR period setting.
APSREL: Automatic protection switching (multiplex section protection - MSP) release
shelf The alarm condition that caused an automatic protection switch has been cleared. This occurs when a protection group has been configured as non-revertive.
– Info Info (Informational; no action required.)
APSSDCLEAR1: Automatic protection switching (multiplex section protection - MSP) Signal Degrade Clear
shelf A protection switch which occurred because of an SDBER-P alarm has been cleared.
– Info Info If frequent protection switching occurs, check the revertive WTR period setting.
APSSFCLEAR1: Automatic protection switching (multiplex section protection - MSP) Signal Fail Clear
shelf A protection switch which occurred because of an SFBER-P alarm has been cleared.
– Info Info If frequent protection switching occurs, check the revertive WTR period setting.
APSUNEQCLEAR1: Automatic protection switching (multiplex section protection - MSP) Unequipped Clear
shelf A protection switch which occurred because of an UNEQ STS path alarm has been cleared.
– Info Info If frequent protection switching occurs, check the revertive WTR period setting. Table 1-8 Alarms, Events and Recommended Actions, A through C (continued)
Alarm: Definition Alarm
Profiles Probable Cause
Service Affecting Default Default Severity Recommended Action SA (Unprotected) NSA (Protected)
N ode Op er at ions an d M aint ena nce Gu ide , S ec tion 1: Faul t Ma nag eme nt Alarms /Events , A through C P age 1-26 T u rin N et w o rk s R e lea se O P S 3.1 .x
APSWTR: Transition to Wait to Restore mode (multiplex section protection - MSP)
shelf Traffic is in the process of switching back to working channels. This occurs when a 1:1 equipment, 1+1 facility, or BLSR/MS-SP Ring protection group has been configured as revertive.
– Info Info If frequent protection switching occurs, check the revertive WTR period setting.
AU-AIS: Administrative Unit Alarm Indication Signal
ds3_ptp sdh_hp sdh_ptp
The STM signal demultiplexed from the STM-N contains an AIS. This AIS can result from an upstream failure along the STM path.
SA Critical Minor Check the equipment upstream. Clear upstream alarms. Verify your payload connections. AU-LOP: Administrative Unit
Loss of Pointer
ds3_ptp sdh_hp sdh_ptp
Valid AU pointer bytes are missing from the SDH overhead.
SA Critical Minor Check the cabling and physical connections on the reporting card.
Verify cross-connects.
Check network timing synchronization. Verify that the expected bandwidth and received bandwidth are the same. If the alarm persists, replace the module. AUTHFAIL1: OSPF
authentication key or type mismatch
shelf An OSPF packet has been received whose authentication key or type conflicts with this node’s authentication key or type.
– Minor Minor Retry authentication with new key or type.
AUTOPRV1: Auto provisioning error
sonet_ptp sdh_ptp
A signal failure has occurred on the ring and the user has added new cross-connect data. When the system attempts to auto provision the squelch tables, they cannot be updated, triggering the alarm.
– Minor Minor Clear the signal failure. Table 1-8 Alarms, Events and Recommended Actions, A through C (continued)
Alarm: Definition ProfilesAlarm Probable Cause
Service Affecting Default Default Severity Recommended Action SA (Unprotected) NSA (Protected)
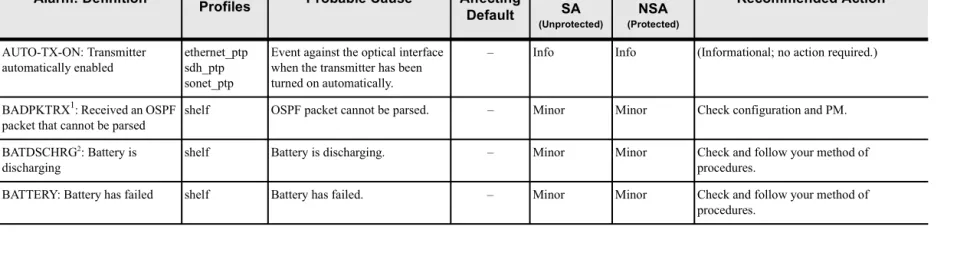
C h apte r 2 A la rm s, E ve nts, and R eco mme nde d A ction Alarms /Events , A through C Rele ase O PS3 .1.x Turin Netw orks Pa ge 1 -2 AUTO-TX-ON: Transmitter automatically enabled ethernet_ptp sdh_ptp sonet_ptp
Event against the optical interface when the transmitter has been turned on automatically.
– Info Info (Informational; no action required.)
BADPKTRX1: Received an OSPF packet that cannot be parsed
shelf OSPF packet cannot be parsed. – Minor Minor Check configuration and PM. BATDSCHRG2: Battery is
discharging
shelf Battery is discharging. – Minor Minor Check and follow your method of
procedures.
BATTERY: Battery has failed shelf Battery has failed. – Minor Minor Check and follow your method of procedures.
Table 1-8 Alarms, Events and Recommended Actions, A through C (continued)
Alarm: Definition Alarm
Profiles Probable Cause
Service Affecting Default Default Severity Recommended Action SA (Unprotected) NSA (Protected)
N ode Op er at ions an d M aint ena nce Gu ide , S ec tion 1: Faul t Ma nag eme nt Alarms /Events , A through C P age 1-28 T u rin N et w o rk s R e lea se O P S 3.1 .x
BERSD-L: Bit ErrorRate signal degrade – Line
ds3_ptp (ds_ptp) e3_ptp1
The BER on the incoming EC-1 line has exceeded the signal degrade threshold.
SA Warning Warning Check cable connectors and module ports. If an EC-1 module is a possible source of the bit errors, perform a manual protection switch to the protection unit. If the BER alarm clears, replace the defective “working” unit.
Check the remote (source) Transmit and cable connection.
shelf te50
The BER on the incoming BITS has exceeded the signal degrade threshold.
– Warning Warning Check cable connectors.
sonet_ptp ■ The BER on the incoming OC-N line has exceeded the signal degrade threshold. ■ A connector in the OC-N optical link could be dirty. ■ An OC-N module hardware
problem could exist. ■ Fiber could be bent or
damaged.
SA Warning Warning Verify the local receive optical levels, as well as the upstream transmit levels. Verify good optical connections.
Clean optical cable connectors and module ports.
If an OC-N module is a possible source of the bit errors, perform a manual protection switch to the protection unit. If the BER alarm clears, replace the defective “working” unit.
Check the remote (source) Transmit and fiber connection.
Check fiber for bends or damage. If the problem persists, contact Turin’s Customer Service (TAC).
Table 1-8 Alarms, Events and Recommended Actions, A through C (continued)
Alarm: Definition ProfilesAlarm Probable Cause
Service Affecting Default Default Severity Recommended Action SA (Unprotected) NSA (Protected)
C h apte r 2 A la rm s, E ve nts, and R eco mme nde d A ction Alarms /Events , A through C Rele ase O PS3 .1.x Turin Netw orks Pa ge 1 -2
BERSD-P: Bit Error Rate signal degrade – Path
ds3_ptp (ds_ptp) e3_ptp1
The STS signal demultiplexed and dropped from the EC-1 has exceeded its signal degrade threshold.
SA Warning Warning Examine the network for other path bit error rate problems and retrieve PM data to find a possible common source of the bit errors. Perform loopback tests to isolate the problem.
Check cable connectors and module ports. If an EC-1 module is a possible source of the bit errors, perform a manual protection switch to the protection unit. If the BER alarm clears, replace the defective “working” unit.
sonet_ptp sonet_sts
The STS signal demultiplexed and dropped from the OC-N/STM-N has exceeded its signal degrade threshold.
SA Warning Warning Examine the network for other path bit error rate problems and retrieve PM data to find a possible common source of the bit errors. Perform loopback tests to isolate the problem.
Check cable connectors and module ports. If an OC-N/STM-N module is a possible source of the bit errors, perform a manual protection switch to the protection unit. If the BER alarm clears, replace the defective “working” unit.
Table 1-8 Alarms, Events and Recommended Actions, A through C (continued)
Alarm: Definition Alarm
Profiles Probable Cause
Service Affecting Default Default Severity Recommended Action SA (Unprotected) NSA (Protected)
N ode Op er at ions an d M aint ena nce Gu ide , S ec tion 1: Faul t Ma nag eme nt Alarms /Events , A through C P age 1-30 T u rin N et w o rk s R e lea se O P S 3.1 .x
BERSD-V: BitError Rate signal degrade – VT Path
ds1_ptp ds3_ptp (ds_ptp) e3_ptp1
The VT signal demultiplexed and dropped from the DS1 has exceeded its signal degrade threshold.
SA Warning Warning Examine the network for other path bit error rate problems and retrieve PM data to find a possible common source of the bit errors. Perform loopback tests to isolate the problem.
Check cable connectors and module ports. sonet_ptp
sonet_sts sonet_vt shelf
The VT signal demultiplexed and dropped from the OC-N has exceeded its signal degrade threshold.
SA Warning Warning Examine the network for other path bit error rate problems and retrieve PM data to find a possible common source of the bit errors. Perform loopback tests to isolate the problem.
Check cable connectors and module ports.
sdh_ptp See LP-BERSD. n/a n/a n/a See LP-BERSD.
BERSD-VC: Bit Error Rate signal degrade – VC Path
e1_ptp sdh_ptp
The VC signal demultiplexed and dropped from the STM-N has exceeded its signal degrade threshold.
SA Warning Warning Examine the network for other path bit error rate problems and retrieve PM data to find a possible common source of the bit errors. Perform loopback tests to isolate the problem.
Check cable connectors and module ports. Table 1-8 Alarms, Events and Recommended Actions, A through C (continued)
Alarm: Definition ProfilesAlarm Probable Cause
Service Affecting Default Default Severity Recommended Action SA (Unprotected) NSA (Protected)
C h apte r 2 A la rm s, E ve nts, and R eco mme nde d A ction Alarms /Events , A through C Rele ase O PS3 .1.x Turin Netw orks Pa ge 1 -3
BERSF-L: Bit Error Rate signal fail – Line
ds3_ptp (ds_ptp) e3_ptp1
The BER on the incoming EC-1 line has exceeded the signal fail threshold.
SA Warning Warning Check cable connectors and module ports.
shelf te50
The BER on the incoming BITS has exceeded the signal fail threshold.
– Warning Warning Check cable connectors.
sonet_ptp ■ The BER on the incoming OC-N line has exceeded the signal fail threshold.