A Linear Fitting Density Peaks Clustering Algorithm for Image Segmentation
You ZHOU, Tiantian ZHAO, Yizhang WANG, Jianan WU, Xu ZHOUAbstract: Clustering by fast search and finding of density peaks algorithm (DPC) is a recently developed method and can obtain promising results. However, DPC needs users to determine the number of clusters in advance, thus the clustering results are unstable and deeply influenced by the number of clusters. To address this issue, we proposed a novel algorithm, namely LDPC (Linear fitting Density Peaks Clustering algorithm). LDPC uses a novel linear fitting method to choose cluster centres automatically. In the experiments, we use public datasets to access the effectiveness of LDPC. Especially, we applied LDPC to image segmentation tasks. The experimental results show that LDPC can obtain competitive results compared with other clustering algorithms.
Keywords: clustering; density peaks; image segmentation; linear fitting
1 INTRODUCTION
In recent years, image segmentation is a useful technique and becomes an important research topic in computer vision field. Image segmentation is the process of dividing an image into different areas and the union of any two adjacent regions is not homogeneous [1]. Image segmentation techniques are applied to many fields, such as medical research [2], person re-identification [3]. For image segmentation, many methods are proposed, such as edge detection, threshold method, region segmentation, clustering, and neural network [4], in which clustering method has great advantages because it is an unsupervised method without labels, and requires less computing overhead. Thus many clustering algorithms have been applied to the image segmentation, such as K-means [5, 6], fuzzy C-means [7], mean-shift [8].
DPC is a novel density clustering algorithm without iteration [10], and it can identify clusters with different shapes, such as images. However, it also needs users to estimate the number of cluster centers based on the decision graph. This process affects the accuracy of DPC algorithm. To address this issue, we proposed a novel clustering method based on DPC.
The contributions of LDPC are mainly in two aspects: (1) we proposed a novel method to access the possibility of becoming the center for each point in a decision graph. (2) The process of choosing cluster centers by human intervention is replaced by linear fitting approach.
2 CLUSTERING BY FAST SEARCH AND FINDING OF DENSITY PEAKS
In this section, we describe original DPC algorithm. DPC is based on the following hypotheses:
(1) The center of a cluster is surrounded by points with lower local density, in other words, the density of the center is the local maximum [12].
(2) The center of a cluster has a relatively large distance from points with higher densities [13, 14].
DPC uses two parameters to determine cluster centers: for each point i, the local density ρi and its distance δi from points of higher density are defined as Eq. (1) and Eq. (2) [15]. 1 0 ( ), ( ) 0 i ij c j x X d d X x otherwise r = − = <
∑
(1)In Eq. (1), where dc is a cutoff distance and needs to
be defined by users. The local density is equivalent to the
total number of points which have smaller distance than dc
with point i. The average number of neighbors of every
point often is 2% of all points [17, 18]. ( ) if ( ) j ij j i i j ij min d max d otherwise r r d = > (2)
In Eq. (2), we can get that only the point which has
local or global maximum value of density has larger δi
than others. Cluster centers are points which have
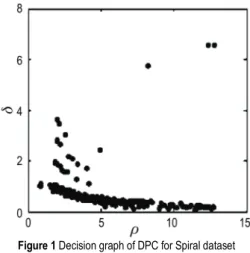
relatively large ρ and δ values. In DPC, we can use ρ − δ
decision graph to choose centers as shown in Fig. 1 (Spiral dataset), points of top right corner are centers [19].
Figure 1 Decision graph of DPC for Spiral dataset
After cluster centers were selected, each remaining point is assigned to the same cluster as its nearest neighbor of higher density.
3 LINER FITTING DENSITY PEAKS CLUSTERING ALGORITHM
In this section, we describe the proposed LDPC.
3.1. Secondly, we calculate ρ and δ. Thirdly, we calculate
variable γ in subsection 3.2, and use linear fitting to
calculate the residual sequence. Finally, the points whose residual errors are obviously larger than others are chosen as centers.
3.1 Calculate dc
We use method of [11] to calculate dc. Since the
standard deviation can reflect the dispersion degree of a
data set, we design the cutoff distance dc based on it.
Assume that there are n points with m attributes in a given
data set X∈Rm×n. The d
c is defined as Eq. (3). 2 1 1 2 ( ) ( 1) 2 m j m j j j j c m d m σ m m ω = = ∗ ∗ − =
∑
∑
(3)Where σjand μj are the standard deviation and mean
value of attribute j respectively. ω∈ (0, 1] is a trade-off
parameter to control the size of cutoff distance. Here we set ω∈ 11.
3.2 Automatic Determination of Centres
In order to automatically determine cluster centers, we first define a variable γ of data point i, γ is defined as
i i i
γ =r d× (4)
Before calculating the value of γ, the values of ρ and δ
of all data points should be normalized. The reason is that
if ρ and δ have different orders of magnitude, the effects of
small variables are easily ignored. Then we sort γ in
descending order called γs, data points with relatively large
values of ρ and δ are chosen as cluster centers in DPC, so
the γ values of centers are larger than others in LDPC.
We draw the change of γs as shown in Fig. 2. We can
clearly see that centers in the upper left corner are relatively sparse, but others are particularly dense. These sparse points are chosen as centers. Therefore, how to choose centers is transformed into how to separate sparse points from dense points.
Figure 2 Sorted-Gamma graph of Spiral dataset
In Fig. 2, the dense points can be seen as a straight line except a few sparse points. In this way, we can use linear fitting method to separate sparse points. We obtain a
residual sequence c by subtracting original γs and fitting
value γr. In Fig. 3, we can see that the residuals of the
sparse points are significantly larger than the dense points.
Figure 3 Residual graph of Spiral dataset
We adopt a special method here to separate sparse points which are chosen centers. For discrete data, because
the γ value of discrete centers is significantly greater than
the others, we can clearly find a jump point ap in residual
sequence and use the red circle to mark this point (Fig. 3).
The point before ap can be considered as the center point.
The jump point ap is set as Eq. (5).
1 if
10i
i c
ap i,= c < − (5)
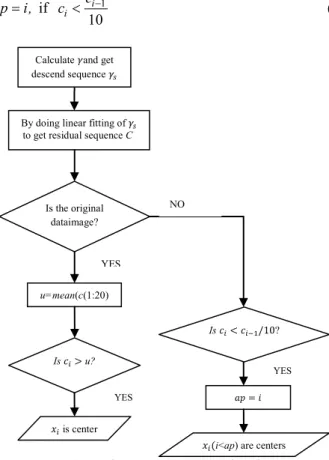
Figure 4 Centres selection process of LDPC
In this research, we mainly focus on the images segmentation. Images have no large jumps as discrete data, so here we use another method to find centers. Generally, colors of most images are not too many. In other words, the number of clusters is less than 20. What’s more,
By doing linear fitting of 𝛾𝛾𝑠𝑠 to get residual sequence C
u=mean(c(1:20) Is the original
dataimage? Calculate 𝛾𝛾and get descend sequence 𝛾𝛾𝑠𝑠 Is 𝑐𝑐𝑖𝑖> u? 𝑥𝑥𝑖𝑖 is center 𝑎𝑎𝑎𝑎 = 𝑖𝑖 Is 𝑐𝑐𝑖𝑖< 𝑐𝑐𝑖𝑖−1/10? 𝑥𝑥𝑖𝑖(i<ap) are centers NO YES YES YES
residuals of centers are large, difference of residuals of other points except centers is small. So we only need to compare center points with the dense part of the front part, and then we can choose centers.
In LDPC, we choose the average of the residuals of the first 20 points as the threshold, data points that are greater than threshold are chosen as centers. The specific selection process of LDPC is shown in Fig. 4.
4 EXPERIMENTS AND DISCUSSIONS 4.1 Synthetic Datasets
The datasets Spiral, Flame and Aggregation are used to test the clustering performance of LDPC. The clustering results of LDPC and DPC are shown in Fig. 5. DPC needs users to determine the number of clusters. LDPC and DPC obtain the same results. The proposed LDPC algorithm can obtain correct results without manual intervention. The image segmentation experimental results are shown and discussed in subsection 4.2.
(a) LDPC (b) DPC
Figure 5 Clustering results on UCI datasets 4.2 Image Segmentation
In this section, we compared the results on five typical images with K-means algorithm and DPC algorithm.
Image Lena is widely used in image processing field. We chose the best segmentation result of DPC. The experimental results on Lena are shown in Fig. 6. Fig. 6a is original Lena image, Fig. 6b is result of LDPC, Fig. 6c is the best result of DPC segmentation when setting percentage is 3, Figs. 6d, 6e and 6f are the result of
K-means when k is 2, 3, and 4 respectively. The result of k =
3 is the most accurate result for K-means. The segmentation results of LDPC and DPC are very similar to
that result of K-means (k = 3). However, DPC result has
more noise points than K-means, LDPC has less noise points than K-means.
The second image is a house, which can be divided
into three clusters as shown in Fig. 7. So we set k = 3,
percentage = 27. Fig. 7a is original image, Fig. 7b is
result of LDPC, Fig. 7c is result of DPC, and Fig. 7d is result of K-means.
(a) (b) (c)
(d) (e) (f)
Figure 6 Clustering results of Lena
The color number of DPC result is 2, which does not conform to the original image, the color number of LDPC result and K-means result are both 3. LDPC clusters the color of the wall and white into the same color. K-means combines white and blue into one color, both of these are reasonable. However, the contour of K-means is clearer than LDPC.
(a) (b) (c) (d)
Figure 7 Clustering results of House
The images we used for the final experiments included Flower, Peppers, Fruits, which are often used for image processing.
In Fig. 8, we set percentage = 2, k = 2, 3, 4. Fig. 8a is
original image, Fig. 8b is result of LDPC, and Fig. 8c is result of DPC, Figs. 8d, 8e and 8f are the result of K-means when k is 2, 3, and 4 respectively.
By observation, the result has the least noise points
and the image contour is clear when k = 2, this is the best
result. Results of LDPC and DPC both have two colors, but DPC result has more noise points than LDPC results.
(a) (b) (c)
(d) (e) (f)
Figure 8 Segmentation results of Flower
In Fig. 9, this image has two colors. Setting percentage = 10, k = 2. Fig. 9a is original image, Fig. 9b is the result of LDPC, Fig. 9c is result of DPC, and Fig. 9d is
result of k = 2. The clustering results of these three
(a) (b) (c) (d)
Figure 9 Segmentation results of Peppers
In Fig. 10, we set percentage = 2, k = 2, 3, 4. Fig. 10a
is original image, Fig. 10b is the result of LDPC, Fig. 10c is the result of DPC, Figs. 10d, 10e and 10f are the result of K-means when k is 2, 3, and 4 respectively.
The image contour is clearer when k = 3, k = 3 is the
best result of K-means. Result of LDPC also has three colors, but DPC result has two colors, which is too ambiguous.
(a) (b) (c)
(d) (e) (f)
Figure 10 Segmentation results of Fruits
From figures presented above, we can conclude that the LDPC algorithm obtains the same result with K-means
algorithm which sets the correct k value. However, DPC
can only segment a small number of images correctly
when the percentage of dc is suitable. On the contrary,
LDPC can be used in image segmentation automatically. It does not need to set any parameters, and can reach a certain accuracy in segmentation results.
5 CONCLUSION
For image segmentation, K-means algorithm is a very popular tool but the number of clusters needs to be determined in advance. In order to contribute a more robust tool, LDPC is proposed based on a linear fitting approach. Experimental results demonstrate that the performance of LDPC is as good as K-means and DPC, and even some of the images perform better than others.
DPC is a powerful tool to find low-dimensional features of high dimensional data, we can apply it to bioinformatics. In addition, deep auto-encoder can also find reasonable features, which can help DPC get more accurate results on large scale image datasets. The above ideas need to be further studied.
ACKNOWLEDGMENT
The research is supported in part by the National Science Fund Project of China No. 61772227 and Science & Technology Development Foundation of Jilin Province under the grant No. 20160101259JC, 20180201045GX.
6 REFERENCES
[1] Cheng, H. D., Jiang, X., Sun, Y., & Wang, J. (2001). Color
image segmentation: advances and prospects. Pattern
recognition, 34(12), 2259-2281.
https://doi.org/10.1016/S0031-3203(00)00149-7
[2] Pham, D. L., Xu, C., & Prince, J. L. (2000). Current
methods in medical image segmentation. Annual Review of
Biomedical Engineering, 2(2), 315.
https://doi.org/10.1146/annurev.bioeng.2.1.315
[3] Zhang, L., Li, K., & Zhang, Y. (2016). Adaptive image
segmentation based on color clustering for person
re-identification. Soft Computing, 1-11.
[4] Sonawane, M. S. & Dhawale, C. A. (2015). A Brief Survey
on Image Segmentation Methods. Foundation of Computer
Science, DISP 2015(1), 1-5.
[5] Chandhok, C., Chaturvedi, S., Khurshid, A. A. (2012). An
approach to image segmentation using K-means clustering
algorithm. International Journal of Information
Technology, 1(1), 11-17.
[6] Ng, H. P., Ong, S. H., & Foong, K. W. C. (2006). Medical
image segmentation using k-means clustering and improved
watershed algorithm. Image Analysis and Interpretation,
2006 IEEE Southwest Symposium on. IEEE, 61-65.
https://doi.org/10.1109/SSIAI.2006.1633722
[7] Zhang, D. Q. & Chen, S. C. (2004). A novel kernelized
fuzzy c-means algorithm with application in medical image
segmentation. Artificial intelligence in medicine, 32(1),
37-50. https://doi.org/10.1016/j.artmed.2004.01.012
[8] Tao, W., Jin, H., & Zhang, Y. (2007). Color image
segmentation based on mean shift and normalized cuts.
IEEE Transactions on Systems, Man, and Cybernetics, Part B (Cybernetics), 37(5), 1382-1389.
https://doi.org/10.1109/TSMCB.2007.902249
[9] Thilagamani, S. & Shanthi, N. (2011). A survey on image
segmentation through clustering. International Journal of
Research and Reviews in Information Sciences, 1(1), 14-17.
[10]Rodriguez, A. & Laio, A. (2014). Clustering by fast search
and find of density peaks. Science, 344(6191), 1492-1496.
https://doi.org/10.1126/science.1242072
[11]Gao, J., Zhao, L., & Chen, Z. (2016). ICFS: An Improved
Fast Search and Find of Density Peaks Clustering
Algorithm. Autonomic and Secure Computing, Intl Conf on
Pervasive Intelligence and Computing, Intl Conf on Big Data Intelligence and Computing and Cyber Science and Technology Congress, 537-543.
https://doi.org/10.1109/DASC-PICom-DataCom-CyberSciTec.2016.103
[12]Bie, R., Mehmood, R., Ruan, S., et al. (2016). Adaptive
fuzzy clustering by fast search and find of density peaks.
Personal & Ubiquitous Computing, 20(5), 785-793.
https://doi.org/10.1007/s00779-016-0954-4
[13]Mehmood, R., Bie, R., Dawood, H., et al. (2016). Fuzzy
Clustering by Fast Search and Find of Density Peaks.
International Conference on Identification, Information, and Knowledge in the Internet of Things. IEEE, 785-793.
[14]Mehmood, R., Zhang, G., Bie, R., et al. (2016). Clustering
by fast search and find of density peaks via heat diffusion.
Neurocomputing, 208(C), 210-217.
https://doi.org/10.1016/j.neucom.2016.01.102
[15]Zhang, J. Q. & Zhang, H. Y. (2017). Clustering by Fast
Search and find of Density Peaks Based on Manifold
Distance. Computer Knowledge & Technology.
[16]Ruan, S., Mehmood, R., Daud, A., et al. (2017). An
Adaptive Method for Clustering by Fast Search-and-Find of
Density Peaks: Adaptive-DP. Proceedings of the 26th
International Conference on World Wide Web Companion,
[17]Sun, H., Zhang, M. X., Dai, J., et al. (2017). Optimization of grid based clustering by fast search and find of density
peaks. Computer Engineering & Science.
[18]Liu, R., Wang, H., & Yu, X. (2018).
Shared-nearest-neighbor-based Clustering by Fast Search and Find of
Density Peaks. Information Sciences.
https://doi.org/10.1016/j.ins.2018.03.031
[19]Gao, J., Zhao, L., Chen, Z., et al. (2016). ICFS: An
Improved Fast Search and Find of Density Peaks Clustering
Algorithm. International Journal of Wavelets
Multiresolution & Information Processing, 13(04),
1550022.
https://doi.org/10.1109/DASC-PICom-DataCom-CyberSciTec.2016.103
Contact information:
You ZHOU, Doctor and Associate Professor
College of Computer Science and Technology, Jilin University
Key Laboratory of Symbol Computation and Knowledge Engineering of Ministry of Education
2699 Qianjin Street, Changchun, 130012, China E-mail: [email protected]
Tiantian ZHAO, Master Student
College of Computer Science and Technology, Jilin University 2699 Qianjin Street, Changchun, 130012, China
E-mail: [email protected]
Yizhang WANG, PhD student
College of Computer Science and Technology, Jilin University 2699 Qianjin Street, Changchun, 130012, China
E-mail: [email protected]
Jianan WU, Doctor and Associate Professor
College of Computer Science and Technology, Changchun University 6543 Weixing Road, Changchun 130022, China
E-mail: [email protected]
Xu ZHOU, Doctor and Associate Professor (Corresponding author)
College of Computer Science and Technology, Jilin University Center for Computer Fundamental Education, Jilin University 2699 Qianjin Street, Changchun, 130012, China