Exchange
Doctoral Dissertations Graduate School
5-2017
Wide-Area Synchrophasor Data Server System and
Data Analytics Platform
Dao Zhou
University of Tennessee, Knoxville, [email protected]
This Dissertation is brought to you for free and open access by the Graduate School at Trace: Tennessee Research and Creative Exchange. It has been accepted for inclusion in Doctoral Dissertations by an authorized administrator of Trace: Tennessee Research and Creative Exchange. For more
information, please [email protected].
Recommended Citation
Zhou, Dao, "Wide-Area Synchrophasor Data Server System and Data Analytics Platform. " PhD diss., University of Tennessee, 2017. https://trace.tennessee.edu/utk_graddiss/4515
I am submitting herewith a dissertation written by Dao Zhou entitled "Wide-Area Synchrophasor Data Server System and Data Analytics Platform." I have examined the final electronic copy of this dissertation for form and content and recommend that it be accepted in partial fulfillment of the requirements for the degree of Doctor of Philosophy, with a major in Electrical Engineering.
Yilu Liu, Major Professor We have read this dissertation and recommend its acceptance:
Hairong Qi, Wei Gao, James Ostrowski
Accepted for the Council: Dixie L. Thompson Vice Provost and Dean of the Graduate School (Original signatures are on file with official student records.)
Wide-Area Synchrophasor Data Server System
and
Data Analytics Platform
A Dissertation Presented for the
Doctor of Philosophy
Degree
The University of Tennessee, Knoxville
Dao Zhou
May 2017
Copyright © 2017 by Dao Zhou All rights reserved.
Acknowledgements
I would like to express my deepest gratitude and appreciation to my advisor, Dr. Yilu Liu, for her patient guidance and consistent encouragement through my PhD study. She is not only an academic advisor, but also a mentor for my life who has passed on wisdom and inspiration.
In addition, I would like to give special thanks to mycommittee members, Dr. Hairong Qi, Dr. Wei Gao, Dr. James Ostrowski for their precious time, guidance and suggestions. Next, I would like to thank all my colleagues: Dr. Yanzhu Ye, Dr. Jingyuan Dong, Dr. Ye Zhang, Dr. Yin Lei, Dr. Lingwei Zhan, Dr. Yong Liu, Dr. Jiahui Guo, Dr. Gefei Kou, Dr. Jidong Chai, Dr. Lin Zhu, Dr. Jiecheng Zhao, Ling Wu, Shutang You, Micah Till, Wenxuan Yao and Hesen Liu. It was a great pleasure to work them. I would also like to thank staff members in EECS department, Ms. Dana Bryson and Mr. Markus Iturriaga for their generous help in many ways.
Last but not least, I would like to appreciate my parents, my wife and daughter, for their love and support.
Abstract
As synchrophasor data start to play a significant role in power system operation and dynamic study, data processing and data analysis capability are critical to Wide-area measurement systems (WAMS). The Frequency Monitoring Network (FNET/GridEye) is a WAMS network that collects data from hundreds of Frequency Disturbance Recorders (FDRs) at the distribution level. The previous FNET/GridEye data center is limited by its data storage capability and computation power. Targeting scalability, extensibility, concurrency and robustness, a distributed data analytics platform is proposed to process large volume, high velocity dataset. A variety of real-time and non-real-time synchrophasor data analytics applications are hosted by this platform. The computation load is shared with balance by multiple nodes of the analytics cluster, and big data analytics tools such as Apache Spark are adopted to manage large volume data and to boost the data processing speed. Multiple power system disturbance detection and analysis applications are redesigned to take advantage of this platform. Data quality and data security are monitored in real-time. Future data analytics applications can be easily developed and plugged into the system with simple configuration.
Table of Contents
Chapter 1 Overview of FNET System ... 1
1.1 Introduction ... 1
1.2 Frequency Monitoring Network (FNET/GridEye) ... 2
1.3 Frequency Disturbance Recorders ... 4
1.4 Organization of Materials ... 4
Chapter 2 Data Collection ... 7
2.1 Data Collection Server System ... 7
2.2 FDR Configuration Synchronization ... 9
2.3 Timestamp Correction ... 12
2.4 Conclusion ... 16
Chapter 3 Real-time Synchrophasor Applications ... 17
3.1 Motivations ... 17
3.2 Synchrophasor Applications ... 18
3.2.1 Real-time Online Applications ... 18
3.2.2 Online Applications Dependency and Priority ... 20
3.2.3 Offline Data Analytics ... 21
3.3 System Architecture Design ... 22
3.4 System Implementation ... 24
3.4.1 Data Concentrator ... 24
3.4.2 Data Storage ... 25
3.4.3 Real-time Disturbance Detection ... 26
3.4.4 Trigger Processing Interface ... 27
3.4.5 Distributed Near-real-time analytics ... 31
Chapter 4 Real-time Line Trip Detection ... 32
4.1 Algorithm Design... 32 4.2 Simulation Results ... 35 4.3 Application Development ... 37 4.3.1 Application Architecture ... 37 4.3.2 Adapter Design ... 38 4.3.3 Alarming ... 40 4.4 Test Results ... 41 4.5 Conclusion ... 43
Chapter 5 Synchrophasor Data Quality and Security ... 45
5.1 Introduction ... 45
5.2 Methodology ... 46
5.3 Temporal Patterns of GPS Losses... 48
5.3.1 Loss-recovery time... 50
5.3.2 Monthly Trend ... 50
5.3.3 Daily Trend ... 50
5.4 Spatial Patterns of GPS Losses ... 54
5.5 Impact of Weather/ Space Weather ... 54
5.7 Conclusion ... 61
Chapter 6 Data Analytics Platform for Synchrophasor Data ... 62
6.1 Introduction ... 62 6.2 Sample Test ... 63 6.3 Performance ... 64 6.4 Test Results ... 65 6.5 Conclusion ... 67 Chapter 7 Conclusions ... 69 List of References ... 71 Appendix ... 77 Vita ... 90
List of Tables
Table 3-1 Two tiers of Real-time Applications ... 18
Table 3-2 Online Applications hosted by FNET/GridEye ... 19
Table 4-1 Connection String Properties ... 40
Table A-1 Units with GPS loss in 2009 ... 78
Table A-2 Monthly GPS loss in 2009 ... 78
Table A-3 Hourly GPS loss in 2009 ... 79
Table A-4 Units with GPS loss in 2010 ... 81
Table A-5 Monthly GPS loss in 2010 ... 81
Table A-6 Hourly GPS loss in 2009 ... 82
Table A-7 Units with GPS loss in 2011 ... 84
Table A-8 Monthly GPS loss in 2011 ... 84
Table A-9 Hourly GPS loss in 2011 ... 85
Table A-10 Units with GPS loss in 2012 ... 87
Table A-11 Monthly GPS loss in 2012 ... 87
List of Figures
Figure 1-1 FNET/GridEye structure ... 2
Figure 1-2 Map of FDR locations in North America. ... 3
Figure 1-3 Map of worldwide FDR coverage. ... 3
Figure 1-4 Frequency Disturbance Recorder ... 5
Figure 2-1 TCP sockets connection model ... 8
Figure 2-2 Functionality of data collection server ... 9
Figure 2-3 FDR configuration synchronization ... 10
Figure 2-4 Data Model of FDR Schema in the FNET Configuration Database ... 11
Figure 2-5 Timestamp shift caused by clock mismatch... 13
Figure 2-6 Timestamp correction algorithm ... 15
Figure 3-1 Online application dependency ... 21
Figure 3-2 Distributed data analytics system architecture ... 22
Figure 3-3 IAON Adapter layer design of Line Trip Trigger ... 28
Figure 3-4 Trigger threads with dependencies ... 28
Figure 3-5 Workflow of TPI ... 30
Figure 4-1 Line trip caused (a) frequency variation (b) voltage angle shift ... 32
Figure 4-2 Line trip detection block diagram ... 33
Figure 4-3 Signal outputs of each block of line trip detector ... 34
Figure 4-4 Sample cases tested by Matlab simulation ... 36
Figure 4-5 openPDC based FNET application architecture ... 37
Figure 4-6 IAON Adapter layer design ... 38
Figure 4-7 Alarm trigger mechanism ... 41
Figure 4-8 Display of filtered and de-trended frequency ... 42
Figure 4-9 Display of alarm trigger ... 42
Figure 5-1 Indicator of the GPS loss and recovery flag. ... 46
Figure 5-2 Indicator of GPS loss and how to detect a GPS loss. ... 47
Figure 5-3 Number of PMU GPS losses from 2009 to 2012 ... 49
Figure 5-4 Number of FDR GPS losses from 2010 to 2012 ... 49
Figure 5-5 Count of GPS loss recovery time of PMU data ... 51
Figure 5-6 Count of GPS loss recovery time of FDR data ... 51
Figure 5-7 Average monthly loss per unit of FDR ... 52
Figure 5-8 Average monthly loss per unit of PMU ... 52
Figure 5-9 Daily GPS loss pattern per PMU ... 53
Figure 5-10 Daily GPS loss pattern of all FDRs... 53
Figure 5-11 Daily pattern of number of satellites locked of FDRs... 55
Figure 5-12 GPS losses per unit in United States ... 55
Figure 5-13 Historical trend of solar activities [5] ... 57
Figure 5-14 GPS loss trend from 2010 to 2012 ... 57
Figure 5-15 Cyber-security test system setup ... 58
Figure 5-16 ICMP Ping latency with message length of 32, 64, 128 bytes ... 59
Figure 5-17 TCP Ping latency... 60
Figure 6-2 Count of EI events by month by hour of the day ... 65
Figure 6-3 Count of EI generator trip events by month by hour of the day ... 66
Figure 6-4 Count of EI load shedding events by month by hour of the day ... 67
Figure 6-5 Count of WECC load shedding events by month by hour of the day ... 68
Figure A-1 Monthly GPS loss in 2009. ... 79
Figure A-2 Hourly GPS loss in 2009. ... 80
Figure A-3 Monthly GPS loss in 2010. ... 83
Figure A-4 Hourly GPS loss in 2010. ... 83
Figure A-5 Monthly GPS loss in 2011. ... 86
Figure A-6 Hourly GPS loss in 2011. ... 86
Figure A-7 Monthly GPS loss in 2012. ... 89
Chapter 1
Overview of FNET System
1.1 IntroductionWith the increasing loads of power grids and massive inter-area power transfers enabled by the deregulation, it is very important to improve operators’ situational awareness. A Wide-area measurement systems (WAMS) consists of advanced measurement technology, information tools, and operational infrastructure that facilitate the understanding and management of the increasingly complex behavior exhibited by large power systems [1]. The Synchrophasor technologies, as the major components of the WAMS, provide significant information about the bulk power grid captured by Phasor Measurement Units (PMUs). Large volumes of data are streamed into a central data server in real-time. However, unless the server system is designed with the capability to efficiently process and analysis the data, system operators cannot exploit the information hidden in the data to assist the system operation or control.
Big data technologies are increasingly boosting the performance to handle data with large volume, high velocity and variety [2]. Introduction of the technologies like Hadoop and Spark could bring the smart grid data analytics to a new era, in which comprehensive analysis algorithms can be applied in real-time, and close-loop data solutions can be implemented for situation awareness, asset management, planning, fault detection and protection [3]. Some works has been done to study the availability using big data technologies for grid data storage [4], data processing [5], and data analysis [6]–[8]. However, most of these studies are based on simulation or offline data. More challenges
have to be solved to build an infrastructure for real-time data collection, analysis and visualization.
1.2 Frequency Monitoring Network (FNET/GridEye)
The FNET/GridEye system is a wide-area synchrophasor measurement network, which measures synchrophasor information at distribution level, as shown in Figure 1-1.Frequency and voltage phase angle information about system dynamics can be obtained using low-cost, high-accuracy Frequency Disturbance Recorder (FDR), which is a single phase version of PMU [9], [10].
Figure 1-1 FNET/GridEye structure
Since 2004, more than 150 FDRs have been deployed in United States and about 50 are deployed worldwide, as shown in Figure 1-2 and Figure 1-3. These measurements are then time-stamped and transmitted to the FNET/GridEye data center at the University of Tennessee, Knoxville for data processing and long-term storage. A variety of
Figure 1-2 Map of FDR locations in North America.
synchrophasor applications have been developed over FNET/GridEye situational awareness system, including real-time event detection and location estimation, oscillation detection and modal analysis, line trip detection, off-grid/islanding detection, and forensic authentication of digital evidence [9]–[19].
1.3 Frequency Disturbance Recorders
FDR is a GPS-synchronized single-phase PMU, which measures frequency, voltage magnitude and angle at distribution level. The first generation of FDRs was built in 2003, and it has expanded to three generations and several relative devices as shown in Figure 1-4.
The measurement data are transmitted to MCU and sent out to FNET servers through the network module by TCP/IP protocol. Timing synchronization of the measurement data is important for FDRs and FNET. Discrete Fourier Transform (DFT) is one of the common algorithms used in synchrophasor measurement area, and it is adopted as the basic framework of the FDR algorithm. The angle and frequency error of the most updated version of FDR is less than 0.005 degree and 0.00015Hz respectively at 60Hz nominal frequency.
1.4 Organization of Materials
The data collection server system and improvements are discussed in Chapter 2. The challenges and methods to develop real-time synchrophasor applications based on FNET/GridEye system is discussed in Chapter 3. An example application, real-time line trip detection, is illustrated in Chapter 4. The data quality and data security issues about synchrophasor applications are discussed in Chapter 5. A data analytics platform is
(a) (b)
(c) (d)
(e) (f)
Figure 1-4 Frequency Disturbance Recorder
(a) Generation I, (b) Generation II (c) Generation III (d)Universal Grid Analyzer (e) Wireless FDR (f) FDR on Smartphone
proposed to for big data applications in Chapter 6. The conclusions and future works are summarized in Chapter 7.
Chapter 2
Data Collection
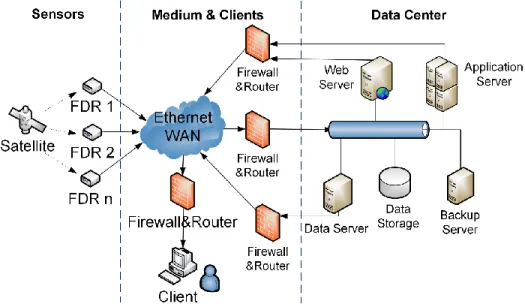
2.1 Data Collection Server SystemThe FNET/GridEye server system collect data from FDRs via internet connection. The FDRs are configured to set up TCP connections between the FDR data transmission interface and the FNET servers. Two servers in the system are programmed to communicate with FDRs directly, including a main data collection server and a backup server. Each of the FDRs are configured to create independent connections to the two servers using their server IP addresses as destination. (The backup server IP is set up using Google domain name service, so FDRs are configured to set connection to a domain name URL.)
Both main data collection server and backup server are programmed to handle three major functions, receiving data from internet, store received data locally, and forward the data stream to other servers for other application purposes. These functions are implemented using TCP sockets.
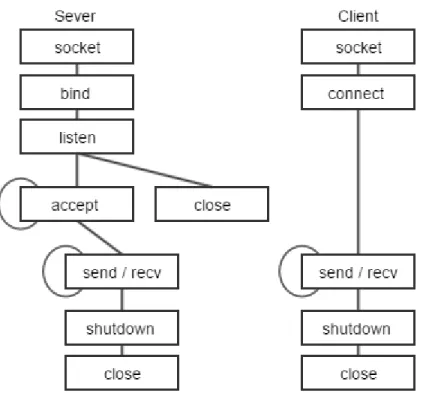
The TCP sockets are designed with client-server models, supporting guaranteed connection with three-way handshakes. A brief illustration of TCP socket model is shown in Figure 2-1. The TCP client is defined as the connection end which initiate the connection, while the TCP server is defined as the end which waits for connection to be requested. A basic TCP connection is built within a few steps: 1) The server creates a TCP socket, bind with its local IP address and port number, and start to listen to incoming connection requests; 2) the clients creates a TCP socket, and request a connection using the server IP and port number; 3) the server observes the connection request, it can accept
and process the request to setup the connection; 4) once the connection is configured, either the server side or the client side can send and receive data packets; 5) if the data transmission is finished, either the server or the client can close and destroy the socket and notify the other side.
Figure 2-1 TCP sockets connection model
In the data collection server, FDRs are the TCP clients and the server host is the server. However, when the data collection server forwards data to other servers, the sending server is the TCP client, and the receiving servers are considered as TCP server. In this case, the data is always transmitted from the TCP client to the TCP server. The data collection server is used as a proxy to forward data, as shown in Figure 2-2. Since each FDR is set to send data to a specific port, the number of listening and receiving socket
depends on the number of FDRs. For each of the FDR, the sever will create a list of forwarding sockets to connect to other servers. Therefore, the number of forwarding sockets depends on not only the number of FDRs, but also the number the remote servers that the data collection server forwards data to.
Figure 2-2 Functionality of data collection server
Once the FDR data is received, the serve will verify the received data packet, and store them in a local MS Access database. Also, the data will be send to screen display module if the unit is selected on the server program user interface. MS Access database is a light weight database system that has a capacity limit of 2GB. The server overcome this issue by automatically backup the Access files at certain time of the day.
2.2 FDR Configuration Synchronization
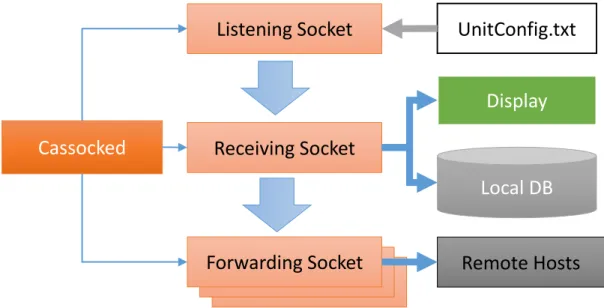
The problem of storing the FDR unit list using a text file is that each server has its own unit list, which makes it difficult to maintain. Instead of manually update the text file
Cassocked
Listening Socket
Receiving Socket
Forwarding Socket
Display
Remote Hosts
Local DB
UnitConfig.txt
on each server, a new scheme to synchronized the FDR unit configuration file is implemented using MySQL database.
All the servers in the FNET system query this MySQL database for the FDR information. Therefore, the FDR information are always synchronized among the servers. However, there are chances that the server hosting the MySQL database is not accessible, because of network failure or server failure. In this case, to ensure the other servers operate normally, each server also maintains its own local configuration files, as shown in Figure 2-3.
Figure 2-3 FDR configuration synchronization
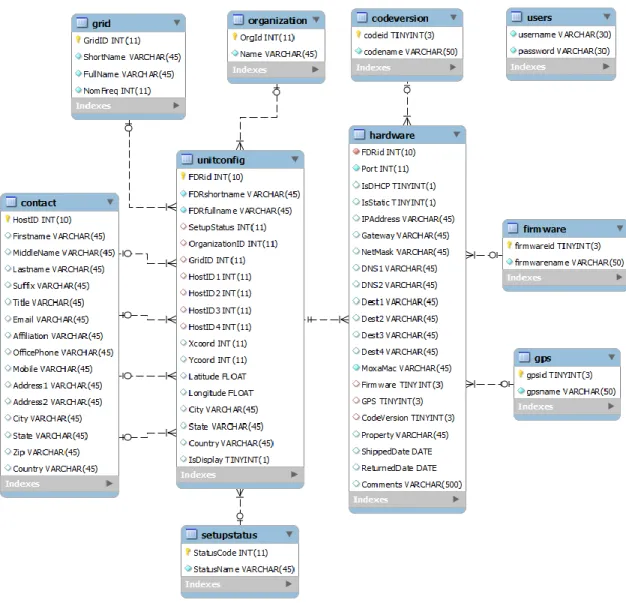
The FDR information, including their hardware information, IP address, operation status and the information about their hosts, are stored in a MySQL database, as shown in Figure 2-4.
Whenever a server needs to update its FDR configuration information, it trys to query the most updated information from the MySQL database. If the FDR information is
Main Server MySQL fdr fnetapp openhist … Web Forms Backup Server App Server Dev / Testing Server
Compare Local Config Create new Sockets Close Sockets Retrieve Config Local Unit Config
retrived, it compares the updated information with its local configuration files. The server will then decide which units are added to or removed from the system. Since the sockets has high resource consumption and depends on the number of FDRs and number of forwarding destinations, the serve can dynamically create and destroy sockets based on the diffence between the updated FDR list and the existing FDRs and sockets running in the server. In this way, the server resource consumption, including networking, computing and memory is significantly reduced.
To further simplify the process to update the FDR information for FDR distribution team, a web interface is developed to update the FDR list and the host information. With this scheme, the FDR information is easily updated, syncronized among difference servers, while the server performance is improved and the maintenance job is simplified.
2.3 Timestamp Correction
The early versions of FDRs, including the first generation and some second generation, have been observed with random timestamp shifts. The shift is caused by the mismatch of FDR local clock and the GPS synchronized timing system.
The FDR clock is driving by its local oscillator. However, this clock is affected by many factors like temperature. Thus, a universal clock is required to provide accurate clock synchronized across the system. Current FDRs and PMUs are using GPS signal to synchronize the clocks. FDRs synchronize its local clock by receiving a Pulse Per Second (PPS) signal from the onboard GPS module, and the timestamp is requested from the GPS module at the beginning of every second.
However, even though the PPS signal can be considered accurate, the timestamp can be shifted. For example, if the local clock runs faster than the GPS clock, the FDR will have a shorter length of “second” comparing the the GPS. It may request the timestamp twice at the beginning and the end of one local second, while both request are received within one GPS second. That will result a same timestamp obtained twice by the FDR. This phenomenon is called “overlapping second”. On the other hand, if the local clock runs slower than GPS clock, a “missing second” may occur, as shown in Figure 2-5
By investigating the data of all FDR units, most of the timestamp shifts occur in paris, which means a missing second is usually observed before or after a overlapping second. The time slot between a missing second and a overlapping second is usually within a few seconds, and most of them are one second. This is because the local clock is corrected by the PPS signal quickly after it shift away, then the shifted second will shift back whin in one second.
Figure 2-5 Timestamp shift caused by clock mismatch
1.0 1.1 1.2 … 1.9 1.0 1.1 1.2 … 1.9 3.0 3.1 3.2 … 3.9
Correct Timestamp
1.0 1.1 1.2 … 1.9 2.0 2.1 2.2 … 2.9 3.0 3.1 3.2 … 3.9
Shifted Timestamp
To correct the shifted timestamp, a correction algorithm is implemented on the data collection server, as shown in Figure 2-6. Once the TCP data stream is received by the receiving socket, and parsed by the data parsing function, the timestamp of the current data packet is buffered in a two-second processing queue. The timestamp processing queue store the timestamps received in the past to seconds, and the head of the queue is the timestamp received two second earlier. The “second” part of the timestamps are extracted and compared. If the timestamps are not increamentally consecutive, the timestamps in queue will be corrected based on the head timestamp of the queue, then the data in the queue will be pushed to the next processing module for further steps, including display, data forwarding and store to MS Access database. Otherwise, if the timestamps are verified to be correct, the data in the head of the queue are sent to the processing module directly.
By implementing this algorithm, the timestamps within two seconds are ensured to be increamentally consecutive. If the timeshift slot between the missing timestamp and the overlapping timestamp is greater than two second, this algorithm can not guarantee the timeshift over two second can shift back. However, since most of timestamp shift are within one second, this is a efficient solution. Test results show over 90% of the timestamp shifts can be corrected.
The timestamps shifts issue is compensated in the later version of FDR hardware. However, many of the old FDRs can not be replaced in a short time. The algorithm can be used to correct timestamp for either online data, or the stored historian data.
Figure 2-6 Timestamp correction algorithm 1.1 1.2 1.3 1.4 … 2.1 2.2 2.3 … CAsynSocket TCP DataStream 3.1 1 2 3
Timestamp Verification and Correction
Process Message Display Port Forwarding Save AccessDB Unit# .. Unit# ..
2.4 Conclusion
The data collection server received data from FDRs through TCP sockets. It store data in local database and forward them to other server systems. By synchronizing the FDR configuration information, the information updates and maintenance are simplified. The timestamp correction algorithm solves over 90% timestamp shift caused be clock mismatch.
Chapter 3
Real-time Synchrophasor Applications
3.1 MotivationsAs synchrophasor measurements and applications play a growingly critical role in the modern power systems, the number of FDRs has expanded to approach the limit of the originally designed system capacity. Also, an increasing number of real-time applications and data analytics algorithms have pushed the system to reach its computation limit. Thus, the FNET/GridEye system is proposed to be redesigned to incorporate the following features:
Scalability: The system is required to collect, store and process the data without delay as the number of FDRs continuously increases.
Extensibility: A variety of technologies developed in recent years to solve power system stability issues also requires the server system to include easy plug-in interface for adapting new applications.
Concurrency: More complex data analytical algorithms are introduced to the system, which requires higher computation capability. To ensure the data are processed in real-time, the server system should be able to execute applications in parallel by distributing the computation stress to multiple nodes.
Robustness: The system should be able to operate under stress and tolerate unpredictable or invalid input.
3.2 Synchrophasor Applications
Since 2006, the FNET/GridEye system has been developed to host a series of synchrophasor applications for power system monitoring and visualization. A list of currently implemented online applications is shown in Table 3-2.
Several other online applications are being developed or under test, including Fault-Induced Delayed Voltage Recovery (FIDVR) detection, dynamic Beta-value estimation, etc.
Beyond these online application, FNET/GridEye system also provides the platform supporting a variety of offline data analytics, including post-event analysis, long-term statistics, data quality analysis etc. [9].
3.2.1Real-time Online Applications
Synchrophasor applications are usually time sensitive. In the FNET/GridEye system, the online applications are divided into two tiers based on their response time, real-time application and near real-time applications, as shown in Table 3-1.
Table 3-1 Two tiers of Real-time Applications
Tier 1 Tier 2
Time constrains Real-time Near-real-time
Response Time <10s <2 min
Server Platform Data Server Application Server
Data Source Memory Historian
Sensor Units All units Selected units
Includes
(ID as shown in Table 3-2 )
1, 2, 3, 4, 5, 6 7, 8, 9, 10, 11,12*
*The response time of Video Replay depends on the video resolution and time length. It usually takes 5 to 10 minutes to render a video.
Table 3-2 Online Applications hosted by FNET/GridEye ID Application Description
1 Event Trigger Detects generator trip and load shedding by continuously monitoring the ROCOF of the incoming frequency data [11] 2 Oscillation
Trigger
Detects inter-area oscillation by monitoring the relative phasor angle [12]
3 Islanding Trigger Detects the situation in which a part of the grid becomes electrically isolated from the remainder of the power system [13]
4 Line Trip Trigger Detects a line outage event by monitoring sudden change but quickly damped frequency feature on local units [14]
5 Ambient Mode Analysis
Continuously analyzes system ambient oscillation frequency and damping ratio in real-time
6 Real-time Data Visualization
Web-based real-time data display in table, trend, and map format [15]
7 Event Location Estimates generation trip or load shedding event location using TDOA algorithm [16]
8 Frequency Response Analysis
Analyzes frequency excursion during events, estimates events MW amount, point A,B,C frequency etc. [17] 9 Oscillation Mode
Analysis
Estimates inter-area oscillation frequency, magnitude and damping ratio for dominate modes [12], [19]
10 Online Report Generates web-based online analytics reports for detected disturbances [15]
11 Email Alert Sends Email alert messages to registered customers about detected disturbances in real-time [10]
12 Event Video Replay
Automatically generates animation video for disturbances [15]
The real-time applications require fast reaction, usually in seconds. Thus the computation is designed to stay close to the data source. Trigger algorithms with minimum computation complexity are designed to achieve this goal with data read from buffered memory in the data server. In contrast, the Tier 2 applications obtained data from historian. This enables the applications to process time-aligned data with assured data quality. Tier 2 applications are developed to handle more complicated algorithms like location triangulation and oscillation mode analysis.
Although the time requirement of the Tier 2 applications are not as critical as those of Tier 1 applications, some data processing algorithms are still intensive for a computation node, especially when multiple applications request the CPU simultaneously.
3.2.2Online Applications Dependency and Priority
In many cases, the online applications cannot be isolated from each other. It is intuitional to hold the report and visualization for the results from other applications, and the Event Location executes only when the Event Trigger fires. However, there are some hidden links between certain applications. For instance, both the Event Trigger and the Oscillation Trigger analyze the incoming data streams of all FDR/PMU units, unless one or a few units are isolated from the rest of the power grid, which is detected by the Islanding Trigger. In this case, the Islanding Trigger has to execute in advance to provide the unit status for the other two triggers, even though they are all considered as Tier 1 application. Figure 3-1 demonstrates the dependency of the current online applications on FNET/GridEye system.
The dependency between applications purposes significant challenge for application distribution. Each of the applications has to be ranked with priority, and queued in the system to execute.
Figure 3-1 Online application dependency
3.2.3Offline Data Analytics
The offline analytics normally refers to applications which are not time sensitive, including but not limited to post-event analysis, statistical analysis, data quality analysis, system model validation, model reduction, social impact and forensic studies, etc. [9], [18]. These applications usually require extraction of large volume of data from historian, analysis data in temporal or spatial domain, and compare or integrate with data from other sources.
An example application could be a project to summarizing the GPS synchronization losses of all the FDR units in the past five years, and finding their relationship with local weather conditions. In this case, large volume data has to be processed, tabulated with location coordinates, and matched with data from historical weather report. For statistical
analysis like the example, big data analytics techniques and parallel processing are introduced to accelerate the computation speed.
3.3 System Architecture Design
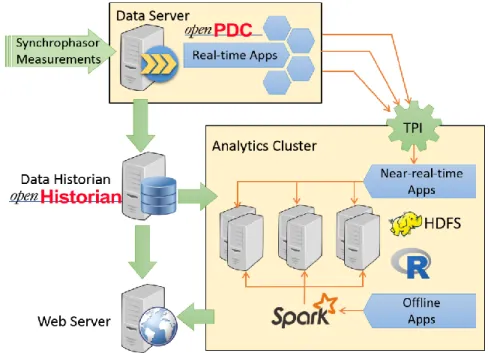
To solve the challenges brought by the real-time phasor applications, as well as to ensure the system scalability, extensibility, concurrency and robustness, a distributed computing architecture is proposed to host the server system and data analytics platform, as shown in Figure 3-2 .
Figure 3-2 Distributed data analytics system architecture
The proposed architecture consists of a data server, a data historian, a web server, and a computing cluster for data analytics. The synchrophasor data are collected by the data server through internet. Tier 1 applications are executed in the data server, processing real-time data from all income phasor measurements. The real-time phasor data are
concentrated and aligned with timestamps and dumped to historian. Also, the phasor data are scanned by the real-time triggers, which detect disturbances and send trigger messages to the analytics clusters.
The analytics cluster contains a series of computation nodes. Whenever the analytics cluster receives the trigger message, the trigger processing interface (TPI) finds its corresponding Tier 2 applications, and dispatches them to the computation nodes. Also, the TPI is responsible for loading the data from historian according to the requested time range. The applications are distributed into different node based on their computation complexity, so that the computation load is balanced.
For offline applications, the analytics cluster can be reused if there is no Tier 2 application being processed or waiting in queue. Multiple software packages, including Spark, Hadoop and R, are hosted on the cluster to support big data analytics.
The web server requests down-sampled data from the historian for real-time display, as well as publish disturbance analysis reports whenever it receives the processing results from analytics cluster.
By utilizing this design, the Tier 1 and Tier 2 applications are decoupled. Tier 1 applications stays close to the data source for its time-sensitivity, while Tier 2 applications are capable to process complex computation using the clusters. Both near-real-time applications and offline analytics can scale up easily by adding more computation nodes. Failure of any one application does not impact the other applications, or the performance of the whole system.
3.4 System Implementation
Following the proposed architecture, the distributed data collection and analytics system is implemented with each component elaborated in this section.
3.4.1Data Concentrator
The FNET/GridEye data server plays the role as a data concentrator that collects data from hundreds of FDRs around the world. Synchrophasor data are transferred to the server through TCP connections. Since the FDRs are developed as distributed level PMUs, the FDR data format is designed as a simplified version of IEEE C37.118 standard format [20], which only contains timestamp, frequency, angle, voltage information measured at the distribution level, as well as the GPS coordinates of each FDR unit. The openPDC developed by Grid Protection Alliance (GPA) is tailored to adopt FNET/GridEye data stream format [21], and serves as the server-side concentrator software for FNET/GridEye system. Once a connection is built, the data server continuously receives the data packet, parses data to structured format, and verifies data validity.
Even though the FDRs are synchronized with GPS time, and their data packets are labeled with timestamp, the network latency from a FDR to the data server is not guaranteed. This requires the data server to be synchronized with an accurate clock and to be able of tolerate minor delay from different FDR units.
The data server is synchronized with a NTP server clock to compensate the time drift effect caused by the inaccuracy of its local clock. Other clock sources, like atomic clock or eLoarn clock are optional to improve the timing accuracy of the server system [22].
The openPDC allows operator to customize the Lead Time and Lag Time parameters for the input data streams. The Lead Time represents the maximum time intervals that the server can accept if an arriving data packet has a timestamp ahead of local server clock. The Lag Time defines the maximum time that the server can wait for the data to arrive with a timestamp later than the local server clock [21]. The data server buffers all the incoming data within the Lead Time and Lag Time range, and then publish the data with the same timestamp as a collective measurement frame. The phasor data from all channels are sorted and aligned with the correct timestamps before they are dumped to the historian or transferred to other servers.
3.4.2Data Storage
The capability to write and read large volume of data with high speed is critical for the data historian. After exploration of a several relational databases, including MS Access and MySQL, and a variety of NoSQL databases, including MongoDB and Cassandra, the openHistorian 2.0 developed by GPA is selected to fulfill the requirements.
The openHistorian 2.0 is a file based storage system designed to efficiently integrate and archive SCADA, synchrophasor, digital fault recorder and other process control data to support real-time grid operations and post-disturbance analysis. It supports indexed data retrieval interface and lossless data compression, which largely saves the storage capacity of the historian. The archive files produced by the openHistorian are ACID Compliant [23], which create a very durable and consistent file structure that is resistant to data corruption. Internally the data structure is based on a B+ Tree that allows out-of-order data insertion.
It also provides high-speed APIs that can be customized for visualization of real-time and historical data, web-based data access and remote historian data extraction [24].
3.4.3Real-time Disturbance Detection
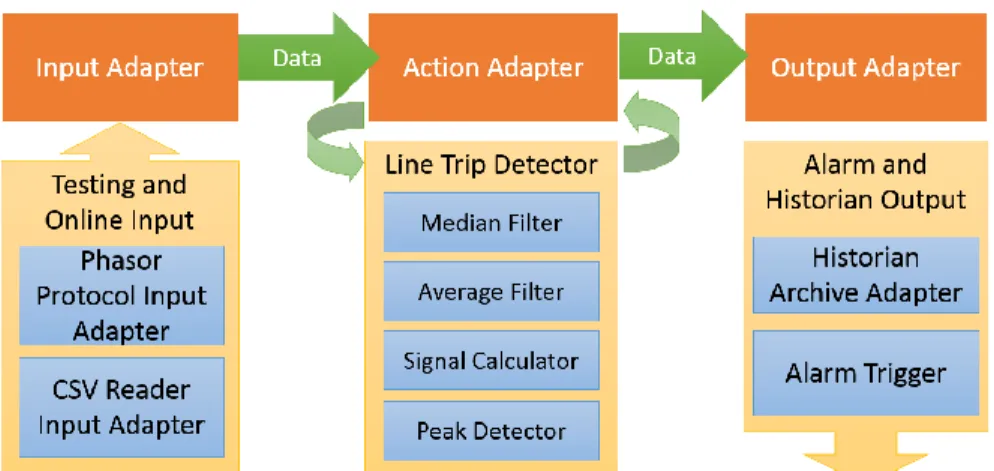
The major objective of real-time applications is to detect disturbance instantaneously. All the detection triggers are hosted in the data server, which has fast access to the data as soon as they are parsed and cached into the memory. The disturbance detection triggers are implemented by customizing the Input/Action/Output Interface (IAON) Adapters of the Grid Solutions Framework (GSF), which is the fundamental library collection of openPDC and openHistorian [21].
The real-time triggers, include event trigger, oscillation trigger, islanding trigger and line trip trigger etc., are extended from the action adapter class. The functions to process the measurement data are implemented as modular methods within the action adapter. Each of the triggers consists a series of modules to be executed in order. For instance, Figure 3-3 shows the implementation of the line trip trigger as an action adapter with series of function modules [14]. An input adapter and the historian output adapter are also included for testing purpose.
The triggers are fired if the final processing result exceeds the predefined threshold. The thresholds for these triggers are different for each power grid, thus the configuration parameters and thresholds are open to user for initialization and modification. Some of the commonly used functions, like the average or median filter are packaged as libraries to share across multiple triggers.
The triggers of each power grid interconnection are defined as a thread, so they can be executed in parallel. In practice, however, since the real-time trigger applications may have dependencies, they cannot be processed in the form of “embarrassingly parallelism”, but rather in a pipelined structure, as shown in Figure 3-4. In this case, Trigger 2 and 3 rely on the decision result of Trigger 1, thus they cannot make final decision before Trigger 1 thread publishes its results. Even if Trigger 2 completes the computation before Tigger 1, it holds the result until Trigger 1 finalizes the decision.
An example is the dependency between the islanding trigger and the others, as shown in Figure 3-1. If an FDR unit detects islanding from the rest of the system, it should not be counted for the event trigger or oscillation trigger. However, regional islanding is rare case in the power system. To ensure the real-time features of the trigger computation, event trigger and oscillation trigger calculate the preliminary results, and wait for the islanding trigger to confirm that islanding is not detected, then fire the alarm trigger. Otherwise, the two trigger have to remove the islanded unit and recalculate the results.
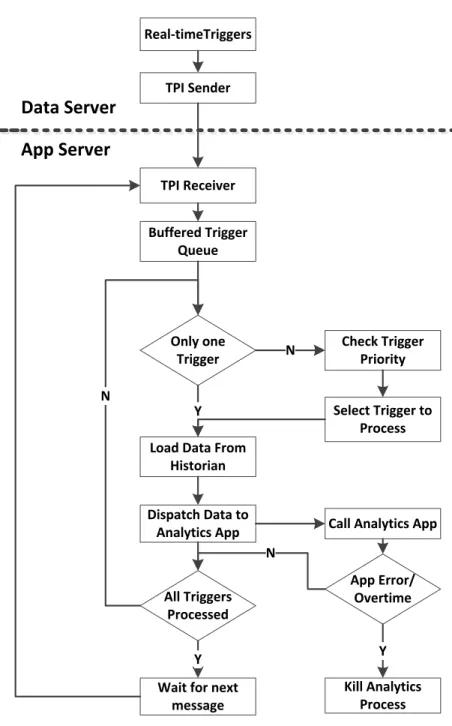
3.4.4Trigger Processing Interface
Since the real-time triggers are designed to detect disturbances as early as possible, the triggers are not capable of confirming the case without complete analysis. Some phasor features may create false alarms, and some may invoke multiple types of triggers. It is critical to retrieve more detailed data and perform more complicated analysis using the near-real-time applications. Detailed information including event location and oscillation modes can be estimated by retrieving data from the data historian and applying algorithms like Location Triangulation and Matrix Pencil methods.
Figure 3-3 IAON Adapter layer design of Line Trip Trigger
To implement the distributed data analysis platform as designed in Section III, the TPI is developed to facilitate the communication between the data server and the analytics cluster nodes, and to dispatch the analysis tasks and historian data to the proper applications.
The TPI is developed as a shell library with the functionality as shown in Figure 3-5. Whenever a real-time trigger is fired, the TPI sender broadcasts a trigger message to the analytics cluster though a UDP connection. The message is constructed by metadata of the trigger information, including the trigger type and the time range of relevant historian data.
The analytics cluster hosts a list of data analysis applications. The received trigger messages are queued in buffer, and checked with priority. Some disturbances may fire multiple triggers, for instance, a generator trip mixed with oscillation. It is necessary to analyze both of the generator trip and oscillation. However, in some other cases, like the measurement from an islanded unit shows a line trip like feature. Only the islanding should be considered in this case, while the line trip trigger can be treated as a false alarm. With the priority check, system operators can configure a ranked order that the data analytics applications should follow.
The TPI also provides interfaces to load historian data from openHistorian and dispatch the data to the suitable applications to process. In case any error occurs, the TPI has authority to kill the application process.
With the implementation of TPI, the analysis applications are fully decoupled and distributed to multiple nodes. The computation load is shared in balance, and future applications can be tested and deployed easily.
TPI Sender TPI Receiver Real-timeTriggers Buffered Trigger Queue Only one Trigger
Load Data From Historian Y Dispatch Data to Analytics App Check Trigger Priority N Select Trigger to Process All Triggers Processed N
Wait for next message
Y
Call Analytics App
App Error/ Overtime Kill Analytics Process Y N Data Server App Server
3.4.5Distributed Near-real-time analytics
The near-real-time analytics involves more comprehensive algorithms comparing to the real-time applications. The modules that take most of computation burden in these algorithms are usually the ones responsible for processing of the data from all FDRs. Because of this feature, the algorithms are naturally parallelizable. For instance, analysis of the oscillation frequency and damping ratio of each FDR using Matrix Pencil algorithm can be shared by multiple nodes on the cluster.
Unlike the statistical analysis of long term historian data, the input data size of the near-real-time applications is limited within a few minutes. Thus, even without utilizing the installed Hadoop HDFS file system, in-memory processing with multi-threads or MPI shows good performance for these applications. Other real-time processing techniques like Apache Storm or Spark Stream are being investigated to further boost the performance.
Chapter 4
Real-time Line Trip Detection
4.1 Algorithm DesignPrevious study shows that both frequency and phase angle are informative for line outage detection, as frequency variations directly reflect the machine rotational speed thus related to the generation and load, and voltage phase angle is related to the power flow distribution in the power network [3].
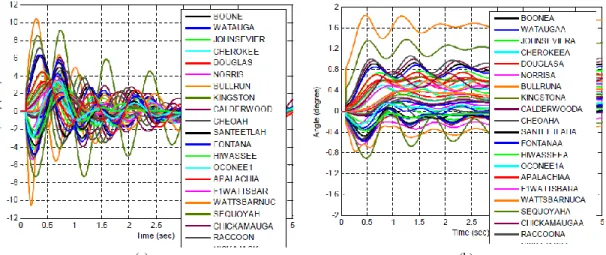
From simulation and observed measurements, line trip events impact only the nearby system on both sides of the tripped line: frequency rises suddenly on the power sending side and drops on the power receiving side. At the same time, voltage angles shift rapidly from their original value. Figure 4-1 shows the simulation results of tripping a 500kV line in the TVA system [3].
(a) (b)
Figure 4-1 Line trip caused (a) frequency variation (b) voltage angle shift
However, since they are widely deployed at distribution level, their angle measurements may not reflect the transmission level angle change caused by line trip. It is practical to develop the line trip detector based on frequency variations for higher accuracy. Based on the characteristics of frequency variation, an algorithm is developed to detect such events. The block diagram of this algorithm is shown in Figure 4-2.
Figure 4-2 Line trip detection block diagram
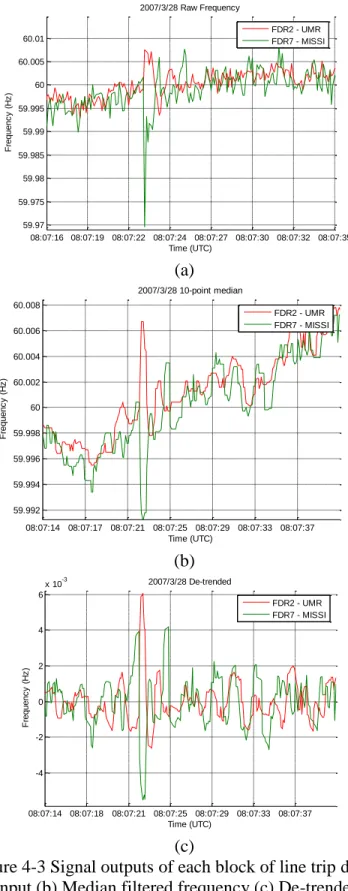
A sample line trip event is presented in Figure 4-3 to explain the algorithm. The signals from two FDRS at the sending side and the receiving side respectively are shown in this figure. Figure 4-3(a) shows the raw frequency data where the line trip introduced oscillations are observable together with other high-frequency noises and possible local dynamics in the distribution network. The first low-pass filter in the block diagram in Figure 4-2 is to remove the high-frequency noises in the raw frequency and a moving median filter is used. The filtered frequency data is shown in Figure 4-3(b).
Then the filtered frequency is fed into the second low-pass filter, a moving average filter, to get the trend of frequency data which is then subtracted from the filtered data. The signal of interest in the line trip detection is the oscillation caused by the line outage, so de-trending is necessary to remove the effects of the data trend and maintain the oscillatory
(a)
(b)
(c)
Figure 4-3 Signal outputs of each block of line trip detector (a) Raw input (b) Median filtered frequency (c) De-trended frequency
08:07:16 08:07:19 08:07:22 08:07:24 08:07:27 08:07:30 08:07:32 08:07:35 59.97 59.975 59.98 59.985 59.99 59.995 60 60.005 60.01 Time (UTC) Fr e q u e n c y ( H z ) 2007/3/28 Raw Frequency FDR2 - UMR FDR7 - MISSI 08:07:14 08:07:17 08:07:21 08:07:25 08:07:29 08:07:33 08:07:37 59.992 59.994 59.996 59.998 60 60.002 60.004 60.006 60.008 Time (UTC) Fr e q u e n c y ( H z ) 2007/3/28 10-point median FDR2 - UMR FDR7 - MISSI 08:07:14 08:07:18 08:07:21 08:07:25 08:07:29 08:07:33 08:07:37 -4 -2 0 2 4 6 x 10⁻³ Time (UTC) Fr e q u e n c y ( H z ) 2007/3/28 De-trended FDR2 - UMR FDR7 - MISSI
part at the same time. Figure 4-3(c) shows the de-trended data which becomes zero-mean signals and the rapidly varying components of the original frequency are clearly presented. Two thresholds are set to detect the initial frequency peaks during the first swing of the de-trended signal. It has been observed that the oscillations caused by line trips are usually well-damped, which means that the peak values of the oscillations are descending. Within a two-second time window, if the first peak is larger than the higher threshold and the second peak exceeds the lower threshold, the algorithm will throw a trigger flag and generate reports. The two-second time window is decided based on observations from measured line trip events as well as simulation results that the period of the first swing is usually less than two seconds.
4.2 Simulation Results
The frequency based detection algorithm is programmed in MATLAB to verify its performance. The program is tested with confirmed historical line trip event data observed by FNET/GridEye. Some selected test results are demonstrated below.
Figure 4-4(a) shows the results of line a trip event that occurred on April 11, 2007, observed by four FDR units, while Figure 4-4(b) shows another event on May 14, 2008, seen by six FDR units. From the above tested results, the de-trended frequency is effective to detect line trip events if the thresholds are chosen properly. To summarize the simulation results, 48 line trip events out of 63 are detected.
(a)
(b)
Figure 4-4 Sample cases tested by Matlab simulation (a)Line trip event on 2007/4/11 (b) Line trip event on 2008/5/14
19:03:15 19:03:17 19:03:19 19:03:21 19:03:23 19:03:25 19:03:27 19:03:29 59.966 59.969 59.972 59.975 59.978 59.981 Time (UTC) F re q u e n c y ( H z ) 2007/4/11 10-point median FDR2 - UMR FDR7 - MISSI FDR31 - UK FDR32 - TVA7 15:06:02 15:06:04 15:06:06 15:06:08 15:06:11 15:06:13 15:06:15 15:06:17 60.01 60.012 60.014 60.016 60.018 60.02 60.022 60.024 Time (UTC) F re q u e n c y ( H z ) 2008/5/14 10-point median FDR2 - UMR FDR7 - MISSI FDR42 - FSU FDR514 - SC FDR523 - TTU FDR554 - Louisvill
4.3 Application Development
4.3.1Application Architecture
This application serves as a part of the FNET/GridEye trigger application framework. The new generation of the FNET/GridEye system is based on openPDC platform, as shown in Figure 4-5.
Figure 4-5 openPDC based FNET application architecture
In the architecture diagram, the openPDC provides the fundamental infrastructure for the historian database and data connections. The Time Series Framework assembles real-time data stream through TCP or UDP ports. It also provides the interface to communicate with OpenHistorian, the file based real-time database. Phasor Protocol Layer provides varies protocols to parse received data, such as BPA, IEEE C37.118 and FNET data format.
On top of the openPDC platform, a code library is developed for the FNET/GridEye with some commonly used program modules, such as median filter, average filter and peak
detector. The real-time trigger applications, including line-trip trigger, are developed by assembling modules from the code library. FNET/GridEye system provides rich alert system and visualization interface, which are shared by real-time triggers.
4.3.2Adapter Design
To implement line trip trigger application on openPDC platform, the concept of Input/Action/Output Interface (IAON) Adapter is introduced by the Time Series Framework. Each of these adapters is a base class: Input Adapters handle the functions of reading and parsing data stream, Action Adapters are in charge of data manipulation, and Output Adapters format the output data, as shown in Figure 4-6.
Figure 4-6 IAON Adapter layer design
The FNET data format is included in the Phasor Protocol library. For real-time trigger applications, a Phasor Protocol Input Adapter is used to parse input data stream from TCP port. It forwards the parsed data to both the Action Adapter and the Output Adapter. The Historian Archive Adapter packs the parsed raw data to the OpenHistorian
format and stores it in the historian files. The CSV Reader Adapter is developed to replay historical FNET line trip event for testing purpose.
Signal processing functions mentioned in the previous section, such as peak detector and low pass filters, are implemented as Action Adapter, which is the major part of application development. The Line Trip Detector plays the role of the main function that calls the other modules and triggers the alarm. The Signal Calculator is a pre-developed adapter in openPDC library to perform simple mathematical calculation of signal measurements, such as addition and multiplication. Signal processing modules are triggered in the order given by the algorithm. Each of them processes a short interval of measurement data and sends its calculation results to the next module. Once Line Trip Detector collects the final results, it compares the results to the predefined threshold and check if the alarm should be triggered.
To enhance the flexibility of adapters, the openPDC platform enables users to define parameters as Connection Strings, in which users can specify the input signal, output signal and other critical arguments, such as threshold values, for each adapter.
Error! Reference source not found. lists some of the parameters defined for line t rip detection. Line Trip Detector class reads these parameters from the user interface, and forwards them to their destination modules. Different parameters may apply in various conditions. For instance, the thresholds may change in different interconnections. By tuning these parameters based on historical data, the accuracy of the line trip trigger can be improved such that it can reject false alarms efficiently.
Table 4-1 Connection String Properties
Name Type Description
detectionWindowSize INT Number of frames for detection (buffer size)
averageFilterSize INT Window length of mean filter medianFilterSize INT Window length of median
filter
firstPeakThreshold FLOAT Threshold value of the first peak during line trip secondPeakThreshold FLOAT Threshold value of the
second peak during line trip minValidNodes INT Number of node seeing line
trip event to trigger alarm
4.3.3Alarming
Once a line trip event is detected by the peak detector module, it reports to the Line Trip Detector to trigger an alarm signal. The alarm is designed to be a binary output signal, which is obtuse to sudden change of input with a user defined delay to avoid false alarm, and hysteresis condition is considered when the alarm is cleared. As shown in Figure 4-7, the alarm is triggered when the value exceeds the threshold and stays above the threshold for a certain amount of time. The alarm is cleared when the value drops to a hysteresis point, which is lower than the alarm trigger threshold [2].
The alarm threshold is determined based on historical line trip events. The threshold Sthreshold is calculated by the following equation.
where SLT is empirical signal magnitude when line trip occurs, and SnonLT is empirical signal magnitude when there is no fault event. Thus, the threshold is set to be the mean
point between the minimum peak value when events occur and the maximum signal noise when there is no event.
Figure 4-7 Alarm trigger mechanism
4.4 Test Results
The Application is tested with confirmed historical line trip events. Based on these historical data, some critical parameters are decided. The median filter window size is set to 7 points, while the average filter size is chosen to be 31 points. Figure 4-8 and Figure 4-9 show a sample test result on openPDC Manager, based on a line trip event observed by an FDR device near Rolla, Missouri, on March 28, 2007.
It can be seen from Figure 4-8 that the median filter effectively removed the high frequency noise, but preserved the frequency characteristics at the edges (blue trace). By subtracting the trend signal detected by the average filter (green trace), the frequency pulse change caused by the line trip event was significantly boosted from the ambient frequency (red trace). Note that the de-trended frequency (red trace) is scaled to fit in the display.
Figure 4-9 demonstrates the peak detection mechanism of the above line trip event. With the detection window set to two seconds (20 points), the peak detector continuously
Figure 4-8 Display of filtered and de-trended frequency
calculates the maximum and minimum values of the de-trended frequency within the last 2 seconds. The threshold of the first peak is set to 0.0045 Hz and that of the second peak is 0.0025 Hz based on empirical values. Once the peaks of the de-trended frequency exceed the thresholds, the binary alarm signal is triggered to 1. In this case, the maximum value reaches the first peak threshold first, and the minimum value hits the negative second peak threshold immediately after. The alarm signal is cleared after two seconds when the detection window shifts to upcoming data stream.
A warning message pops up to openPDC console with the event time stamp as soon as a line trip event is detected. Further reporting formats such as email reminder and graphic report are being developed.
4.5 Conclusion
This paper proposed a frequency based line trip detection algorithms and it is verified through actual line trip data. Utilizing the openPDC platform, the frequency-based detection algorithm is implemented as a real-time online application, which consists of median filter, average filter, signal calculator and peak detector. These modules are included in FNET/GridEye application library for other applications. Test results shows that the system effectively detects line trip events and set the proper alarms.
The angle based algorithm will be tested and implemented for line trip detection as the next step. Multi-channel detection will be considered to improve the detection accuracy and to provide the possibility to locate the event. Since line trip events often occur in companion with other faults such as generation trips or load changes. Further study will
show the sensitivity of the line trip trigger and possible approaches to separate it from other events.
Chapter 5
Synchrophasor Data Quality and Security
5.1 IntroductionSynchrophasor data quality are affected by many factors. One of the major reasons for low quality data is GPS signal losses. Accurate timing source is vitally important for PMUs. Correct operation of a PMU requires a common and accurate timing reference. The timing reference is described in IEEE Std. C37.118.1-2011. To achieve a common timing reference for the PMU acquisition process, it is essential to have a source of accurate timing signals (i.e., synchronizing source) that may be internal or external to the PMU. For internal, the synchronization source is integrated into the PMU but external global positioning system (GPS) antenna still required. In the latter case, the timing signal is provided to the PMU by means of an external source, which may be local or global, and a distribution infrastructure (based on broadcast or direct connections). Within a PMU, a phase-locked oscillator is used to generate the time tags within the second. The time tag is sent out with the phasors. Thus if a phasor information packet arrives out of order to a phasor data concentrator (PDC), the phasor time response can still be assembled correctly. If the GPS pulse is not received for a while, the time tagging error may result in significant phase error.
The time system of a PMU based is depicted in Figure 5-1. The standard temporal reference of this system is generated with a signal of one pulse per second (one PPS) from a GPS. This pulse as received by any receiver on earth is coincident with all other received pulses to within 1 microsecond. PPS signal is used for sampling the analog data. The GPS
time does not take into account the earth’s rotation. Corrections to the GPS time are made in the GPS receivers so that they provide UTC clock time.
GPS Receiver Phase-Locked Oscillator Phase Micro-Processor One Pulse per second Second of Century Counter GPS Antenna A/D
Figure 5-1 Indicator of the GPS loss and recovery flag.
This project studies the GPS loss by processing the historical PMU data from 2009 to 2012. The statistics of four-year GPS loss is implemented, in particular, the name of units, starting and ending time, and duration are recorded. Yearly, monthly and hourly loss are the selected statistical quantity. But comparison of the above quantity, we can have a clear picture of GPS loss in PMUs.
5.2 Methodology
The latest PMU/PDC protocol is the IEEE C37.118-2011 that was developed in the last few years. By monitoring the value of the 13th bit of the STATUS flag defined in the IEEE Standard C37.188.1-2011, we can get the number and duration of GPS loss, which flow chart is shown in the Figure 5-2.
1
GPS Status
0
1
GPS Status
0
GPS Loss
GPS Recovery
Duration
PMU Status Flag (16 bit)
13
Indicator of GPS Status
0
0
1
Load PMU data
Check the status flag in the PMU file
Is GPS loss or GPS recovery? End No Is finished? No Yes Yes
Figure 5-2 Indicator of GPS loss and how to detect a GPS loss. (a) Indicator of the GPS loss and recovery flag.
The one-bit GPS status flag is used as the indicator of GPS loss: “0”-status indicates that the PMU is with GPS timing signal whereas “0”-status means without GPS signal. So by monitoring the variance of the GPS flag, we can see when the GPS loss started and ended, and how long the loss was.
On the algorithm shown in Figure 5-2(a), a tool for detecting the GPS loss in PMU data is developed by Microsoft Visual Studio C# 2012, whose user interface is shown in Figure 5-2(b). Thus, the tool is used to obtain the statistical results of PMU GPS loss from 2009 to 2012.
FDR data does not include GPS information in every data frame. Instead, it updates the number of locked GPS satellites every 1 minute, which can be considered as the strength of the timing signal. Thus, the PMU data give the GPS loss information in higher resolution, while FDR data provide more information about GPS strength.
5.3 Temporal Patterns of GPS Losses
As the more PMUs and FDRs are deployed over the past years, more GPS loss are observed. Figure 5-4 shows the number of monthly GPS losses from 2010 to 2012. The total number of FDRs increased from 53 in Jan 2010 to 131 in Dec 2012. Over 50% of the FDRs suffer from frequent GPS Timing losses. Similarly, over 50% of the sampled PMUs detected GPS loss.
26 34 64 83 2009 2010 2011 2012 0 20 40 60 80 Numbe r o f PMU Units Year
Figure 5-3 Number of PMU GPS losses from 2009 to 2012
5.3.1Loss-recovery time
Both PMU and FDR data shows that the number of GPS losses decreases exponentially as recovery time increases. Most of GPS losses recover within a short period of time. For FDR data, since there is a forced coasting period of 1 or 2 hours, (FDR stops sending data if lose GPS timing over 1 or 2 hours), there are high count values at 60 minutes and 120 minutes.
5.3.2Monthly Trend
Figure 5-7 and Figure 5-8 shows the trend of average monthly loss per unit of FDRs and PMUs. No obvious seasonal or monthly trend was found.
5.3.3Daily Trend
From PMU or FDR data, we observed that some unit lost GPS more frequently in certain hours in a day. However, there is no obvious pattern detected that matches for all the units.
With the FDR data include the number of GPS satellites locked per minute, we are able to exam more details of GPS signal strength. Figure 5-11 shows the number of satellites of an FDR in days.
The four figures show four FDRs which (a) has always strong GPS signal;(b) has always weak GPS signal; (c) has a daily pattern, that tend to lost GPS at around 9AM every day; (d) has no obvious daily pattern, but never loss GPS timing.
Figure 5-5 Count of GPS loss recovery time of PMU data
Figure 5-7 Average monthly loss per unit of FDR 197.5 166.9 255.5 82.9 174.7 67.9 287.5 136.8 323.1 338.3 499.1 26.2 0.4 6.6 5.7 6.8 4.4 3.9 0.8 2.2 0.3 25.3 9.5 24.8 Jan Feb Mar Apr May Jun Jul Aug Sep Oct Nov Dec 0 200 400 600
Number of Loss (per unit)
0 10 20 30
Mean Duration (per loss, sec)
20 5.5 11 4.3 10 9.6 77 .9 18 6.7 10 5.0 10 8.4 76 .1 96.9 12 8.6 32 4.1 14 2.5 15 2.2 16 4.2 16 1.5 94 .4 11 9.0 15 4.5 34 8.4 21 7.7 16 9.9 13 1.9 11 0.8 99 .9 1.7 8.8 8.8 8.9 5.8 8.8 9.7 8.9 8.8 5.3 2.2 5.1 7.6 5.6 7.3 13.7 11.7 7.8 4.2 7.7 7.1 8.1 8.1 8.6 2 4 6 8 10 12 14 16 18 20 22 24 0 100 200 300 400 Num ber of Lo ss (p er u nit ) 0 4 8 12 16
Mean Duration (per loss
, sec)
Figure 5-9 Daily GPS loss pattern per PMU
Since FDR need at least one GPS satellite locked to synchronize timing, the number of GPS locked can be represented as the number of backups the timing signal has, named timing signal strength. If a FDR is not locked with any GPS satellite, it losses timing synchronization. With good GPS signal reception, a receiver should be able to see 4 to 12 GPS satellites [2]. However, FDRs are usually installed indoor with a directional GPS antenna instead of an omnidirectional antenna, the GPS reception may be affected by whether the antenna is installed at a window with open view to the sky. The GPS signal may be blocked or reflected by buildings or other obstacles in certain times of the day, which can cause a daily pattern as shown above.
More analytics result from PMU data are included in Appendix.
5.4 Spatial Patterns of GPS Losses
We counted the number of GPS losses of each unit across the United States, as shown in Figure 5-12. Theoretically, the GPS signal strength is affected by the latitude of the sensor location [2]. However, no significant geological pattern was observed in real data.
5.5 Impact of Weather/ Space Weather
GPS signal strength is also affected by space weather, especially solar activities. [3] The largest solar activity in the last 6 years happened on March 7, 2012 00:24 UTC – the sun unleashed an X5.4-class solar flare. However, no obvious impact was detected on the overall FDR data.
Historical weather reports are studied as well. No obvious relationship was found between GPS loss and local temperature or precipitation. Offline Experiments.
(a) (b)
(c) (d)
Figure 5-11 Daily pattern of number of satellites locked of FDRs
5.6 Data Security and Encryption
Data security is a critical concern in synchrophasor measurements. IEEE standard C37.118.2-2011 defines synchrophasor data transfer format and communication protocol. As the standard specifies, phasor measurement system commonly use the IP over network communication. At transport layer, either TCP or UDP or a combination of both can be used to transfer data and configuration commands [15]. However, there is no encryption method included in the standard, which exposes synchrophasor data to cyber-attacks.
To enhance the confidentiality of synchrophasor data, an encryption system is proposed by Scout Industries and tested with FNET. The system setup is demonstrated in Figure 5-15.
As shown in the Figure 5-15, a pair of hardware encryptors is added to the connection between PMU/FDR and the Phasor Data Concentrator (PDC) server. The encryptors installed for the test are Certes CEP10 modules, as shown in Figure 5-15, which enables 10 Mbps, full duplex data encryption. The CEP10 modules offer multi-layer security, including IP packet encryption for Layer 3 networks, and Layer 4 data payload encryption for IP and MPLS networks [16]. Each CEP 10 provides three ports for the network connection: PMU/FDR and PDC server are connected to Local (L) port; Remote (R) port is to transfer data over the network; Management (M) port is connected to an encryption server, TrustNet Manager. TrustNet Manager is a web based server platform to configure and manage the encryption policies, and to update