A 2.4% DETERMINATION OF THE LOCAL VALUE OF THE HUBBLE CONSTANT
*Adam G. Riess1,2, Lucas M. Macri3, Samantha L. Hoffmann3, Dan Scolnic1,4, Stefano Casertano2,
Alexei V. Filippenko5, Brad E. Tucker5,6, Mark J. Reid7, David O. Jones1, Jeffrey M. Silverman8, Ryan Chornock9, Peter Challis7, Wenlong Yuan3, Peter J. Brown3, and Ryan J. Foley10,11
1
Department of Physics and Astronomy, Johns Hopkins University, Baltimore, MD, USA;[email protected]
2
Space Telescope Science Institute, Baltimore, MD, USA
3
George P. and Cynthia Woods Mitchell Institute for Fundamental Physics and Astronomy, Department of Physics & Astronomy, Texas A&M University, College Station, TX, USA
4
Kavli Institute for Cosmological Physics, University of Chicago, Chicago, IL, USA
5
Department of Astronomy, University of California, Berkeley, CA, USA
6
The Research School of Astronomy and Astrophysics, Australian National University, Mount Stromlo Observatory, Weston Creek, ACT, Australia
7
Harvard-Smithsonian Center for Astrophysics, Cambridge, MA, USA
8
Department of Astronomy, University of Texas, Austin, TX, USA
9
Astrophysical Institute, Department of Physics and Astronomy, Ohio University, Athens, OH, USA
10
Department of Physics, University of Illinois at Urbana-Champaign, Urbana, IL, USA
11
Department of Astronomy, University of Illinois at Urbana-Champaign, Urbana, IL, USA
Received 2016 March 21; revised 2016 May 13; accepted 2016 May 16; published 2016 July 21 ABSTRACT
We use the Wide Field Camera 3(WFC3)on theHubble Space Telescope(HST)to reduce the uncertainty in the local value of the Hubble constant from 3.3% to 2.4%. The bulk of this improvement comes from new near-infrared(NIR) observations of Cepheid variables in 11 host galaxies of recent type Ia supernovae(SNeIa), more than doubling the sample of reliable SNeIa having a Cepheid-calibrated distance to a total of 19; these in turn leverage the magnitude-redshift relation based on∼300 SNeIa atz<0.15. All 19 hosts as well as the megamaser system NGC 4258 have been observed with WFC3 in the optical and NIR, thus nullifying cross-instrument zeropoint errors in the relative distance estimates from Cepheids. Other noteworthy improvements include a 33% reduction in the systematic uncertainty in the maser distance to NGC 4258, a larger sample of Cepheids in the Large Magellanic Cloud (LMC), a more robust distance to the LMC based on late-type detached eclipsing binaries(DEBs),HSTobservations of Cepheids in M31, and new HST-based trigonometric parallaxes for Milky Way (MW) Cepheids. We consider four geometric distance calibrations of Cepheids:(i)megamasers in NGC 4258,(ii)8 DEBs in the LMC,(iii)15 MW Cepheids with parallaxes measured with HST/FGS, HST/WFC3 spatial scanning and/or Hipparcos, and (iv)2 DEBs in M31. The Hubble constant from each is 72.25±2.51, 72.04±2.67, 76.18±2.37, and 74.50±3.27 km s−1Mpc−1, respectively. Our best estimate of H0=73.24±1.74 km s−1Mpc−1 combines the anchors NGC 4258, MW, and LMC, yielding a 2.4% determination(all quoted uncertainties include fully propagated statistical and systematic components). This value is 3.4σhigher than 66.93±0.62 km s−1Mpc−1predicted byΛCDM with 3 neutrinoflavors having a mass of 0.06eV and the newPlanckdata, but the discrepancy reduces to 2.1σrelative to the prediction of 69.3±0.7 km s−1Mpc−1 based on the comparably precise combination ofWMAP+ACT+SPT+BAO observations, suggesting that systematic uncertainties in CMB radiation measurements may play a role in the tension. If we take the conflict betweenPlanck high-redshift measurements and our local determination ofH0at face value, one plausible explanation could involve an
additional source of dark radiation in the early universe in the range ofΔNeff≈0.4–1. We anticipate further significant improvements inH0from upcoming parallax measurements of long-period MW Cepheids.
Key words:cosmological parameters–cosmology: observations–distance scale–galaxies: distances and redshifts Supporting material:machine-readable tables
1. INTRODUCTION
The Hubble constant (H0) measured locally and the sound
horizon observed from the cosmic microwave background radiation (CMB) provide two absolute scales at opposite ends of the visible expansion history of the universe. Comparing the two gives a stringent test of the standard cosmological model. A significant disagreement would provide evidence for fundamental physics beyond the standard model, such as time-dependent or early dark energy, gravitational physics beyond General Relativ-ity, additional relativistic particles, or nonzero curvature. Indeed, none of these features has been excluded by anything more
compelling than a theoretical preference for simplicity over complexity. In the case of dark energy, there is no simple explanation at present, leaving direct measurements as the only guide among numerous complex or highly tuned explanations.
Recent progress in measuring the CMB from WMAP (Bennett et al.2013; Hinshaw et al.2013)and Planck(Planck Collaboration et al.2016)have reduced the uncertainty in the distance to the surface of last scattering (z∼1000) to below 0.5% in the context of ΛCDM, motivating complementary efforts to improve the local determination ofH0to percent-level
precision(Suyu et al.2012; Hu2005). Hints of mild tension at the∼2–2.5σlevel with the 3%–5% measurements ofH0stated
by Riess et al. (2011), Sorce et al. (2012), Freedman et al. (2012), and Suyu et al. (2013) have been widely considered and in some cases revisited in great detail(Bennett et al.2014; © 2016. The American Astronomical Society. All rights reserved.
* Based on observations with the NASA/ESA Hubble Space Telescope,
obtained at the Space Telescope Science Institute, which is operated by AURA, Inc., under NASA contract NAS 5-26555.
Dvorkin et al. 2014; Efstathiou 2014; Spergel et al. 2015; Becker et al. 2015), with no definitive conclusion except for highlighting the value of improvements in the local observa-tional determination ofH0.
1.1. Past Endeavors
Considerable progress in the local determination of H0has
been made in the last 25 years, assisted by observations of water masers, strong-lensing systems, supernovae (SNe), the Cepheid period–luminosity (P–L) relation (also known as the Leavitt law; Leavitt & Pickering1912), and other sources used independently or in concert to construct distance ladders (see Freedman & Madore 2010; Livio & Riess 2013, for recent reviews).
A leading approach utilizes Hubble Space Telescope (HST) observations of Cepheids in the hosts of recent, nearby SNeIa to link geometric distance measurements to other SNeIa in the expanding universe. The SNIa HST Calibration Program (Sandage et al. 2006) and the HST Key Project (Freedman et al.2001)both made use ofHSTobservations with WFPC2 to resolve Cepheids in SNIa hosts. However, the useful range of that camera for measuring Cepheids, 25 Mpc, placed severe limits on the number and choice of SNeIa that could be used to calibrate their luminosity (e.g., SNe 1937C, 1960F, 1974G). A dominant systematic uncertainty resulted from the unreliability of those nearby SNeIa which were photographically observed, highly reddened, spectroscopically abnormal, or discovered after peak brightness. Only two objects(SNe 1990N and 1981B)used by Freedman et al.(2001,2012)and four by Sandage et al.(2006) (the above plus SN 1994ae and SN 1998aq)were free from these shortcomings, leaving a very small set of reliable calibrators relative to the many hundreds of similarly reliable SNeIa observed in the Hubbleflow. The resulting ladders were further limited by the need to calibrate WFPC2 at lowflux levels to the ground-based systems used to measure Cepheids in a single anchor, the Large Magellanic Cloud (LMC). The use of LMC Cepheids introduces additional systematic uncertainties because of their shorter mean period (DálogPñ≈0.7 dex) and lower metallicity (Dlog O H( )=−0.25 dex, Romaniello et al.2008) than those found with HSTin the large spiral galaxies that host nearby SNeIa. Despite careful work, the estimates ofH0by the
two teams(each with 10% uncertainty)differed by 20%, owing in part to the aforementioned systematic errors.
More recently, the SH0ES(SNe,H0, for the Equation of State
of dark energy) team used a number of advancements to refine this approach to determiningH0. Upgrades to the instrumentation
ofHSTdoubled its useful range for resolving Cepheids(leading to an eight-fold improvement in volume and in the expected number of useful SNIa hosts), first with the Advanced Camera for Surveys(ACS; Riess et al.2005,2009b)and later with the Wide Field Camera 3(WFC3; Riess et al.2011, hereafterR11)owing to the greater area, higher sensitivity, and smaller pixels of these cameras. WFC3 has other superior features for Cepheid reconnaissance, including a white-lightfilter(F350LP)that more than doubles the speed for discovering Cepheids and measuring their periods relative to the traditional F555W filter, and a 5 arcmin2near-infrared(NIR)detector that can be used to reduce the impact of differential extinction and metallicity differences across the Cepheid sample. A precise geometric distance to NGC 4258 measured to 3% using water masers (Humphreys et al. 2013, hereafter H13) has provided a new anchor galaxy whose Cepheids can be observed with the same instrument and
filters as those in SNIa hosts to effectively cancel the effect of photometric zeropoint uncertainties in this step along the distance ladder. Tied to the Hubble diagram of 240 SNe Ia(now>300 SNeIa; Scolnic et al. 2015; Scolnic & Kessler 2016), the new ladder was used to initially determineH0with a total uncertainty
of 4.7% (Riess et al. 2009a, hereafter R09). R11 subsequently improved this measurement to 3.3% by increasing to 8 the number of Cepheid distances to reliable SNIa hosts, and formally includingHST/FGS trigonometric parallaxes of 10 Milky Way (MW) Cepheids with distance D<0.5 kpc and individual precision of 8% (Benedict et al. 2007). The evolution of the error budget in these measurements is shown in Figure1.
Here we present a broad set of improvements to the SH0ES team distance ladder including new NIR HST observations of Cepheids in 11 SNIa hosts(bringing the total to 19), a refined computation of the distance to NGC 4258 from maser data, additional Cepheid parallax measurements, larger Cepheid samples in the anchor galaxies, and additional SNeIa to constrain the Hubbleflow. We present the new Cepheid data in Section2 and in S. L. Hoffmann et al.(2016, in preparation; hereafter H16). Other improvements are described throughout Section 3, and a consideration of analysis variants and systematic uncertainties is given in Section4. We end with a discussion in Section5.
2.HSTOBSERVATIONS OF CEPHEIDS IN THE SH0ES PROGRAM
Discovering and measuring Cepheid variables in SNIa host galaxies requires a significant investment of observing time on Figure 1.Uncertainties in the determination ofH0. Uncertainties are squared to
show their individual contribution to the quadrature sum. These terms are given in Table7.
HST. It is thus important to select SN Ia hosts likely to produce a set of calibrators that is a good facsimile of the much larger sample defining the modern SNIa magnitude-redshift relation at 0.01<z<0.15(e.g., Scolnic et al.2015; Scolnic & Kessler 2016). Poor-quality light curves, large reddening, atypical SN explosions, or hosts unlikely to yield a significant number of Cepheids would all limit contributions to this effort. Therefore, the SH0ES program has been selecting SNeIa with the following qualities to ensure a reliable calibration of their
fiducial luminosity: (1) modern photometric data (i.e., photo-electric or CCD),(2)observed before maximum brightness and well thereafter, (3) low reddening (implying AV<0.5 mag),
(4) spectroscopically typical, and (5) a strong likelihood of being able to detect Cepheids in its host galaxy withHST. This last quality translates into any late-type host (with features consistent with the morphological classification of Sa to Sd) having an expectation of D40 Mpc, inclination <75°, and apparent size>1′. To avoid a possible selection bias in SNIa luminosities, the probable distance of the host is estimated via the Tully–Fisher relation orflow-corrected redshifts as reported in NED.12We will consider the impact of these selections in Section 4.
The occurrence of SNeIa with these characteristics is unfortunately quite rare, leading to a nearly complete sample of 19 objects observed between 1993 and 2015 (see Table 1). Excluding SNe from the 1980s, a period when modern detectors were rare and when suitable SNeIa may have appeared and gone unnoticed, the average rate of production is
∼1 yr−1. Regrettably, it will be difficult to increase this sample substantially(by a factor of∼2)over the remaining lifetime of HST. We estimate that a modest augmentation of the sample(at best) would occur by removing one or more of the above selection criteria, but the consequent increase in systematic uncertainty would more than offset the statistical gain.
Reliable SNeIa from early-type hosts could augment the sample, with distance estimates based on RR Lyrae stars or the tip of the red-giant branch (TRGB) for their calibration. Unfortu-nately, the reduced distance range of these distance indicators for HST compared with Cepheids (2.5 mag or D<13 Mpc for TRGB, 5 mag orD<4 Mpc for RR Lyrae stars)and the factor of
∼5 smaller sample of SNeIa in early-type hosts limits the sample increase to just a few additional objects(SN 1994D, SN 1980N, 1981D, and SN 2006dd with the latter three all in the same host; Beaton et al.2016), a modest fraction of the current sample of 19 SNeIa calibrated by Cepheids.
Figure 2 shows the sources of the HST data obtained on every host we use, gathered from different cameras,filters, time periods, HST programs and observers. All of these publicly available data can be readily obtained from the Mikulski Archive for Space Telescopes(MAST; see Table1). The utility of the imaging data can be divided into two basic functions: Cepheid discovery and flux measurement. For the former, a campaign using a filter with central wavelength in the visual band and ∼12 epochs with nonredundant spacings spanning
∼60–90 days will suffice to identify Cepheid variables by their unique light curves and accurately measure their periods (Madore & Freedman 1991; Saha et al. 1996; Stetson 1996). Revisits on a year timescale, although not required, will yield increased phasing accuracy for the longest-period Cepheids.
Image subtraction can be very effective for finding larger samples of variables (Bonanos & Stanek 2003), but the additional objects will be subject to greater photometric biases owing to blends which suppress their amplitudes and chances of discovery in time-series data(Ferrarese et al. 2000).
Flux measurements are required in order to use Cepheids as standard candles for distance measurement and are commonly done with HST filters at known phases in optical (F555W, F814W)and NIR(F160W)bands to correct for the effects of interstellar dust and the nonzero width in temperature of the Cepheid instability strip. We rely primarily on NIR “ Wesen-heit”magnitudes (Madore1982), defined as
( ) ( ) = - -mH m R V I , 1 W H where H=F160W, V=F555W, I=F814W in the HST system, andR≡AH/(AV−AI). We note that the value ofRdue
to the correlation between Cepheid intrinsic color and luminosity is very similar to that due to extinction (Macri et al.2015), so the value ofRderived for the latter effectively also reduces the intrinsic scatter caused by the breadth of the instability strip. However, to avoid a distance bias, we include only Cepheids with periods above the completeness limit of detection(given in H16)in our primaryfit.(In future work we will use simulations to account for the bias of Cepheids below this limit to provide an extension of the Cepheid sample.)
In HST observations, Cepheid distances based on NIR measurements have somewhat higher statistical uncertainties than those solely based on optical photometry owing to the smaller
field of view(FOV), lower spatial resolution, and greater blending Table 1
Cepheid Hosts Observed withHST/WFC3
Galaxy SNIa Exp.Time(s) Prop IDs UT Datec NIRa Opt.b M101d 2011fe 4847 3776 12880 2013 Mar 03 N1015 2009ig 14364 39336 12880 2013 Jun 30 N1309d 2002fk 6991 3002 11570, 12880 2010 Jul 24 N1365d 2012fr 3618 3180 12880 2013 Aug 06 N1448 2001el 6035 17562 12880 2013 Sep 15 N2442 2015F 6035 20976 13646 2016 Jan 21 N3021d 1995al 4426 2962 11570, 12880 2010 Jun 03 N3370d 1994ae 4376 2982 11570, 12880 2010 Apr 04 N3447 2012ht 4529 19114 12880 2013 Dec 15 N3972 2011by 6635 19932 13647 2015 Apr 19 N3982d 1998aq 4018 1400 11570 2009 Aug 04 N4038d 2007sr 6795 2064 11577 2010 Jan 22 N4258d Anchor 34199 6120 11570 2009 Dec 03 N4424 2012cg 3623 17782 12880 2014 Jan 08 N4536d 1981B 2565 2600 11570 2010 Jul 19 N4639d 1990N 5379 1600 11570 2009 Aug 07 N5584 2007af 4929 59940 11570 2010 Apr 04 N5917 2005cf 7235 23469 12880 2013 May 20 N7250 2013dy 5435 18158 12880 2013 Oct 12
U9391 2003du 13711 39336 12880 2012 Dec 14
Notes. a
Data obtained with WFC3/IR andF160W.
b
Data obtained with WFC3/UVIS andF555W,F814W, orF350LPused to
find and measure theflux of Cepheids.
c
Date offirst WFC3/IR observation.
d
Includes time-series data from an earlier program and a different camera—see Figure2.
12
The NASA/IPAC Extragalactic Database (NED) is operated by the Jet Propulsion Laboratory, California Institute of Technology, under contract with the National Aeronautics and Space Administration(NASA).
from red giants. However, as characterized in Section4.2, this is more than offset by increased robustness to systematic uncertain-ties(such as metallicity effects and possible breaks in the slope of theP–Lrelation)as well as the reduced impact of extinction and a lower sensitivity to uncertainties in the reddening law. The latter is quantified by the value ofRin Equation(1), ranging from 0.3 to 0.5 atHdepending on the reddening law, a factor of ∼4 lower than the value at I. At the high end, the Cardelli et al. (1989) formulation with RV=3.3 yields R=0.47. The Fitzpatrick
(1999)formulation withRV=3.3 and 2.5 yieldsR=0.39 and
R=0.35, respectively. At the low end, a formulation appropriate for the inner MW(Nataf et al.2015)yieldsR=0.31. We analyze the sensitivity ofH0to variations inRin Section4.
2.1. Cepheid Photometry
The procedure for identifying Cepheids from time-series optical data (see Table 1 and Figure 2) has been described extensively (Saha et al. 1996; Stetson 1996; Riess et al. 2005; Macri et al. 2006); details of the procedures followed for this sample are presented by H16, utilize the DAO suite of software tools for crowded-field PSF photometry, and are similar to those used previously by the SH0ES team. The complete sample of Cepheids discovered or reanalyzed by H16 in these galaxies
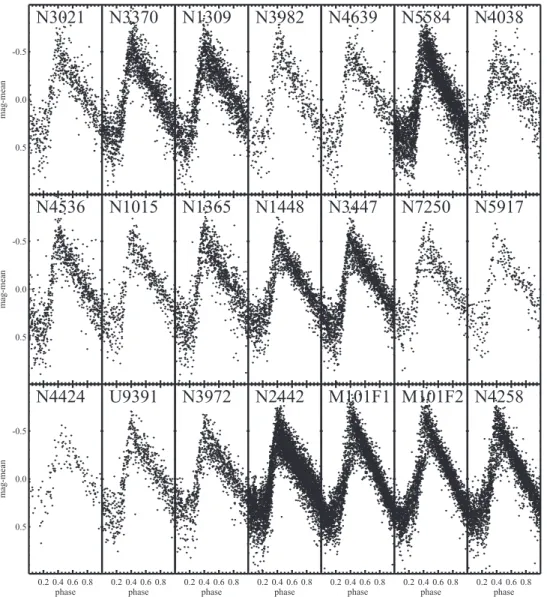
(NGC 4258 and the 19 SNIa hosts) at optical wavelengths contains 2062 variables above the periods for completeness across the instability strip(with limits estimated using theHST exposure-time calculators and empirical tests as described in that publication). There are 1566 such Cepheids in the 19 SNIa hosts within the smaller WFC3-IRfields alone. The positions of the Cepheids within each target galaxy are shown in Figure3. For hosts in which we used F350LPto identify Cepheid light curves, additional photometry was obtained over a few epochs in F555WandF814W. These data were phase-corrected to mean-light values using empirical relations based on mean-light curves in bothF555WandF350LPfrom Cepheids in NGC 5584. Figure4 shows composite Cepheid light curves in F350LP/F555W for each galaxy. Despite limited sampling of the individual light curves, the composites clearly display the characteristic “ saw-toothed” light curves of PopulationI fundamental-mode Cep-heids, with a rise twice as fast as the decline and similar mean amplitudes across all hosts.
For every host, optical data in F555W and F814W from WFC3 were uniformly calibrated using the latest referencefiles from STScI and aperture corrections derived from isolated stars in deep images to provide uniform flux measurements for all Cepheids. In a few cases,F555WandF814Wdata from ACS Figure 2.HSTobservations of the host galaxies of ideal SNeIa. The data used to observe Cepheids in 19 SNIa hosts and NGC 4258 were collected over 20 years with four cameras and over 600 orbits ofHSTtime. 60–90 day campaigns inF555WandF814Wor inF350LPwere used to identify Cepheids from their light curves with occasional reobservations years later to identify Cepheids withP>60 days. Near-IR follow-up observations inF160Ware used to reduce the effects of host-galaxy extinction, sensitivity to metallicity, and breaks in theP–Lrelation. Data sources:(1)HSTSNIa Calibration Project, Sandage et al.(2006);(2)HSTKey Project, Freedman et al.(2001);(3)Riess et al.(2005);(4)Macri et al.(2006); and(5)Mager et al.(2013).
Figure 3.Images of Cepheid hosts. Each image is of the Cepheid host indicated. The magenta outline shows thefield of view of WFC3/IR, 2 7 on a side. Red dots indicate the positions of the Cepheids. Compass indicates north(long axis)and east(short axis).
and WFC3 were used in concert with their well-defined cross-calibration to obtain photometry with a higher signal-to-noise ratio (S/N). The cross-calibration between these two cameras has been stable to<0.01 mag over their respective lifetimes.
As in R11, we calculated the positions of Cepheids in the WFC3F160Wimages using a geometric transformation derived from the optical images using bright and isolated stars, with resulting mean position uncertainties for the variables<0.03 pix. We used the same scene-modeling approach to F160W NIR photometry developed inR09andR11. The procedure is to build a model of the Cepheid and sources in its vicinity using the superposition of point-spread functions(PSFs). The position of the Cepheid is fixed at its predicted location to avoid measurement bias. We model and subtract a single PSF at that location and then produce a list of all unresolved sources within 50 pixels. A scene model is constructed with three parameters per source(x,y, andflux), one for the Cepheid(flux)and a local sky level in the absence of blending; the best-fit parameters are determined simultaneously using a Levenberg–Marquardt-based algorithm. Example NIR scene models for each of the 19 SNIa hosts are shown in Figure5.
Care must be taken when measuring photometry of visible stellar sources in crowded regions as source blending can alter
the statistics of the Cepheid background (Stetson 1987). Typically the mean flux of pixels in an annulus around the Cepheid is subtracted from the measuredflux at the position of the Cepheid to produce unbiased photometry of the Cepheid. This mean background or sky would include unresolved sources and diffuse background. However, we can improve the precision of Cepheid photometry by correctly attributing someflux to the other sources in the scene, especially those visibly overlapping with the Cepheid. The consequence of differentiating the mean sky into individual source contributions plus a lower constant sky level is that the new sky level will underestimate the true mix of unresolved sources and diffuse background superimposed with the Cepheid flux(in sparse regions without blending, the original and new sky levels would approach the same value). This effect may usefully be called the sky bias or the photometric difference due to blending and is statistically easily rectified. To retrieve the unbiased Cepheid photometry from the result of the scene model we could either recalculate the Cepheid photometry using the original mean sky or correct the overestimate of Cepheidflux based on the measured photometry of artificial stars added to the scenes. The advantage of the artificial star approach is that the same analysis also produces an empirical error estimate and can provide an estimate of outlier frequency. Figure 4.Composite visual(F555W)or white-light(F350LP)Cepheid light curves. EachHSTCepheid light curve with 10<P<80 days is plotted after subtracting the mean magnitude and determining the phase of the observation. Twofields(F1 and F2)are shown for M101.
Figure 5.Example WFC3F160WCepheid scene model for each host. A random Cepheid in the period range of 30<P<70 days was selected. The four panels of each host show a 1″region of the scene around each known Cepheid, the region after the Cepheid isfit and subtracted, the model of all detected sources, and the model residuals.
Following this approach, we measure the mean difference between input and recovered photometry of artificial Cepheids added to the local scenes in theF160Wimages andfit with the same algorithms. As inR09andR11, we added andfitted 100 artificial stars, placed one at a time, at random positions within 5 arcsec of (but not coincident with)each Cepheid to measure and account for this difference. To avoid a bias in this procedure, we initially estimate the inputflux for the artificial stars from the Cepheid period and an assumed P–L relation (iteratively determined), measure the difference caused by blending, refine theP–Lrelation, and iterate until convergence. Additionally, we use the offset in the predicted and measured location of the Cepheid, a visible consequence of blending, to select similarly affected artificial stars to customize the difference measurements for each Cepheid. The median difference for the Cepheids in all SN hosts hosts observed with HST is 0.18 mag, mostly due to red-giant blends, and it approaches zero for Cepheids in lower-density regions such as the outskirts of hosts. The Cepheid photometry presented in this paper already accounts for the sky bias. We also estimate the uncertainty in the Cepheid flux from the dispersion of the measured artificial-star photometry around the 2.7σ-clipped mean. The NIR CepheidP–Lrelations for all hosts and anchors are shown in Figure6.
Likewise, in the optical images, we used as many as 200 measurements of randomly placed stars in the vicinity of each Cepheid inF555W andF814W images to measure and account for the photometric difference due to the process of estimating the sky in the presence of blending. Only 10 stars at a time were added to each simulated image to avoid increasing the stellar density. These tests show that similarly to the NIR measurements, uncertainty in the Cepheid background is the leading source of scatter in the observedP–Lrelations of the SN hosts. The mean dispersions atF555WandF814W, with values for each host listed in Table 2 in columns 6 and 7, are 0.19 and 0.17 mag, respectively. All SN hosts and NGC 4258 display some difference in their optical magnitudes due to blending, with mean values of 0.05 and 0.06 mag(bright)in F555Wand F814W, respectively. The most crowded case (ΔV=0.32 and ΔI=0.26 mag) is NGC 4424, a galaxy whose Cepheids are located in a circum-nuclear starburst region with prominent dust lanes. We tabulate the mean photometric differences due to blending for each host in Table2, columns 2 and 3. However, the effect of blending largely cancels when determining the color F555W–F814W used to measure Cepheid distances via Equation(1)since the blending is highly correlated across these bands. Indeed, the estimated change in color across all hosts given in Table2, column 4 has a mean of only 0.005 mag (blue) and a host-to-host scatter of 0.01 mag, implying no statistically significant difference from the initial Figure 6.Near-infrared CepheidP–Lrelations. The Cepheid magnitudes are shown for the 19 SN hosts and the four distance-scale anchors. Magnitudes labeled as
F160Ware all from the same instrument and camera, WFC3F160W. The uniformity of the photometry and metallicity reduces systematic errors along the distance ladder. A single slope is shown to illustrate the relations, but we also allow for a break(two slopes)as well as limited period ranges.
measurement and thus we have not applied these to the optical magnitudes in Table4. Even the additional scatter in themHW P–L relation owing to blending in the optical color measurement is a relatively minor contribution of 0.07 mag. The small correction due to blending in the optical bands does need to be accounted for when using a conventional optical Wesenheit magnitude, mIW=F814W–RI (F555W–F814W), because (unlike the color)
the cancellation in mIW is not complete. We find a small mean difference formIW in our SN hosts of 0.025 mag(bright)with a
host-to-host dispersion in this quantity of 0.03 mag. If uncor-rected, this would lead to a 1% underestimate of distances and an overestimate of H0for studies that rely exclusively onmI
W. The
more symmetric effect of blending onmIW thanmHW magnitudes
results from the mixture of blue blends (which makemIW faint)
and red blends (which make mIW bright). These results are
consistent with those found from simulations by Ferrarese et al. (2000), who drew similar conclusions. We will make use of these results formIWin Section4.2. Although the net effect of blending
for mIW is typically small, the uncertainty it produces is the
dominant source of dispersion with a mean of 0.36 mag for the SN hosts, similar in impact and scatter to what was found formHW. Although we quantify and propagate the individual measure-ment uncertainty for each Cepheid, we conservatively discard the lowest-quality measurements. As in R11, scene models of Cepheids were considered to be useful if our software reported afitted magnitude for the source with an uncertainty<0.7 mag, a set of model residual pixels with root-mean square (rms) lower than 3σfrom the other Cepheid scenes, and a measured difference from the artificial star analyses of <1.5 mag. In addition, we used a broad(1.2 mag)allowed range ofF814W– F160W colors centered around the median for each host, similar to the V−Icolor selection common to optical studies (see H16), to remove any Cepheids strongly blended with
redder or bluer stars of comparable brightness. As simulations in Section 4.1show, most of these result from red giants but also occasionally from blue supergiants.
1028 of the 1566 Cepheids present in theF160Wimages of the SNIa hosts with periods above their respective completeness limits yielded a good quality photometric measurement within the allowed color range. Excessive blending in the vicinity of a Cepheid in lower-resolution and lower-contrast NIR images was the leading cause for the failure to derive a useful measurement for the others. The number of Cepheids available at each step in the measurement process is given in Table3.
2.2. Statistical Uncertainties in Cepheid Distances We now quantify the statistical uncertainties that apply to Cepheid-based distance estimates. As described in the previous section, the largest source of measurement uncertainty for mHW
(defined in Equation(1))arises fromfluctuations in the NIR sky background due to variations in blending, and it is measured from artificial star tests; we refer to this as σsky. For SNIa hosts at
20–40Mpc and for NGC 4258, the meanσskyfor Cepheids in the
NIR images is 0.28 mag, but it may be higher or lower depending on the local stellar density. The next term which may contribute uncertainty in Equation (1)is σct=Rσ(V−I). While blending does not change the mean measured optical colors(discussed in Section 2.1), it does add a small amount of dispersion. The artificial star tests in the optical data yield a mean value forσctof
0.07 mag across all hosts, with values for each host given in Table 2, column 8). There is also an intrinsic dispersion,σint,
resulting from the nonzero temperature width of the Cepheid instability strip. It can be determined empirically using nearby Cepheid samples which have negligible background errors. We
findσint=0.08 mag formHW (0.12 mag formIW)using the LMC
Cepheids from Macri et al. (2015) over a comparable period range(see Figure6). This agrees well with expectations from the Geneva stellar models (R. I. Anderson et al. 2016, in preparation). We use this value as the intrinsic dispersion of meanmHWmagnitudes. The last contribution comes from our use of random- or limited-phase (rather than mean-phase) F160W magnitudes. Monte Carlo sampling of complete H-band light curves from Persson et al.(2004)shows that the use of a single random phase adds an error of σph=0.12 mag.13The relevant fractional contribution of the random-phase uncertainty for a given Cepheid with period Pdepends on the temporal interval, ΔT, across NIR epochs, a fraction we approximate as fph=1−(ΔT/P) for ΔT<P and fph=1 for ΔT>P; the values of ΔT are given in Table 3. The value of this fraction ranges from∼1(NIR observations at every optical epoch)to zero (a single NIR follow-up observation).
Thus, we assign a total statistical uncertainty arising from the quadrature sum of four terms: NIR photometric error, color error, intrinsic width, and random-phase:
( ( ) ) stot= ssky +s +s + f s . 2 ct 2 int 2 ph ph2 1 2
We give the values ofσtotfor each Cepheid in Table4. These
have a median of 0.30 mag(mean of 0.32 mag)across allfields; mean values for eachfield range from 0.23 mag(NGC 3447)to 0.47 mag(NGC 4424). The mean for NGC 4258 is 0.39 mag. Table 2
Artificial Cepheid Tests in Optical Images Host ΔV ΔI Δct DmIW σ(V) σ(I) σ ct s(mIW) (mmag) (mag) M101 6 3 1 −2 0.09 0.09 0.03 0.16 N1015 41 40 1 27 0.13 0.13 0.06 0.31 N1309 105 63 12 −1 0.35 0.26 0.10 0.48 N1365 15 19 0 7 0.13 0.13 0.06 0.29 N1448 31 24 1 6 0.14 0.13 0.06 0.29 N2442 141 109 8 23 0.24 0.21 0.10 0.48 N3021 106 134 0 75 0.23 0.22 0.09 0.46 N3370 69 55 5 26 0.23 0.19 0.07 0.37 N3447 34 23 4 −1 0.14 0.12 0.06 0.29 N3972 79 68 7 25 0.18 0.17 0.07 0.38 N3982 82 69 0 22 0.22 0.19 0.09 0.44 N4038 38 28 2 12 0.19 0.15 0.07 0.34 N4258I 5 7 −1 10 0.20 0.23 0.05 0.36 N4258O −2 1 0 0 0.08 0.07 0.02 0.10 N4424 318 262 −2 111 0.31 0.28 0.11 0.58 N4536 12 16 −1 10 0.11 0.10 0.05 0.24 N4639 56 85 −5 89 0.21 0.22 0.09 0.51 N5584 26 23 2 7 0.15 0.13 0.05 0.26 N5917 54 51 −2 32 0.20 0.19 0.08 0.42 N7250 152 91 13 −1 0.24 0.20 0.08 0.42 U9391 36 42 −3 38 0.15 0.15 0.06 0.34
Note.Δ=median magnitude or color offset derived from tests;σ= disper-sion aroundΔ;Vstands forF555W;Istands forF814W;ct=R×(V−I), with R=0.39 for RV=3.3 and the Fitzpatrick (1999) extinction law;
mIW
isdefined in the text.
13
The sum of the intrinsic and random phase errors, 0.14 mag, is smaller than the 0.21 mag assumed byR11; the overestimate of this uncertainty explains why theχ2of theP–Lfits in that paper were low and resulted in the need to
We also include in Table4an estimate of the metallicity at the position of each Cepheid based on metallicity gradients measured from optical spectra of HII regions obtained with
the Keck-I 10 m telescope and presented in H16.
3. MEASURING THE HUBBLE CONSTANT The determination ofH0follows the formalism described in
Section 3 of R09. To summarize, we perform a single, simultaneousfit to all Cepheid and SNIa data to minimize one χ2statistic and measure the parameters of the distance ladder.
We use the conventional definition of the distance modulus, μ=5 logD+25, with D a luminosity distance in Mpc and measured as the difference in magnitudes of an apparent and absolute flux, μ=m−M. We express the jth Cepheid magnitude in the ith host as
( ) ( ) ( ) m m = - + + + D m b P Z zp log log O H , 2 H i jW i W W i j W i j , , 0, 0,N4258 ,N4258 , , /
where the individual Cepheid parameters are given in Table4and mH i jW, , was defined in Equation(1). We determine the values of the nuisance parameters bW and ZW—which define the relation
between Cepheid period, metallicity, and luminosity—by mini-mizing theχ2for the globalfit to the sample data. The reddening-free distances for the hosts relative to NGC 4258 are given by the
fit parametersμ0,i–μ0,N4258, while zpW,N4258is the intercept of the
P–Lrelation simultaneouslyfit to the Cepheids of NGC 4258. Uncertainties in the nuisance parameters are due to measurement errors and the limited period and metallicity range spanned by the variables. InR11we used a prior inferred from external Cepheid datasets to help constrain these parameters. In the present analysis, instead, we explicitly use external data as described below to augment the constraints.
Recent HST observations of Cepheids in M31 provide a powerful ancillary set of Cepheids at a fixed distance to help characterize NIR P–L relations. Analyses of the HST PHAT Treasury data (Dalcanton et al. 2012) by Riess et al. (2012), Kodric et al. (2015), and Wagner-Kaiser et al. (2015) used samples of Cepheids discovered from the ground with NIR and optical magnitudes from HST to derive low-dispersion P–L relations. We used the union set of these samples and their WFC3 photometry inF160Wmeasured with the same algorithms as the previous hosts to produce a set of 375 Cepheids with 3<P<78 days as shown in Figure 6. We add Equation (2) (actually, a set of such equations)for these data to those from the other hosts, requiring the addition of one nuisance parameter, the distance to M31, but providing a large range oflogP(∼1.4 dex) for the determination of the P–L relation slopes. These M31 Cepheids alone constrain the slope to an uncertainty of 0.03 mag dex−1, a factor of 3 better than the prior used byR11. They also hint at the possible evidence of a break in themHWP–L relation at the 2σ confidence level (Kodric et al. 2015) if the location of a putative break is assumed a priori to be at 10 days as indicated by opticalP–Lrelations(Ngeow & Kanbur2005). To allow for a possible break, we include two different slope parameters in Equation (2) in the primary analysis, one for Cepheids withP>10 days and another forP<10 days. We will consider alternative approaches for dealing with nonlinear P–L relations in Section4.1.
The SNIa magnitudes in the calibrator sample are simultaneously expressed as (m m ) ( ) = - + mx i, i mx , 3 0 0, 0,N4258 ,N4258 0
where the value mx i0, is the maximum-light apparent x-band brightness of a SNIa in theith host at the time ofB-band peak, corrected to thefiducial color and luminosity. This quantity is determined for each SNIa from its multiband light curves and a light-curve fitting algorithm. For the primary fits we use SALT-II (Guy et al. 2005, 2010). For consistency with the most recent cosmologicalfits we use version 2.4 of SALT II as used by Betoule et al.(2014)and more recently from Scolnic & Kessler(2016)14 and for whichx=B. The fit parameters are discussed in more detail in Section 4.2. In order to compare withR11and to explore systematics in light-curvefits, we also use MLCS2k2 (Jha et al. 2007) for which x=V (see Section4.2for further discussion).
The simultaneous fit to all Cepheid and SNIa data via Equations (2) and (3) results in the determination of mx,N42580 , which is the expected reddening-free,fiducial, peak magnitude of a SNIa appearing in NGC 4258. The individual Cepheid P–L relations are shown in Figure6. Lastly,H0is determined from
( ) ( ) m = - + + H m a log 5 25 5 , 4 x x 0 ,N4258 0 0,N4258 Table 3
Properties of NIRP–LRelations
Galaxy Number á ñP ΔT ástotñ σPL
FOV Meas. Fit (days) (days)
LMC L 785 775 6.6 L 0.09 0.08 MW L 15 15 8.5 L 0.21 0.12 M31 L 375 372 11.5 0 0.15 0.15 M101 355 272 251 17.0 0 0.30 0.32 N1015 27 14 14 59.8 100 0.32 0.36 N1309 64 45 44 55.2 0 0.35 0.36 N1365 73 38 32 33.6 12 0.32 0.32 N1448 85 60 54 30.9 54 0.30 0.36 N2442 285 143 141 32.5 68 0.52 0.38 N3021 36 18 18 32.8 0 0.42 0.51 N3370 86 65 63 42.1 0 0.33 0.33 N3447 120 86 80 34.5 59 0.28 0.34 N3972 71 43 42 31.5 38 0.49 0.38 N3982 22 16 16 40.6 0 0.30 0.32 N4038 28 13 13 63.4 0 0.43 0.33 N4258 228 141 139 18.8 0 0.40 0.36 N4424 8 4 3 28.9 33 0.56 L N4536 47 35 33 36.5 0 0.27 0.29 N4639 35 26 25 40.4 0 0.36 0.45 N5584 128 85 83 42.6 11 0.32 0.33 N5917 21 14 13 39.8 100 0.39 0.38 N7250 39 22 22 31.3 60 0.44 0.43 U9391 36 29 28 42.2 100 0.34 0.43 Total SN 1566 1028 975 32.5 L L L Total All L 2358 2286 L L L L
Note.FOV: located within the WFC3/IRfield of view. Meas.: good quality measurement within allowed color range and with period above completeness limit. Fit: after global outlier rejection, see Section4.1.á ñP: median period of thefinal NIR sample used in this analysis;ΔT=time interval betweenfirst and last NIR epochs;ástotñ=median value ofσtot(uncertainties)for Cepheids
in each host(see text for definition);σPL=apparent dispersion of NIRP–L
relation after outlier rejection.
14
where μ0,4258is the independent, geometric distance modulus
estimate to NGC 4258 obtained through VLBI observations of water megamasers orbiting its central supermassive black hole (Herrnstein et al. 1999; Humphreys et al.2005, 2008, 2013; Argon et al.2007).
Observations of megamasers in Keplerian motion around a supermassive blackhole in NGC 4258 provide one of the best sources of calibration of the absolute distance scale with a total uncertainty given by H13 of 3%. However, the leading systematic error in H13 resulted from limited numerical sampling of the multi-parameter model space of the system, given in H13 as 1.5%. The ongoing improvement in computation speed allows us to reduce this error.
Here we make use of an improved distance estimate to NGC 4258 utilizing the same VLBI data and model fromH13but now with a 100-fold increase in the number of Monte Carlo Markov Chain(MCMC)trial values from 107in that publication to 109for each of three independent“strands”of trials or initial guesses initialized near and at ±10% of the H13 distance. By increasing the number of samples, the new simulation averages over many more of the oscillations of trial parameters in an MCMC around their true values. The result is a reduction in the leading systematic error of 1.5% fromH13caused by “different initial conditions”for strands with only 107MCMC samples to 0.3% for the differences in strands with 109MCMC samples. The smoother probability density function (PDF)for the distance to NGC 4258 can be seen in Figure 7. The complete uncertainty (statistical and systematic)for the maser distance to NGC 4258 is reduced from 3.0% to 2.6%, and the better fit also produces a slight 0.8% decrease in the distance, yielding
( ) ( ) ( ) = D NGC 4258 7.54 0.17 random 0.10 systematic Mpc, equivalent to μ0,N4258=29.387±0.0568 mag.
The term ax in Equation (4) is the intercept of the SNIa
magnitude-redshift relation, approximately logcz -0.2mx0 in
the low-redshift limit but given for an arbitrary expansion history and forz>0 as
{
[ ] [ ] ( ) ( ) = + - - - -+ + -⎛ ⎝ ⎜ ⎫ ⎬ ⎭ ⎞ ⎠ ⎟ a cz q z q q j z O z m log 1 1 2 1 1 6 1 3 0.2 , 5 x x 0 0 0 2 0 2 3 0measured from the set of SNIa (z m, x 0)
independent of any absolute (i.e., luminosity or distance) scale. We determine ax
from a Hubble diagram of up to 281 SNeIa with a light-curve
fitter used to find the individual mx0 as shown in Figure 8.
Limiting the sample to 0.023< <z 0.15 (to avoid the possibility of a coherent flow in the more local volume; z is the redshift in the rest frame of the CMB corrected for coherent
flows, see Section4.3)leaves 217 SNeIa(in the next section we consider a lower cut of z>0.01). Together with the present accelerationq0=−0.55 and prior decelerationj0=1 which can be measured via high-redshift SNe Ia(Riess et al.2007; Betoule et al.2014)independently of the CMB or BAO, wefind for the primaryfitaB=0.71273±0.00176, with the uncertainty inq0
contributing 0.1% uncertainty(see Section4.3). Combining the peak SN magnitudes to the intercept of their Hubble diagram as
+ mx i, 5ax
0 provides a measure of distance independent of the
choice of light-curve fitter, fiducial source, and measurement
filter. These values are provided in Table5.
We use matrix algebra to simultaneously express the over 1500 model equations in Equations (2) and (3), along with a diagonal correlation matrix containing the uncertainties. We invert the matrices to derive the maximum-likelihood para-meters, as inR09and R11.
Individual Cepheids may appear as outliers in the mHW P–L
relations owing to(1)a complete blend with a star of comparable brightness and color, (2) a poor model reconstruction of a crowded group when the Cepheid is a small component of the Table 4
WFC3-IR Cepheids
Field α δ ID P V−I H σtot Z Note
(deg, J2000) (mag) (days) (mag) (dex)
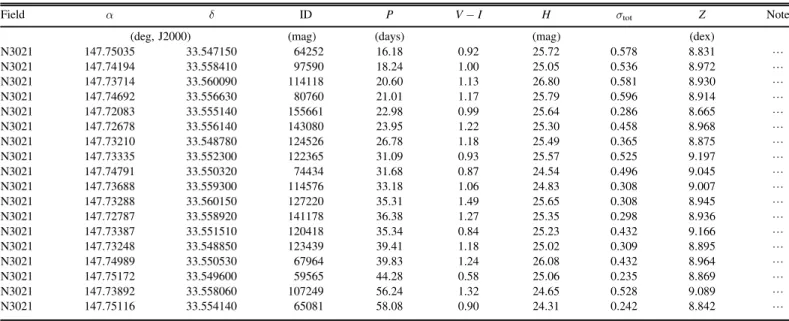
N3021 147.75035 33.547150 64252 16.18 0.92 25.72 0.578 8.831 L N3021 147.74194 33.558410 97590 18.24 1.00 25.05 0.536 8.972 L N3021 147.73714 33.560090 114118 20.60 1.13 26.80 0.581 8.930 L N3021 147.74692 33.556630 80760 21.01 1.17 25.79 0.596 8.914 L N3021 147.72083 33.555140 155661 22.98 0.99 25.64 0.286 8.665 L N3021 147.72678 33.556140 143080 23.95 1.22 25.30 0.458 8.968 L N3021 147.73210 33.548780 124526 26.78 1.18 25.49 0.365 8.875 L N3021 147.73335 33.552300 122365 31.09 0.93 25.57 0.525 9.197 L N3021 147.74791 33.550320 74434 31.68 0.87 24.54 0.496 9.045 L N3021 147.73688 33.559300 114576 33.18 1.06 24.83 0.308 9.007 L N3021 147.73288 33.560150 127220 35.31 1.49 25.65 0.308 8.945 L N3021 147.72787 33.558920 141178 36.38 1.27 25.35 0.298 8.936 L N3021 147.73387 33.551510 120418 35.34 0.84 25.23 0.432 9.166 L N3021 147.73248 33.548850 123439 39.41 1.18 25.02 0.309 8.895 L N3021 147.74989 33.550530 67964 39.83 1.24 26.08 0.432 8.964 L N3021 147.75172 33.549600 59565 44.28 0.58 25.06 0.235 8.869 L N3021 147.73892 33.558060 107249 56.24 1.32 24.65 0.528 9.089 L N3021 147.75116 33.554140 65081 58.08 0.90 24.31 0.242 8.842 L
Note.V−Istands forF555W−F814WandHstands forF160W.Z=12+log O H( ). (This table is available in its entirety in machine-readable form.)
totalflux or a resolved cluster is present,(3)objects misidentified as classical Cepheids in the optical (e.g., blended Type II Cepheids), or (4) Cepheids with the wrong period (caused by aliasing or incomplete sampling of a single cycle). For our bestfit we identify and remove outliers from the global modelfit which exceed 2.7σ (see Section4.1for details), comprising∼2% of all Cepheids (or ∼5% from all SN hosts). We consider alternative approaches for dealing with these outliers and include their impact into our systematic uncertainty in Section4.1.
Our best fit using only the maser distance to NGC 4258 in Equation(4)to calibrate the Cepheids yields a Hubble constant of 72.25±2.38 km s−1Mpc−1 (statistical uncertainty only; hereafter “stat”), a 3.3% determination compared to 4.0% inR11. The statistical uncertainty is the quadrature sum of the uncertainties in the three independent terms in Equation (4). We address systematic errors associated with this and other measurements in Section 4.
3.1. Additional Anchors
We now make use of additional sources for the calibration of Cepheid luminosities, focusing on those which(i)are fundamen-tally geometric,(ii)have Cepheid photometry available in theV,I,
and H bands, and (iii) offer precision comparable to that of NGC 4258, i.e., less than 5%. For convenience, the resulting values ofH0are summarized in Table6.
3.1.1. Milky Way Parallaxes
Trigonometric parallaxes to MW Cepheids offer one of the most direct sources of geometric calibration of the luminosity of these variables. As inR11, we use the compilation from van Leeuwen et al. (2007), who combined 10 Cepheid parallax measurements withHST/FGS from Benedict et al.(2007)with those measured at lower precision withHipparcos, plus another three measured only with significance by Hipparcos. We exclude Polaris because it is an overtone pulsator whose “fundamentalized” period is an outlier among fundamental-mode Cepheids. In their analysis, Freedman et al. (2012) further reduced the parallax uncertainties provided by Benedict et al.(2007), attributing the lower-than-expected dispersion of theP–Lrelation of the 10 Cepheids from Benedict et al.(2007) as evidence for lower-than-reported measurements errors. However, we think it more likely that this lower scatter is caused by chance (with the odds against ∼2σ) than over-estimated parallax uncertainty, as the latter is dominated by the propagation of astrometry errors which were stable and well-characterized through extensive calibration of theHSTFGS. As the sample of parallax measurements expands, we expect that this issue will be resolved, and for now we retain the uncertainties as determined by Benedict et al.(2007).
We add to this sample two more Cepheids with parallaxes measured by Riess et al. (2014) and Casertano et al. (2015) using the WFC3 spatial scanning technique. These measure-ments have similar fractional distance precision as those obtained with FGS despite their factor of 10 greater distance and provide two of only four measured parallaxes for Cepheids with P>10 days. The resulting parallax sample provides an independent anchor of our distance ladder with an error in their mean of 1.6%, though this effectively increases to 2.2% after Figure 7.Normalized probability density function(PDF)for the maser-based
distance to NGC 4258. The curve in black shows the PDF for the distance to NGC 4258 based on the same multiparameter fit of the maser data in NGC 4258 from Humphreys et al.(2013)with thex-axis expanded by 18% to match the rescaling used by H13to account forcn2=1.4. With a 100-fold increase (red curve) in the MCMC sampling, we have reduced the 1.5% systematic error in distance from Humphreys et al. (2013), which reflected different results with differing initial conditions using more-limited MCMC sampling of the parameter space.
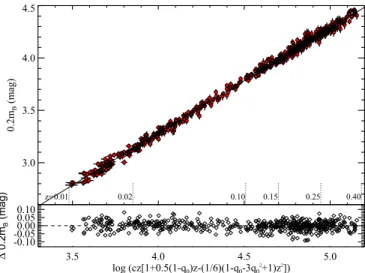
Figure 8.Hubble diagram of more than 600 SNeIa at 0.01<z<0.4 in units oflogcz. Measurements of distance and redshift for a compilation of SNIa data as described by Scolnic et al.(2015). These data are used to determine the intercept,aX (see Equation(5))wherelogcz=0, which helps measure the
value of the Hubble constant as given in Equation(9)). We account for changes in the cosmological parameters empirically by including the kinematic terms,
q0andj0, measured between high- and low-redshift SNeIa. The intercept is
measured using variants of this redshift range, as discussed in the text, with the primaryfit at 0.0233<z<0.15.
the addition of a conservatively estimated σzp=0.03 mag zeropoint uncertainty between the ground andHSTphotometric systems(but see discussion in Section5).
We use the parallaxes and theH,V, andI-band photometry of the MW Cepheids by replacing Equation (2) for the Cepheids in SNhosts and in M31 with
( ) ( ) m = + + + D mH i j M b logP Z log O H , 6 W i H W W i j W i j , , 0, ,1 , / ,
where MHW,1 is the absolutemHW magnitude for a Cepheid with P=1d, and simultaneouslyfitting the MW Cepheids with the relation ( ) ( ) = + + D MH i j M b logP Z log O H , 7 W H W W i j W i j , , ,1 , / ,
where MH i jW, , =mH i jW, , -mp and μπ is the distance modulus derived from parallaxes, including standard corrections for bias (often referred to as Lutz–Kelker bias)arising from thefinite S/ N of parallax measurements with an assumed uncertainty of 0.01 mag (Hanson 1979). The H, V, and I-band photometry, measured from the ground, are transformed to match the WFC3 F160W, F555W, and F814W as discussed in the next subsection. Equation(3)for the SNeIa is replaced with
( ) m = -mx i, i Mx. 8 0 0, 0
The determination of Mx0 for SNeIa together with the previous termaxthen determinesH0,
( ) = + + H M a log 5 25 5 . 9 x x 0 0
The statistical uncertainty in H0 is now derived from the
quadrature sum of the two independent terms in Equation(9), Mx0and 5ax.
FormHW Cepheid photometry not derived directly fromHST WFC3, we assume a fully correlated uncertainty of 0.03 mag included as an additional, simultaneous constraint equation,
0=Δzp±σzp, to the global constraints withσzp=0.03 mag.
The free parameter, Δzp, which expresses the zeropoint difference between HST WFC3 and ground-based data, is now added to Equation(7)for all of the MW Cepheids. This is a convenience for tracking the correlation in the zeropoints between ground-based data and providing an estimate of its size. In future work we intend to eliminate Δzp and its uncertainty by replacing the ground-based photometry with measurements from HST WFC3 enabled by spatial scanning (Riess et al.2014).
Table 5
Approximations for Distance Parameters
Host SN mB i0,+5aB σa mCeph b σ MB i0, σ (mag) M101 2011fe 13.310 0.117 29.135 0.045 −19.389 0.125 N1015 2009ig 17.015 0.123 32.497 0.081 −19.047 0.147 N1309 2002fk 16.756 0.116 32.523 0.055 −19.331 0.128 N1365 2012fr 15.482 0.125 31.307 0.057 −19.390 0.137 N1448 2001el 15.765 0.116 31.311 0.045 −19.111 0.125 N2442 2015F 15.840 0.142 31.511 0.053 −19.236 0.152 N3021 1995al 16.527 0.117 32.498 0.090 −19.535 0.147 N3370 1994ae 16.476 0.115 32.072 0.049 −19.161 0.125 N3447 2012ht 16.265 0.124 31.908 0.043 −19.207 0.131 N3972 2011by 16.048 0.116 31.587 0.070 −19.103 0.136 N3982 1998aq 15.795 0.115 31.737 0.069 −19.507 0.134 N4038 2007sr 15.797 0.114 31.290 0.112 −19.058 0.160 N4424 2012cg 15.110 0.109 31.080 0.292 −19.534 0.311 N4536 1981B 15.177 0.124 30.906 0.053 −19.293 0.135 N4639 1990N 15.983 0.115 31.532 0.071 −19.113 0.135 N5584 2007af 16.265 0.115 31.786 0.046 −19.085 0.124 N5917 2005cf 16.572 0.115 32.263 0.102 −19.255 0.154 N7250 2013dy 15.867 0.115 31.499 0.078 −19.196 0.139 U9391 2003du 17.034 0.114 32.919 0.063 −19.449 0.130 Notes. a
For SALT-II, 0.1 mag added in quadrature tofitting error.
b
Approximate, SN-independent Cepheid-based distances as described at the end of Section3.
Table 6
Best Estimates ofH0Including Systematics
Anchor(s) Value (km s−1Mpc−1) One Anchor NGC 4258: Masers 72.25±2.51 MW: 15 Cepheid Parallaxes 76.18±2.37 LMC: 8 Late-type DEBs 72.04±2.67 M31: 2 Early-type DEBs 74.50±3.27 Two Anchors NGC 4258+MW 74.04±1.93 NGC 4258+LMC 71.62±1.78
Three Anchors(Preferred)
NGC 4258+MW+LMC 73.24±1.74
Four Anchors
NGC 4258+MW+LMC+M31 73.46±1.71
Optical only(no NIR), three anchors
NGC 4258+MW+LMC 71.56±2.49
Using these 15 MW parallaxes as the only anchor, we find H0=76.18±2.17 km s−1Mpc−1 (stat). In order to use the parallaxes together with the maser distance to NGC 4258, we recast the equations for the Cepheids in NGC 4258 in the form of Equation(7)withμ0,N4258in place ofμπand the addition of the
residual termΔμN4258to these as a convenience for keeping track
of the correlation among these Cepheids and the prior external constraint on the geometric distance of NGC 4258. We then add the simultaneous constraint equation 0=ΔμN4258±σμ0,N4258
withσμ0,N4258=0.0568 mag. Compared to the use of the maser-based distance in Section3,σμ0,N4258has moved from Equation(4)
to the a priori constraint on ΔμN4258. This combination gives
H0=74.04±1.74 km s−1Mpc−1 (stat), a 2.4% measurement that is consistent with the value from NGC 4258 to 1.2σ considering only the distance uncertainty in the geometric anchors.
3.1.2. LMC Detached Eclipsing Binaries
InR11we also used photometry of Cepheids in the LMC and estimates of the distance to this galaxy based on detached eclipsing binaries (DEBs) to augment the set of calibrators of Cepheid luminosities. DEBs provide the means to measure geometric distances (Paczynski & Sasselov 1997) through the ability to determine the physical sizes of the member stars via their photometric light curves and radial velocities. The distance to the LMC has been measured with both early-type and late-type stars in DEBs. Guinan et al.(1998), Fitzpatrick et al.(2002), and Ribas et al. (2002) studied three B-type systems (HV 2274, HV 982, EROS 1044)which lie close to the bar of the LMC and therefore provide a good match to the Cepheid sample of Macri et al. (2015). InR11we used an average distance modulus for these of 18.486±0.065 mag.15 However, for early-type stars it is necessary to estimate their surface brightness via non-LTE(local thermodynamic equilibrium)model atmospheres, introducing an uncertainty that is difficult to quantify.
The approach using DEBs composed of late-type stars is more reliable and fully empirical because their surface brightness can be estimated from empirical relations between this quantity and color, using interferometric measurements of stellar angular sizes to derive surface brightnesses(Di Benedetto 2005). Pietrzyński et al. (2013) estimated the distance to the center of the LMC to 2% precision using 8 DEBs composed of late-type giants in a quiet evolutionary phase on the helium burning loop, located near the center of the galaxy and along its line of nodes. The individual measurements are internally consistent and yield μLMC=18.493±0.008 (stat)±0.047 (sys) mag, with the uncertainty dominated by the accuracy of the surface brightness versus color relation.
Recently, Macri et al.(2015)presented NIR photometry for LMC Cepheids discovered by the OGLE-III project(Soszynski et al.2008), greatly expanding the sample size relative to that of Persson et al.(2004)from 92 to 785, although the number of Cepheids withP>10 days increased more modestly from 39 to 110. Similarly to the M31 Cepheids, the LMC Cepheids provide greater precision for characterizing the P–L relations than those in the SNIa hosts, and independently hint at a change in slope at P≈10 days(Bhardwaj et al.2016).
We transform the ground-based V, I and H-band Vega-system photometry of Macri et al. (2015)into the Vega-based
HST/WFC3 photometric system in F555W, F814W and F160W, respectively, using the following equations:
( ) ( ) = + + -m555 V 0.034 0.11 V I 10 ( ) ( ) = + - -m814 I 0.02 0.018 V I 11 ( ) ( ) = + -m160 H 0.16 J H 12
where the color terms were derived from synthetic stellar photometry for the two systems using SYNPHOT (Laidler et al.2005). To determine any zeropoint offsets(aside from the potentially different definitions of Vega)for the optical bands we compared photometry of 97 stars in the LMC observed inVandI by OGLE-III and in WFC3/F555W and F814W as part of HST-GO program #13010 (P.I.: Bresolin). The latter was calibrated following the exact same procedures as H16, which uses the UVIS 2.0 WFC3 Vegamag zeropoints. The uncertainties of the zeropoints in the optical transformations were found to be only 4mmag. The change in color,V−Iis quite small, at 0.014 mag or a change(decrease)inH0of 0.3% for a value determined solely
from an anchor with ground-based Cepheid photometry(LMC or MW). ForH-band transformed toF160W, the net offset besides the aformentioned color term is zero after cancellation of an 0.02 mag offset measured between HST and 2MASS NIR photometry (Riess 2011) and the same in the reverse direction from the very small count-rate non-linearity of WFC3 at the brightness level of extragalactic Cepheids(Riess2010). The mean metallicity of the LMC Cepheids is taken from their spectra by Romaniello et al.(2008)to be[O H/ ]= -0.25dex.
Using the late-type DEB distance to the LMC as the sole anchor and the Cepheid sample of Macri et al.(2015)for a set of constraints in the form of Equation (7) yields H0=72.04± 2.56 km s−1Mpc−1 (stat). As in the prior section, these fits include free parameters ΔμLMC and Δzp, with additional
constraint 0=ΔμLMC±σμ,LMC. The Appendix shows how
the system of equations is arranged for this fit. The last few equations(seeAppendix)express the independent constraints on the external distances (i.e., for NGC 4258 and the LMC) with uncertainties contained in the error matrix. Using the anchor combination of NGC 4258 and the LMC, the optimal set for TRGB calibration, gives H0=71.62±1.68 km s−
1
Mpc−1(stat). Using all three anchors, the same set used byR11 and by Efstathiou(2014), results inH0=73.24±1.59 km s−1Mpc−1 (stat), a 2.2% determination. Thefitted parameters which would indicate consistency within the anchor sample are ΔμN4258=−0.043 mag, within the range of its 0.0568 mag prior, and ΔμLMC=−0.042 mag, within range of its 0.0452 mag prior. The metallicity term for the NIR-based Wesenheit has the same sign but only about half the size as in the optical (Sakai et al. 2004) and is not well-detected with ZW=−0.14±0.06 mag dex−1 including systematic
uncertainties.
3.1.3. DEBs in M31
As discussed in Section3, we make use of a sample of 375 Cepheids in M31 in order to help characterize the CepheidP–L relations. In principle, we can also use M31 as an anchor in the determination ofH0by taking advantage of the two DEB-based
distance estimates to the galaxy (Ribas et al. 2005; Vilardell et al.2010)which have a mean of μ0=24.36±0.08 mag.
Yet, there are several obstacles with the use of M31 as an anchor. The PHAT HST program (Dalcanton et al. 2012), 15
A fourth system (HV 5936; Fitzpatrick et al. 2003) is located several degrees away from the bar and yields a distance that is closer by 3σ. Additional lines of evidence presented in that paper suggest this system lies above the disk of the LMC, closer to the Galaxy.
which obtained theHSTdata, did not use theF555Wfilter, nor did it include time-series data, so we cannot use the same individual, mean-light F555W–F814Wcolors to deredden the Cepheids in F160W as for other SH0ES galaxies (or the individual mean V−Icolors to deredden H-band data with a 0.03 mag uncertainty as for LMC and MW Cepheids as individual ground-based colors are too noisy). The best available color for measuring the individual reddenings of the M31 Cepheids isF110W–F160Wso we must recalibrate these colors to match the reddening in the V−I data. Following Riess et al. (2012), we add a constant to these colors so that their mean measuredF160Wextinction is the same as derived from the meanV−ICepheid colors in M31 based on data from the ground-based DIRECT program (Kaluzny 1998).16 The advantage of the latter approach is that it can account for differentialreddening along the line of sight while providing a reddening correction which is consistent with that used for Cepheids in all other targets. We adopt an 0.02 mag systematic uncertainty,szp,opt, between the ground-based optical colors of
Cepheids and those measured from space. With the same formalism used for the LMC but with M31 as the sole anchor we find H0=74.50±2.87 km s−1Mpc−1 (stat), consistent with the value derived from the other three anchors.
On the other hand, as previously discussed, DEB distances for early-type stars(the only ones currently measured in M31) include significant inputs from non-LTE stellar model atmo-spheres with systematic uncertainties that are hard to assess. It is somewhat reassuring to note that in the LMC, where both types of DEBs have been measured, the difference in the distance moduli obtained from either type is only 0.01±0.08 mag, a test with the same precision as the early-type DEB distance to M31. Future measurements of late-early-type DEBs or water masers in M31 (Darling 2011) would place M31 as an anchor on equal footing with the others.
To be conservative, we use as our primary determination of H0the result from the combination of NGC 4258 masers, MW
parallaxes, and LMC late-type DEBs (the same set of anchors used by R11): H0=73.24±1.59 km s−1Mpc−1 (stat). Note, however, the consistency of our primary result with the result using M31 alone. If M31 were included together with the other anchors, the resulting value of H0 would be 73.46±
1.53 km s−1Mpc−1(stat).
While the global model accounts for the covariance between all distances and model parameters, we can explore the internal agreement of the Cepheid and SN distance estimates by derivingapproximateCepheid-only distances for the 19 hosts. For each host, we remove only its SN distance from the global
fit and derive its Cepheid distance,μ0,ibased on the remaining
data. The result is a set of Cepheid distances to each host which are independent of their SN distances(although these distances are slightly correlated with each other and thus do not provide a substitute for the full analysis which accounts for such covariance). The results are listed in Table 5, column 5 as approximate Cepheid distances (i.e., ignoring the covariance) and Figure 9 shows the SN distances versus those from Cepheid optical and NIR magnitudes. Figure 10 shows an approximationto the full distance-ladderfit to provide a sense
of the sampling using the previously described approximations. These approximations should be good to∼0.01–0.02 mag. The resulting relation between the SN and Cepheid-based distances will be considered in the next section. The Cepheid-based distances for seven of the eight hosts used in R11 have a mean difference of 0.01 mag and a dispersion of 0.12 mag. The eighth host, N4038, shifted from −1.6σ to±1.7σrelative to the SN-inferred distances (Δμ = −0.37 mag, closer in this work). The shift primarily arises because we conservatively excluded a unique set of 10 variables from R11 with ultra-long periods(P>100 days)due to very sparse phase coverage and the poorly constrained properties of the P-L relation for these intrinsically rare objects (Bird et al. 2009; Fiorentino et al.2012).
4. ANALYSIS SYSTEMATICS
The statistical uncertainties quoted thus far include the full propagation of all known contributions as well as the degeneracies resulting from simultaneous modeling and characterization of the whole dataset of >2200 Cepheids (∼1000 in SN hosts), 19 SNe Ia, 15 MW parallaxes, the DEB-based distance to the LMC, and the maser distance to NGC 4258. Our model formally contains parameters used to propagate what were considered sources of systematic uncertainties in other analyses (Freedman et al. 2001, 2012; Sandage et al. 2006) such as zeropoint errors, metallicity dependences, and the slopes and breaks in the P–L relation, therefore our statistical uncertainties incorporate many effects that others consider among systematics(seeAppendix).
Following the approach of R09 and R11, we therefore explore reasonable alternatives to the global determination of H0 which are not easily parameterized for inclusion in the
framework of Section 3, and we use these to determine an additional systematic error component. While truly unknown systematic errors can never be ruled out, we address this possibility in Section 4 by comparing our measurement to independent measurements of H0 which do not utilize
SN-based distance measurements.
4.1. Cepheid Systematics
The Cepheid outlier fraction in Section3is∼2% for all hosts (or ∼5% across all SN hosts), smaller than the 15%–20% in R11. This reduction in the outlier fraction results largely from the use of a color selection inF814W–F160Waround the median color in each host to remove blends with unresolved sources of comparable luminosity and different color(e.g., red giants, blue supergiants, unresolved star clusters). This is a useful criterion as it is distance- and period-independent, insensitive to reddening, and anchored to the physical proper-ties of Cepheids(i.e., stars with spectral types F–K). The well-characterized LMC Cepheids from Macri et al.(2015) have a mean I−H of 0.96 mag with a dispersion of just 0.10 mag, much smaller than the allowed 1.2 mag breadth which alone would exclude only stars hotter than early-F or cooler than late-K (i.e., colors which cannot result from Cepheids). Because measurement errors owing to blending are correlated across bands, the uncertainty in this color is smaller than either band and a factor of ∼6 smaller than the allowed range, so colors outside the range primarily result from color blends rather than noise. Doubling the breadth of the color cut decreased H0by
0.9 km s−1Mpc−1and removing a color cut altogether lowered 16
By equating the meanV−Idereddening with that forF110W–F160W, we can solve for a color offset to ensure they yield the same result. That is,
á - ñ =V I á
0.40 1.49F110W–F160W- ñX, where á - ñ =V I 1.23mag from DIRECT gives X=0.22 mag. Note that the reddening parameters (now adopted from Fitzpatrick(1999))and the Cepheid samples differ from those used by Riess et al.(2012), leading to a different value ofX.