NBER WORKING PAPER SERIES
THE GED
James J. Heckman
John Eric Humphries
Nicholas S. Mader
Working Paper 16064
http://www.nber.org/papers/w16064
NATIONAL BUREAU OF ECONOMIC RESEARCH
1050 Massachusetts Avenue
Cambridge, MA 02138
June 2010
This research was supported by NIH R01-HD054702, the American Bar Foundation, The California
Endowment, The Commonwealth Foundation, The Nemours Foundation, the Buffett Early Childhood
Fund, the Spencer Foundation, an Anonymous funder, and the J.B. and M.K. Pritzker Foundation.
We are grateful for the helpful comments of the Handbook authors present at the CESIfo Munich conference.
We also received helpful research assistance from Pana Alvarez and Joel Han. We would like to personally
thank Lois M. Quinn, who provided valuable comments. The views expressed in this paper are those
of the authors and not necessarily those of the funders or other parties listed here. A more complete
description of the GED program is presented in our two books, Heckman, Humphries, and Mader
[2010a,b]. The views expressed in this paper are those of the authors and not necessarily those of the
funders, other parties listed here, or the National Bureau of Economic Research.
NBER working papers are circulated for discussion and comment purposes. They have not been
peer-reviewed or been subject to the review by the NBER Board of Directors that accompanies official
NBER publications.
© 2010 by James J. Heckman, John Eric Humphries, and Nicholas S. Mader. All rights reserved. Short
sections of text, not to exceed two paragraphs, may be quoted without explicit permission provided
The GED
James J. Heckman, John Eric Humphries, and Nicholas S. Mader
NBER Working Paper No. 16064
June 2010, Revised September 2010
JEL No. I21,J24,J31
ABSTRACT
The General Educational Development (GED) credential is issued on the basis of an eight hour subject-based
test. The test claims to establish equivalence between dropouts and traditional high school graduates,
opening the door to college and positions in the labor market. In 2008 alone, almost 500,000 dropouts
passed the test, amounting to 12% of all high school credentials issued in that year. This chapter reviews
the academic literature on the GED, which finds minimal value of the certificate in terms of labor
market outcomes and that only a few individuals successfully use it as a path to obtain post-secondary
credentials. Although the GED establishes cognitive equivalence on one measure of scholastic aptitude,
recipients still face limited opportunity due to deficits in noncognitive skills such as persistence, motivation
and reliability. The literature finds that the GED testing program distorts social statistics on high school
completion rates, minority graduation gaps, and sources of wage growth. Recent work demonstrates
that, through its availability and low cost, the GED also induces some students to drop out of school.
The GED program is unique to the United States and Canada, but provides policy insight relevant
to any nation's educational context.
James J. Heckman
Department of Economics
The University of Chicago
1126 E. 59th Street
Chicago, IL 60637
and University College Dublin and IZA
and also NBER
[email protected]
John Eric Humphries
Department of Economics
1126 E. 59th Street
Chicago IL 60637
[email protected]
Nicholas S. Mader
University of Chicago
Department of Economics
1126 E. 59th Street
Chicago IL 60637
[email protected]
Contents
1 Introduction 4
2 Institutional Background and Functions of the GED 6
2.1 The GED Test . . . 6
3 The Eects of GED Certication 13 3.1 The Direct Benet of GED Certication . . . 13
3.1.1 Average Labor Market Outcomes . . . 13
3.1.2 Heterogeneous Labor Market Returns . . . 19
3.1.3 Cognitive and Noncognitive Ability . . . 28
3.2 Educational Attainment . . . 35
4 Changes and Growth in the GED Test Taking Population 41 4.1 Government Education and Training Programs . . . 42
4.2 Changes in the Costs and Benets to Education . . . 43
4.3 Growth in High School-Age Test Takers . . . 48
4.4 Summing up the Sources of Growth of GEDs . . . 52
5 Adverse Consequences of the GED 54 5.1 The GED Induces Would-Be High School Graduates to Drop Out . . . 54
5.2 The GED Inates High School Graduation Statistics . . . 55
5.3 The GED Obscures the Actual Returns to Education . . . 58
1 Introduction
The General Educational Development (GED) program has become a major factor in American education.1 Dropouts from high school can take a seven hour battery of tests to obtain a GED credential. GEDs are widely held to be equivalent to individuals who receive a traditional high school diploma by taking courses and acquiring credit hours. Indeed, capturing this sentiment, many erroneously term the GED certicate as a General Equiv-alency Degree. The GED program is quantitatively signicant. Figure 1 shows that currently 12% of all high school credentials issued are GEDs,2 and that there has been substantial growth overtime in the number of GED certicates issued.
This chapter reviews a body of literature, starting with Cameron and Heckman [1993], that shows that GEDs are not equivalent to ordinary high school graduates. GEDs have higher achievement test scores than dropouts in part because they complete more years of high school. Controlling for their greater scholastic ability, GEDs are equivalent to uncredentialed dropouts in terms of their labor market outcomes and their general performance in society. On average, obtaining a GED does not increase the wages of dropouts. While GEDs go to college at higher rates than dropouts, few nish more than one semester. The same traits that lead them to drop out of school also lead them to leave from jobs early, to divorce more frequently, and to fail in the military.3
Given the preponderance of evidence against benecial eects of GED certication for the average GED recipient, it is surprising that the GED program has grown so dramatically in the past 50 years. We examine explanations for its growth. A primary cause is the growth of government programs that promote the GED as a quick x for addressing the high school dropout problem. Adult Education programs and programs designed to promote convict rehabilitation are major contributors, the latter being especially important for African-American males. We present evidence that high schools are increasingly promoting the use of the GED.
None of this would matter if the GED were harmless, like wearing a broken watch and knowing that it is broken. But the GED is not harmless. Treating it as equivalent to a high school degree distorts social statistics and gives false signals that America is making progress when it is not. A substantial part of the measured convergence of black and white high school attainment is fueled by prison-issued GEDs. Counting GEDs as dropouts, the African-American
1The GED program is unique to the United States and Canada, but analysis of this program provides general insights into the
limitations of using achievement exams to certify preparedness for schools and the workplace.
2Henceforth, GED refers either to the certicate itself or to an individual who has received a GED certicate, depending on the
context. GEDs refer to individuals who choose to certify by the GED, GED program is used to refer to the entire program, and GED test refers to the test itself.
Figure 1: Growth in the GED - Percent of High School Credentials and Number of Takers
Sources: National Center for Education Statistics [Various Years], and GED Testing Service [1958-2008]. Notes: The spike and fall in 2001-2002 is from a change in test series combined with an increase in passing standards. The percent of high school credentials statistic is calculated by dividing the number of GEDs issued divided by the sum of diplomas and GEDs issued that year.
male high school graduation rate in 2000 is at the same level as it was in 1960. Improperly counting GEDs as high school graduates also overestimates the returns to college. We document how American social statistics are distorted by assuming that GEDs are equivalent to ordinary high school graduates. We also show how the GED creates problems. It induces students to drop out of school and lose the benets of a high school degree.
There are larger lessons from a study of the GED program. GEDs are as smart as ordinary high school graduates, as measured by a scholastic achievement test. Yet, as a group, GEDs fail to perform at the level of high school graduates. We show that noncognitive decits such as lack of persistence, low self-esteem, low self-ecacy, and high propensity for risky behavior explain the lack of success for many GEDs. Decits of what are sometimes called soft skills are often not taken into account in public policy discussions involving economic opportunity. A study of the GED shows the inuence of personality traits on success in life and the need for public policies that address both cognitive and personality decits.
This paper is organized as follows: Section 2 provides a short introduction to the GED, its structure, and a brief history. Section 3 looks at dierences among dropouts, GEDs, and high school graduates, and discusses the evidence on labor market performance and educational attainment of GEDs. Section 4 presents evidence on the sources of growth of the GED program, and the changes over time in demographic groups it serves. Section 5 reviews the
adverse consequences of the GED. Section 6 concludes.
2 Institutional Background and Functions of the GED
There are substantial consequences of being a high school dropout. Wage premia for education have increased over the last three decades. Using Census PUMs data, Goldin and Katz [2008] report that the wage dierential between high school graduates and dropouts grew from 16.7% in 1970, to 21% in 1990, to 25.5% in 2000. Figure 2, reproduced from Autor, Katz, and Kearney [2008], shows that real wages by educational level have diverged across time for both males and females. At the same time that real wages for those with college are steadily increasing, real wages for male dropouts are currently below their 1963 levels, and real wages for female dropouts are eectively unchanged since 1970.
Figure 3 shows that across cohorts, college attendance and college completion have both increased.4 The rate of college attendance conditional on nishing high school, and the rate of college graduation conditional on attendance have both trended upward. The outlier is the high school graduation rate, which has trended downward starting with the 1950 birth cohort. The growth in people seeking alternative certication through the GED is a major contributor to this trend. Figure 4 shows that dropout rates since 1970 have decreased if GEDs are counted as high school graduates, but have increased if they are counted as dropouts.
2.1 The GED Test
The GED was introduced by the American Council on Education (ACE) in 1942 as a credential for returning World War II veterans who entered the armed services before completing high school.5 The test was originally used as a tool for placing returning veterans in college and high school. It was quickly expanded as a method for earning high school diplomas or equivalency credentials.
States began to oer the test to civilians in the late 1940s and, by 1959, civilian GED test takers outnumbered veteran GED recipients [GED Testing Service 1958-2008, Quinn 2002]. Relative to its very targeted beginning, the GED program has expanded to serve dropouts across a wide population. The GED currently targets a large and diverse population, including many who are unqualied to join the military [Laurence, forthcoming].6
4Figure 3 does not count GEDs as high school graduates. 5See Quinn [2002] for a detailed exposition of the GED's history.
Figure 2: Log Wage Levels By Education
Figure 3: Trends in Educational Attainment 80% 90% 50% 60% 70% e 30% 40% 50% Percentag e 0% 10% 20% 0% 1900 1907 1914 1921 1928 1935 1942 1949 1956 1963 1970 1977 Year of Birth
Graduate High School Attend College Attend College Given Graduate HS Graduate College Graduate College Given Attended
Source: Reproduced from Heckman and LaFontaine [2010], Figure XIII. Notes: 3-year moving averages based on Current Population Survey (CPS) October, Census, CPS March and National Center for Education Statistics (NCES) data. HS graduates are those who obtained a regular public HS diploma (excluding GEDs) from the NCES. "Graduate HS" is the fraction of 8th grade enrollments for a given cohort who report a regular HS diploma. "Attend Given HS" is the fraction of recent HS graduates who report being enrolled the fall of the year following graduation. "Attend College" is college enrollments of recent HS graduates as a fraction of 18 year old cohort size. College graduates are those who report a BA or higher by age 25. "Graduate Given Attend" is those who obtained a four year degree as a fraction of the college enrollment total for that cohort. Two-year degrees are not included. "Graduate College" is the number of college graduates as a fraction of the 18 year old cohort size. Population estimates are from the Census P-20 reports. HS diplomas issued by sex are estimated from CPS October data after 1982.
Figure 4: The eect of including/excluding GEDs in the calculation of the dropout rate 7% 8% 9% 10% 11% 12% 6% 7% 8% 9% 10% 11% 12% 1970 1980 1990 2000
Dropouts (Excluding GEDs) Dropouts (Including GEDs)
26% 22% 26% 18% 22% 26% 10% 14% 18% 22% 26% 6% 10% 14% 18% 22% 26% 6% 10% 14% 18% 22% 26% 1970 1980 1990 2000
GEDs as % of All Dropouts 6% 10% 14% 18% 22% 26% 1970 1980 1990 2000
GEDs as % of All Dropouts 6% 10% 14% 18% 22% 26% 1970 1980 1990 2000
GEDs as % of All Dropouts
Sources: GED Testing Service (1958-2008), and U.S. Decennial Census 1970-2000. In the left-hand panel, all percentages are status dropout rates for 20-to-24-year-olds, except for 1970 which reects status dropout rates for 20-to-23-year-olds. In the right-hand panel, the data series shows GEDs as a percentage of all credentialed and uncredentialed dropouts.
Figure 5: GED Sample Questions
Source: Reproduced from Bobrow [2002]. Notes: The source is a preparation guide for the most recent 2002 series of the GED test.
The GED Test: The GED exam has been a battery of ve tests since its introduction. Its content has been updated three times with the introduction of new series designed to keep the test relevant to job skills and educational requirements [GED Testing Service, 2009]. The current version of the GED test takes just over seven hours to complete and focuses on interpretation and analysis of information rather than on factual recall. The reading section has changed from being a general reading comprehension test to a test of reading real life work materials or newspaper articles. The math content demands more analysis and synthesis than factual recall. Examples of an easy and hard math problem are shown in Figure 5. The GED test introduced a short essay or writing sample starting in 1988, and the use of a calculator for part of the math subsection was introduced on the 2002 test series [GED Testing Service, 1958-2008].
It was initially decided that the pass score should be set so that 80% of graduation-bound high school seniors could pass [Boesel et al. 1998, Quinn 2002]. An analysis of the 1943 norming study suggests that the 80% pass rate overstates the actual diculty of the original test [Quinn, 2002]. Quinn [2002] also highlights that the original test included a high probability of passing due to chance.
After three increases in the diculty of the test, only 60% of current graduation-bound high school seniors are now estimated to be able to pass the entire test on their rst try [GED Testing Service, 2009].
Key changes to the GED test are displayed in Table 1, which also documents the expansion of the test. In 1947, New York was the rst state to oer the test to civilian dropouts [Quinn, 2002]. In 1974, California was the last state to oer a recognized GED certicate for passing the GED test. The table covers the three changes in test series as well as the three changes in test diculty. For more details on the GED's history, content, standards, norming, and scoring procedures see Section A of the Web Appendix (http://jenni.uchicago.edu/GEDHandbookChapter/).
GED Preparation and Means of Benet: The data on preparation times suggest that study for the GED is likely to lead to little or no human capital formation. In 1980, the median test-taker had studied for 20 hours and, in 1989, had invested 30 hours of preparation [Quinn 2002, GED Testing Service 1958-2008].7 However, a sizable number of individuals study more than 100 hours, growing from 11.8% to 24.2% of takers in that same period. This indicates that certain populations may benet somewhat from their preparation for the GED. To put this statistic into perspective, an average high school student spends approximately 1,080 hours in class a year [Carroll, 1990].
changes in the demographic groups served by the GED have led to dierences in composition away from the motivated, disciplined group of individuals to whom it was initially targeted.
Table 1: Key Changes to the GED
Year Changes to the GED Testing Program
1942 GED test introduced for veterans. 80% of graduation bound high school seniors said to be able to pass all five batteries
1947 New York offers GED test to civilian high school dropouts
1959 More civilians taking the GED test than veterans
1974 California becomes last state to introduce GED test for dropouts 1978 Second series of the GED test introduced. Test time of 6 hours. 1981 Time limit extended to 6.75 hours. National Minimum age for testing
abolished
1982 Standardsseniors said made to be more able todifficult, pass the 75% entire of graduate test bound high school 1988 Thirdsample. series Time of extended GED test tointroduced. 7.5 hours Firstfor taking series the to includetest a writing 1992 National minimum age for GED test taking of 16 implemented 1997 Passingschool seniors standards said made to be moreable todifficult, pass the 67% entire of graduate test bound high
2002
Fourth series of the GED test introduced. Calculator allowed for first
time on parts of the math test. Passing standards made more difficult,
60% of graduate bound high school seniors said to be able to pass the
entire test. Test time of approximately 7 hours.
More recently, Zhang et al. [2009] nd that, in 2006, the median study time for those who reported studying for the GED was 25 hours.
At the same time, the availability of the GED may induce a decrease in the eort spent on schooling. The academic literature often compares outcomes for GEDs to those for dropouts. However, for many individuals, the relevant counterfactual comparison is between the GED and high school graduation. As passing the GED requires substantially less eort than completing high school, its availability induces many students who would otherwise complete school to leave [Heckman et al. 2008, Humphries 2010]. This evidence is corroborated by a 2002 survey by the National Center for Education Statistics [2006] which found that 40.5% of surveyed high school dropouts listed would be easier to get the GED as among their reasons for leaving school. Behind Missed too many school days, this was the second most frequently cited reason for leaving.
With the possible exception of individuals in the right-hand tail of the preparation time distribution, it seems unlikely that GED test takers are producing valuable human capital that will directly increase their wages. However, as a widely-recognized credential that tests for certain types of ability, it may serve as a signal to employers, the military, and post-secondary institutions that the individual is more capable than the average uncredentialed dropout.8 A key caveat to the signaling argument is that the signaling value of a GED will reect all associations due to sorting, such as through disproportionate receipt by the incarcerated or unmotivated takers who are able to complete high school but choose not to. The quality of the signal has changed over time due to shifts in the attributes of the GED-certied population.
GED Acceptance: The extent to which employers and colleges treat the GED as equivalent to a high school diploma is uncertain. A poll reported by the Society for Human Resource Management [2002] nds that 96% of U.S. employers and training programs respond armatively to the question Does your company accept applications with a GED credential for jobs requiring a high school degree? [GED Testing Service, 2009]. A positive response suggests that a GED is an acceptable prerequisite for consideration, but does not indicate what relative weight employers give to the GED.
The GED's wide acceptance as a valid prerequisite for admission to post-secondary institutions suggests that the GED might facilitate human capital development. A poll by the The College Board [2007] nds that 98% of colleges respond positively to the prompt that High school diploma is required and GED is accepted. Again, it is unclear
if GEDs get equal consideration for admission relative to high school graduates.
3 The Eects of GED Certication
Section 3.1 reviews the literature on the value of the GED credential in labor markets. Section 3.2 focuses on the question of whether, and for whom, the GED leads to enrollment and completion of post-secondary education.
3.1 The Direct Benet of GED Certication
This section demonstrates that pre-existing dierences in traits causally unrelated to the eect of the GED are responsible for the dierent labor market outcomes experienced by dropouts and GEDs. The early literature on the topic found that GED certication has little or no eect on labor market outcomes for the average test taker. Subsequent work has attempted to identify dierent populations and margins for which it might hold more value.
3.1.1 Average Labor Market Outcomes
Raw comparisons of earnings, wages, and hours worked based on the National Longitudinal Study of Youth 1979 (NLSY79) data are displayed in Figure 6.9 This gure shows the gap in wage income, hourly wages, and hours worked for terminal GEDs and terminal high school graduates over uncredentialed dropouts. There is a clear ordering among dropouts, GEDs, and traditional high school graduates in each measure. These dierences persist across the life cycle, with the wage and hours premia for higher credentials increasing from their late 20s to their late 30s.
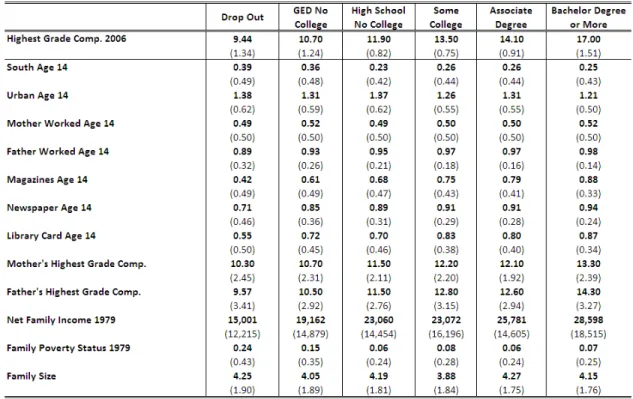
Background Dierences Among Dropouts, GEDs, and High School Graduates: The dierences in labor market outcomes among these three groups can be largely explained by pre-existing characteristics that may generate economic returns, creating a non-causal association among education levels and wages. Tables 2 and 3 show comparisons of early life characteristics by nal level of education for white males in the NLSY79 and in the
9The NLSY79 is a survey starting in 1979 following a nationally representative cohort of individuals age 14 to 21 with follow up
interviews at least every two years on a wide range of social, educational, and economic variables. For more details on the NLSY79, see Section B.1 of the Web Appendix (http://jenni.uchicago.edu/GEDHandbookChapter/).
Figure 6: Economic gaps relative to dropouts: GEDs and high school graduates for males (A) and females (B)
(A) Male Economic Gaps Relative to Dropouts: GEDs and High School Graduates
(B) Female Economic Gaps Relative to Dropouts: GEDs and High School Graduates
Source: National Longitudinal Survey of Youth 1979 (NLSY79). Notes: Regressions control for age, mother's highest grade completed, and dummies for urban residence at age 14, Southern residence at age 14, and race. The regressions use the cross-sectional subsample and minority oversamples of the NLSY79 data. The estimation sample is restricted to individuals who never attend college and who have not yet been incarcerated. Regressions for hourly wage and hours worked are restricted to those reporting more than $1/hour and less than $100/hour, and individuals working less than 4,000 hours in a given year. Wage income regressions are restricted to individuals reporting wage incomes between $1,000/year and $100,000/year. All monetary values are in 2005 dollars. Standard errors are clustered by individual. 95% condence bands are displayed for each bar chart.
Table 2: Comparison of Key Characteristics by Educational Level - White Males - NLSY79
Source: National Longitudinal Survey of Youth 1979 (NLSY79). Notes: All results are from 1979 using nationally
representative weights. Notes: Family size includes both parents and children. Net family income in 1979 dollars. Standard errors in parenthesis.
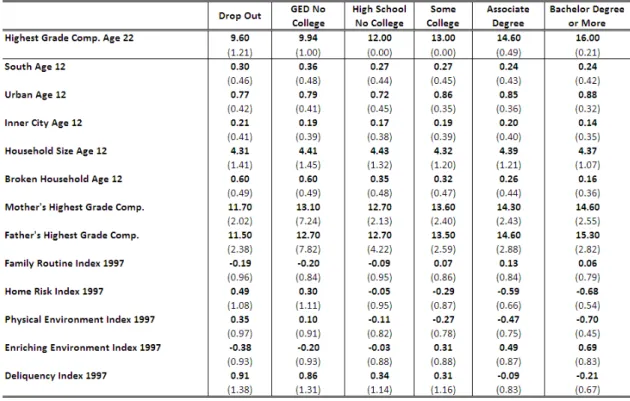
National Longitudinal Survey of Youth 1997 (NLSY97) data sets.10,11
These tables show a clear ordering across nal levels of educationnotably highest grade completed, magazine subscriptions and home environment indices, family income, and poverty rates. Terminal GEDs (i.e. those that do not continue to college) generally fall between dropouts and terminal high school graduates. There are some exceptions. In the NLSY97, the parents of GED recipients are more educated than parents of high school graduates, and GEDs are as likely or more likely to come from a broken household than are dropouts.12 The dierences in these measures demonstrate the potential importance of controlling for pre-existing heterogeneity among educational groups.
10The NLSY97 is a survey starting in 1997 following a nationally representative cohort of individuals age 12 to 16 with follow up
interviews every year on a wide range of social, educational, and economic variables. For more details on the NLSY97, see Section B.2 of the Web Appendix (http://jenni.uchicago.edu/GEDHandbookChapter/).
11These statistics are reported for other races and gender groups in Section C.1 of the Web Appendix
(http://jenni.uchicago.edu/GEDHandbookChapter/). A similar pattern characterizes the other groups.
12In Section C.1 of the Web Appendix (http://jenni.uchicago.edu/GEDHandbookChapter/) we show that minority GEDs have higher
Table 3: Comparison of Key Characteristics by Educational Level - White Males - NLSY97
Source: National Longitudinal Survey of Youth 1997 (NLSY97). Notes: All results are from 1997 using nationally
representative weights. All index scores are standardized mean zero, standard deviation one. See Section B.2.2 of the Web Appendix(http://jenni.uchicago.edu/GEDHandbookChapter/) for detail on the construction of the family routine, home risk, physical environment, enriching environment, and delinquency indices. Standard errors in parenthesis.
Dropouts, terminal GEDs, and terminal high school graduates also dier in their performance on academic tests, which are predictive of earnings. The Armed Forces Qualication Test (AFQT) was administered in the NLSY79 and in the NLSY97, and is a commonly used measure of academic, or cognitive, ability.13,14 When the AFQT
was administered, the surveyed individuals were of dierent ages and had acquired dierent levels of schooling. These dierences aect their measured performance. In order to make comparisons of academic ability, we adjust individual scores to account for the level of schooling at the time of the test. This adjustment controls for nal educational attainment using a structural model as laid out in Hansen et al. [2004] and implemented in Heckman, Urzua, and Veramendi [2010]. This allows comparisons of latent cognitive ability between dropouts, GED recipients, and high school graduates prior to schooling decisions.
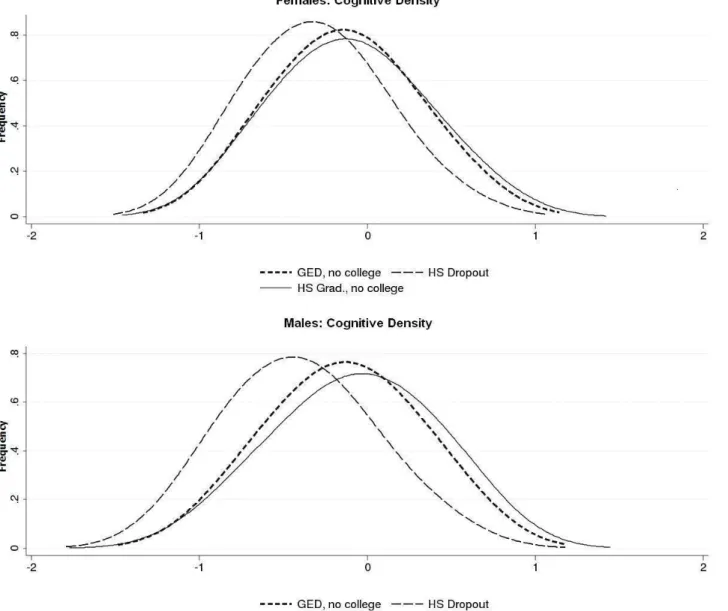
The comparisons in Figure 7 show that, before entry into high school, individuals who eventually GED certify have higher cognitive ability than dropouts, and are very similar to terminal high school graduates. The cognitive ability distribution for GEDs is nearly identical to that of high school graduates and is strongly right shifted from uncredentialed dropouts for both males and females.
Accounting for Cognitive Ability: Cameron and Heckman [1993] nd that the GED provides on average no benet to male test takers after controlling for either years of completed schooling or AFQT scores. While their study follows the NLSY79 sample through age 28, subsequent analysis replicates this nding through later ages. Heckman and LaFontaine [2006] use later waves of the NLSY79 and nd that the GED has no benet on average log hourly wages after controlling for AFQT. They nd that high school graduation is still associated with a positive wage premium. Once Heckman and LaFontaine correct for selection and control for AFQT scores, male GEDs earn on average 1% less per hour than dropouts while terminal high school graduates make 3.6% more per hour on average than dropouts. Similarly they nd that female GEDs earn 1.7% more per hour than dropouts while high school graduates with no college earn 10.6% more per hour. They also show that the GED has little or no benet after controlling for reported test scores using the National Adult Literacy Survey (NALS) data.
Figure 8 shows that, relative to the dierences shown in Figure 6, the economic benets associated with the GED are greatly reduced and become statistically insignicant once pre-existing cognitive ability is controlled for.15 When
13The Armed Forces Qualication Test is an achievement test measuring numerical operations, arithmetic reasoning, paragraph
completion, and word knowledge. The AFQT was administered to individuals in the NLSY79 in 1979 when they were aged 14 to 22, and to individuals in the NLSY97 in 1999 when they were age 14 to 18. The AFQT tests administered to each sample represented the same content, but diered in format and scoring procedure. See Section B.1.1 of the Web Appendix (http://jenni.uchicago.edu/GEDHandbookChapter/) for more details.
14Borghans, Golsteyn, Heckman, and Humphries [2010] show that the AFQT is predicted by both cognitive and noncognitive traits. 15To obtain the baseline standardized mean test score adjusted to the seventh grade level, we remove the estimated mean impact of
Figure 7: Cognitive ability by educational status (no college sample, all ethnic groups)
Source: Reproduced from Heckman, Urzua, and Veramendi [2010]. National Longitudinal Study of Youth 1979. Notes: The distributions above represent cognitive ability factors estimated using a subset of the Armed Services Vocational Aptitude Battery and educational attainment as laid out in Hansen, Heckman, and Mullen (2004). Sample restricted to the cross-sectional subsample for both males and females. Distributions show only those with no post-secondary educational attainment. The cognitive ability factors are separately normalized to be mean zero standard deviation one.
including estimated post-high school AFQT scores, the benet of the GED is further reduced for all three economic outcomes. For terminal high school graduates, however, economic benets persist after controlling for pre-existing cognitive ability. This suggests a causal eect of high school graduation. That high school still has value after controlling for pre-existing cognitive ability suggests high school graduates possess a valued trait not captured by an achievement test. Section 3.1.3 extends this discussion to encompass both cognitive and noncognitive ability. The next section follows the development of the literature in trying to identify specic populations that benet from the GED.
3.1.2 Heterogeneous Labor Market Returns
Recent work on the GED has sought to identify groups of test takers for which individual traits or circumstances contribute to a stronger signal or increased human capital development. This section focuses on several dierent potential margins of benet, discusses hypotheses and reviews the related literature.
Wage Growth for GEDs with Experience: It is argued that, similar to the pattern of returns to college, the benets to a GED would increase with time in the labor market. Clark and Jaeger [2006] present evidence from the Current Population Survey (CPS) that is apparently consistent with the hypothesis that the wage premium to GED certication for males is increasing with age. Given the cross-sectional nature of the CPS data, this nding may be attributed to either experience eects or cohort eects. Using white males and females in the NLSY79 sample, Heckman and LaFontaine [2006] show that this higher premium to older cohorts is explained by their greater ability. When not controlling for ability, the NLSY79 sample shows a wage premium for GED recipients that is comparable to that found in samples of individuals from the CPS data for the same birth cohorts. Once one controls for AFQT scores for the NLSY79 sample, there is no statistically signicant eect of certication on wages.
Using longitudinal data on earnings in the NLSY79, Murnane et al. [1995] argue that the value of the GED increases with experience as recipients use the degree's signal for promotion, better job placement in the future, and
on-the-schooling attained over the seventh grade level using the procedure of Hansen et al. (2004) as implemented in Carneiro, Heckman, and Masterov [2005]. LetStbe the random variable denoting schooling attained at yeart(the date of the survey) and letstbe its realized value. LetSF be the random variable denoting the nal level of schooling attained andsF its realized value. LetT(st, sF)be the test
score at timetfor a person whose schooling at the time of the test isSt=stand whose nal schooling level isSF=sF. The assumption
of the procedure is that the unobservables generatingT(st, sF)are mean independent ofSt givenSF=sF. For eachSF =sF, we can identify the causal eect of a year of schooling on the test score for each level of completed nal schooling. Then we can adjust the mean test score to baseline levelsSt=sbby subtracting the termE(T(st, sF) ∣St=st, SF =sF)−E(T(sb, sF) ∣St=sb, SF=sF). Both
terms are identied, assuming in addition that at the time of the test for each level ofSF=sF, there are some persons at schooling level St=sb. Post schooling mean test scores are obtained in a similar fashion, but now adjusting to years of nal schooling. See Section D
Figure 8: Ability-adjusted economic gaps relative to dropouts: GEDs and high school graduates for males (A) and females (B)
(A) Male ability-adjusted economic gaps relative to dropouts: GEDs and high school graduates
(B) Female ability-adjusted economic gaps relative to dropouts: GEDs and high school graduates
Source: National Longitudinal Survey of Youth 1979 (NLSY79). Notes: Regressions control for baseline AFQT scores, age, mother's highest grade completed, and dummies for urban residence at age 14, Southern residence at age 14, and race. Baseline test scores are estimated using the procedure of Hansen et al. 2004 as implemented in Carneiro, Heckman, and Masterov [2005]. The regressions use the cross-sectional subsample and minority over-samples of the NLSY79 data. The estimation sample is restricted to individuals who never attend college and who have not yet been incarcerated. Regressions for hourly wage and hours worked are restricted to those reporting more than $1/hour and less than $100/hour, and individuals working less than 4,000 hours in a given year. Wage income regressions are restricted to individuals reporting wage incomes between $1,000/year and $100,000/year. All monetary values are in 2005 dollars. Standard errors are clustered by individual. 95% condence bands are displayed for each bar chart.
job training. Consistent with Cameron and Heckman [1993], they nd no treatment eect of the GED on mean wage levels at age 28, but they report a statistically signicant 2.4% wage increase for every year of experience after receiving a GED. Murnane, Willett, and Boudett [1999] control for cognitive ability or individual xed eects in dierent models specications. They nd that the complementarity of GED and years of experience is statistically signicant only for individuals with low ability.
Murnane, Willett and Boudett pool person-year observations in their regressions. They infer increasing returns to the GED from variables interacting GED receipt with years of experience. In contrast to this approach, Heckman and LaFontaine [2006] estimate separate regressions for earnings at dierent ages, allowing separate estimates of returns to ability and experience by age. They nd that there is no statistically signicant eect to GED certication at any age for both white males and white females.
Males vs. Females: Males and females might derive dierent value from the GED through having dierent motivations for dropping out of school. Using data from the NLSY79 Market Experience survey, Rumberger [1983] presents dierences in self-reported reasons for dropping out for males and females.16 Males were 65% more likely than females to report school related issues, indicating dislike of school, being expelled, and poor performance as their primary reason for leaving school. Among other explanations, males were more likely to leave school due to economic reasons while a third of all women left due to pregnancy or marriage. If there are gender dierences in later-life motivations to work and seek higher education, there could be dierential value of the GED for men and women.
Cao, Stromsdorfer, and Weeks [1996] test for the GED's direct eect on economic outcomes for women using data from the NLSY79 and from Washington State. Given their focus on women who may have custody of children and be eligible for public transfer programs, they attempt to eliminate selection bias related to both the decision to participate in the labor force and to not enroll in welfare. They nd no statistically signicant dierences between the labor supplies of women of dierent education levels. The positive association of GED certication with hourly wage is eliminated by controlling for the number of years of schooling completed at the time people drop out. Table 4 presents a comparison of qualitative ndings for males and females from selected papers in the literature and information on which data sets and cohorts are studied. In addition, both Murnane et al. [2000] and Tyler et al. [2003] use the High School and Beyond (HSB) data set and nd, respectively, positive eects of GED certication
Table 4: Literature Summary - Labor Market Eects - Males vs. Females
Study Data Population Method/Identification GED Effect Findings
Cameron and Heckman (1993) NLSY79 (1979-1987) White males
Control for cognitive ability, correction for self-selection into
working status
1/0 GED1 Income: no effectWage: no effect
Murnane, Willett and Boudett (1995) NLSY79 (1979-1991) Males 1/0 if ever got GED (1/0 GED) x (work experience)
Income: no effect Wage: (+,**) NLSY79 (1979-1991),
Correction for self selection into Hours worked: no effect Cao, Stromsdorfer and Weeks (1996)
( ),
Washington State Family Income Study
Females Correction for self-selection into
working status 1/0 GED
Hours worked: no effect Wage: no Effect
Heckman and LaFontaine (2006) NLSY79 (1979-2001) Males and females
Control for cognitive ability, correction for self-selection into
working status
1/0 GED Wage: no effect
Notes: [1] "1/0" refers to a binary indicator of the associated variable. For example, under GED Effect "1/0 GED" refers to 1 = receives GED, 0 = does not, indicating a simple binary treatment effect.
treatment effect.
The study samples are statistically representative of the US unless otherwise indicated in the "Population" field. The "Findings" field codes no statistically signficant effect as "No effect", and otherwise shows (<indicator of a positive or negative finding>, <level of significance>) where * = p < .10, ** = p < .05, and *** = p < .01.
See the Web Appendix (http://jenni.uchicago.edu/GEDHandbookChapter/) for tables with more detail on each paper's outcomes examined, lists of regressors, and point estimates for each regression specification.
on the earnings of low-ability males and on the hours worked by low-ability females.17 Because neither study can identify the sources of selection of each gender into drop out statusor selection into educational status and work in generalit is dicult to interpret these ndings.
Using evidence from the NLSY79, CPS, and NALS, Heckman and LaFontaine [2006] establish that both male and female GEDs have higher wages than dropouts and that, for both genders, the explanation is sorting by ability and not a causal eect of the GED. They consistently nd a small but statistically signicant benet for females of 1-2% on hourly wage which is not present or slightly negative for males. This nding is consistent with the hypothesis that females are more likely to drop out of high school for reasons unrelated to intrinsic labor market motivation, for example, due to pregnancy. Similarly, they nd much larger benets from high school graduation for females than for males.
Native vs. Foreign Born: While much has been written about the education and labor market performance of immigrants,18little attention has been paid to the value they receive from earning a GED. Clark and Jaeger [2006] argue that the GED might provide a signal of ability that is more familiar to employers than educational credentials earned outside the country, or may signal language ability and cultural assimilation. Clark and Jaeger use earnings data in the CPS and nd that only foreign-born GEDs with no domestic credentials have a statistically signicantly higher wage than native-born dropouts.
Heckman and LaFontaine [2006] examine the Clark and Jaeger [2006] analysis and nd that their results are produced by data artifacts and limitations. One source of bias in the Clark and Jaeger [2006] analysis is that
17See Section B.5 of the Web Appendix (http://jenni.uchicago.edu/GEDHandbookChapter/) for more details on the High School and
Table 5: Literature Summary - Labor Market Eects - Native vs. Foreign Born
Study Data Population Method/Identification GED Effect Findings
Clark and Jaeger (2006) CPS Foreign born, males
and females OLS
(1/0 GED1) x (foreign
born) Wage: (+, ***) Heckman and LaFontaine (2006) CPS, excluding wage
imputation Males and females Individual fixed effects 1/0 GED Wage: no effect
NALS (1992) Foreign born, males d f l
Control for cognitive ability,
correction for self-selection into (1/0 GED) x (foreign
b ) Wage: no effect NALS (1992)
and females correction for self selection into
working status born)
Wage: no effect
Notes: [1] "1/0" refers to a binary indicator of the associated variable. For example, under GED Effect "1/0 GED" refers to 1 = receives GED, 0 = does not, indicating a simple binary treatment effect.
The study samples are statistically representative of the US unless otherwise indicated in the "Population" field. The "Findings" field codes no statistically signficant effect as "No effect", and otherwise shows (<indicator of a positive or negative finding>, <level of significance>) where * = p < .10, ** = p < .05, and *** = p < .01.
See the Web Appendix (http://jenni.uchicago.edu/GEDHandbookChapter/) for tables with more detail on each paper's outcomes examined, lists of regressors, and point estimates for each regression specification.
regression specification.
the CPS imputes values of missing wages for GEDs by sampling earnings of high school graduates, a process that contaminates comparisons of the outcome dierences between those two groups and dropouts. A second source of bias is the reliance on cross-sectional variation of wages. By making longitudinal comparisons with the CPS data, Heckman and LaFontaine [2006] nd that receipt of a GED has no eect on earnings and explain Clark and Jaeger's ndings as due to sorting along characteristics unmeasured in the CPS. Heckman and LaFontaine also analyze the NALS which also identies the foreign born. They demonstrate no earnings premium to GED receipt for any group once selection and cognitive ability are controlled for. Table 5 shows a comparison of qualitative ndings for native-and foreign-born individuals from selected papers in the literature native-and information on which data sets native-and cohorts are studied.
Signaling: Tyler et al. [2000] use a dierence-in-dierences approach to examine the returns to the GED for individuals at the cusp of passing the test. Using variation in test score thresholds across states, they contend that focusing on individuals who would pass the GED under one regime but not under the other will identify the signaling eect of the GED for people at that margin. Using data from the GED Testing Service and Social Security Administration, they separate individuals into groups by performance on the GED exam and state of residence. Variation in the passing standards enforced by dierent states arguably creates a natural experiment where individuals with the same score do or do not pass the GED based on their state of residence. To understand their paper we use the notation in Table 6. Let - over a variable denote its mean.
The dierence-in-dierences estimator (DID) used by Tyler et al. [2000] is:
DID=(Y¯LS,LP−Y¯LS,HP)−(Y¯HS,LP−Y¯HS,HP). (1)
Table 6: Treatment Classications of Individuals in Tyler et al. [2000]
Low GED Score ("LS") High GED Score ("HS") State of Residence has Low Passing Standard ("LP") YLS,LP
(GED)
YHS,LP
(GED) State of Residence has High Passing Standard ("HP") YLS,HP
(no GED)
YHS,HP
(GED)
standardB, whereAis either low score (LS) or high score (HS), andBis either low passing standard (LP) or high
passing standard (HP). Because their analysis only includes individuals measured in the neighborhood of GED
passing standards, none of the individuals studied are high scoring in an absolute sense.
The rst term in equation (1) takes the dierence in average earnings between individuals who have the same ability but dierent credential status. The second term is used to adjust for the possibility that wages in the two states in the rst dierence are unequal. The second dierence is an estimate of the baseline wage dierence across those states for individuals with the GED credential at the same low ability margin (in absolute terms).19
Tyler et al. [2000] report a 10-19% earnings benet to GED certication at the margin for whites.20 They argue that these estimates are consistent with earlier studies whose ndings of no eect of certication only apply to the average test taker. They claim that for the particular margin they investigatethat of low-skilled takersthere are high signaling benets to certication that are absent for the general population of test takers.
To defend the assumption of exogeneity of state passing standards with respect to individual earnings, they perform robustness checks considering selective mobility, dierential access to post-secondary training, dierences in state labor markets, selective taking of the GED, and selective eort in studying across states. Rubinstein [2003] discusses their paper, claiming that the endogeneity of studying eort would lead to upwardly-biased estimates. His model predicts that, at the margin, low-ability individuals will exert more eort than high-ability individuals when passing thresholds are higher. If these eorts have little or no eect on long-term productivity,21 bothY¯
LS,HP andY¯HS,HP
will include individuals whose true productivity is overstated, but abilities inY¯LS,HP will be overstated to a greater
degree relative toY¯LS,LP than forY¯HS,HP relative toY¯HS,LP. Greater downward bias inY¯LS,HP than inY¯HS,HP
19Tyler et al. [2000] implement this estimation in a linear regression to pool all states together and control for mean gender dierences
in earnings. See their paper for details.
20They suggest that their lack of a signicant nding for non-whites may be due to an institutional eect where both disproportionate
representation of minorities in prison and the growth of GED programs for the incarcerated lead to negative associations with the test, thus decreasing its signaling value. See Section 4 below for evidence of these demographic trends in prison-based GED receipt. The separate estimation of the GED eect by race is rare in the literature, which typically includes regression controls for race but does not treat it as a separate conditioning variable. See Section E.1 of the Web Appendix (http://jenni.uchicago.edu/GEDHandbookChapter/) for a full account of study samples, treatment of race, and separate estimates by race.
leads to upward bias in the DID estimate. He presents no direct empirical evidence on this bias. It is also possible that the higher passing standard discourages low ability persons from taking the test so that his conclusion is reversed.
Jepsen et al. [2010] show evidence of endogeneity of test taking eort in a single state with one passing standard. GED policy in Missouri permits individuals to pass the GED if their maximum scores on individual tests across retakes of the GED exam meet the passing standard.22 Figure 9 shows the distribution of scores from the rst administration of the test in its rst panel, and the distribution of maximum scores across all administrations of the GED exam that each individual opted to take in its second panel, where a clear discontinuity arises at the passing standard of 2,250. This behavior introduces several possible sources of bias in the comparisons between GED certiers and dropouts. Selective retaking will lead to low ability individuals being improperly counted in higher score groups. If changes in scores across retakes are due to unproductive cramming (as conjectured by Rubinstein, 2003) coupled with luck, this misclassication will lead to over-representation of low ability persons among GEDs producing a downward bias in comparisons of successful GED test takers with those who fail. On the other hand, if the choice to retake the test is associated with a trait of persistence that is productive in the workplace, these persons who become GEDs have high noncognitive skills that will moderate the downward bias due to their low ability. Jepsen et al. [2010] use Missouri administrative data on rst test scores and nal GED outcomes to implement a Fuzzy Regression Discontinuity (FRD) estimation of the eects of the GED.23 They nd no eects of GED receipt on earnings or employment for individuals at the margin of passing on their rst attempt, but nd a statistically signicant increase in post-secondary schooling attendance of 10%.
22Thus top scores on the various subtests across retakes of the test are aggregated.
23See Imbens and Lemieux [2008] for discussion of the FRD method. See Hahn, Todd, and Van der Klaauw [2001] for the original
Figure 9: Distribution of First Test Scores and Final Test Scores After Retakes Missouri 0.0016 0.0012 0.0014 0.0016 0.0006 0.0008 0.0010 0.0012 0.0014 0.0016 Fr equency 0.0002 0.0004 0.0006 0.0008 0.0010 0.0012 0.0014 0.0016 Fr equency 0.0000 0.0002 0.0004 0.0006 0.0008 0.0010 0.0012 0.0014 0.0016 200 700 1,200 1,700 2,200 2,700 3,200 3,700 Fr equency 0.0000 0.0002 0.0004 0.0006 0.0008 0.0010 0.0012 0.0014 0.0016 200 700 1,200 1,700 2,200 2,700 3,200 3,700 Fr equency
GED test score: First attempt
0.0000 0.0002 0.0004 0.0006 0.0008 0.0010 0.0012 0.0014 0.0016 200 700 1,200 1,700 2,200 2,700 3,200 3,700 Fr equency
GED test score: First attempt
0 0002 0.0004 0.0006 0.0008 0.0010 0.0012 0.0014 0.0016 Fr equency 0.0000 0.0002 0.0004 0.0006 0.0008 0.0010 0.0012 0.0014 0.0016 200 700 1,200 1,700 2,200 2,700 3,200 3,700 Fr equency
GED test score: Maximum score across attempts Local Linear Regression Observed
Table 7: Literature Summary - Labor Market Eects by Ability
Study Data Population Method/Identification GED Effect Findings
Murnane, Willett and Boudett (1999) NLSY79 (1979-1991) Males, includes
low-income sample Individual fixed effects
(Post-GED work experience) x (1/0 low cognitive
ability)1
Income: no effect Wage: (+, ***) if low cognitive ability
Murnane, Willett and Tyler (2000) HSB (1980-1991) Males Control for cognitive ability til OLS
(1/0 GED) x
(1/0 low cognitive Income: (+,**) Murnane, Willett and Tyler (2000) HSB (1980 1991) Males
quartile, OLS (1/0 low cognitive ability)
Income: (+, )
Tyler, Murnane and Willett (2003) HSB (1980-1991) Females
Control for highest grade completed, OLS and logit
(1/0 GED) x (1/0 low cognitive ability) Income: no effect Probability of working: (+,**) Work experience: (+,***)
Heckman, Urzua and Veramendi (2010) NLSY79 (1979-2006) White males
Dynamic discrete choice framework, latent factor analysis
(1/0 GED) x (cognitive ability, noncognitive ability)
Wage: (+)2
if high cognitive and noncognitive ability latent factor analysis noncognitive ability)
Notes: [1] "1/0" refers to a binary indicator of the associated variable. For example, under GED Mechanism "1/0 GED" refers to 1 = receives GED, 0 = does not, indicating a simple binary treatment effect.
[2] Heckman, Urzua and Veramendi (2010) is a working paper that uses simulations to identify heterogeneous treatment effects. The most recent draft has distributions of treatments but has not yet bootstrapped the relevant standard errors.
The study samples are statistically representative of the US unless otherwise indicated in the "Population" field. The "Findings" field codes no statistically signficant effect as "No Effect", and otherwise shows (<indicator of a positive or negative finding>, <level of significance>) where * = p < .10, ** = p < .05, and *** = p < .01.
See the Web Appendix (http://jenni uchicago edu/GEDHandbookChapter/) for tables with more detail on each paper's outcomes examined lists of regressors and point estimates for each See the Web Appendix (http://jenni.uchicago.edu/GEDHandbookChapter/) for tables with more detail on each paper s outcomes examined, lists of regressors, and point estimates for each regression specification.
Dropouts with Low Initial Endowments: Tyler et al. [2000] focus on a low ability margin, and argue that low ability GEDs command higher wages relative to dropouts of comparable ability than high ability GEDs command relative to their non-GED counterparts. Murnane et al. [1999], Murnane et al. [2000], and Tyler et al. [2003] suggest a human capital explanation for large eects at a low ability margin where, in order to meet a uniform passing bar, GED recipients with the lowest academic ability when leaving school must have made the largest human capital investments in order to pass. That is, individuals with low initial ability may disproportionately comprise the sizable right tail in the distribution of preparation hours discussed in Section 2.1, and may thus generate a nontrivial amount of human capital. While no data sets combine information on GED preparation times, schooling at the time of dropping out, cognitive ability, and wages, the ndings of these three papers are consistent with the hypothesis that low ability GEDs study more. As previously noted, the low ability GEDs who try repeatedly to pass and do so may have higher noncognitive traits than their low ability non-GED counterparts and this might explain their ndings. The samples and qualitative ndings of each paper are summarized in Table 7.
All of these papers nd positive returns to the GED associated with low levels of academic ability. Murnane et al. [1999] control for individual heterogeneity using a long panel of earnings data from the NLSY79 sample to control for individual xed eects. The wage returns are limited, with Murnane et al. [1999]'s analysis suggesting a statistically signicant 6% hourly wage premium ve years after GED certication. It would be instructive to compare the noncognitive skills of the low ability GEDs with those of dropouts who do not certify. To the best of our knowledge, this has not been done.
that are administered with the initial wave when participants are in 10th grade, and tests that are administered in the next wave that is sampled two years later. Controlling for completion of 10th and 11th grade and baseline test scores, GEDs make larger test score gains than do dropouts. They note that while this nding may be due to dierential returns to education or other unobserved heterogeneity, this pattern is consistent with the hypothesis that studying for the GED examination did increase the math skills of dropouts.
3.1.3 Cognitive and Noncognitive Ability
Just as cognitive ability is commonly a confounding factor in explaining the labor market returns to education, Heckman and Rubinstein [2001] demonstrate that dropping out is associated with negative social traits such as criminal behavior, divorce, risky social behaviors, and job turnover that are not controlled for in statistical studies. As a test of cognitive ability, the GED does not directly measure these negative social traits or induce sorting along the lines of positive traits. Heckman and Rubinstein introduce the idea that this association of the GED with negative social traits makes it a mixed signal.
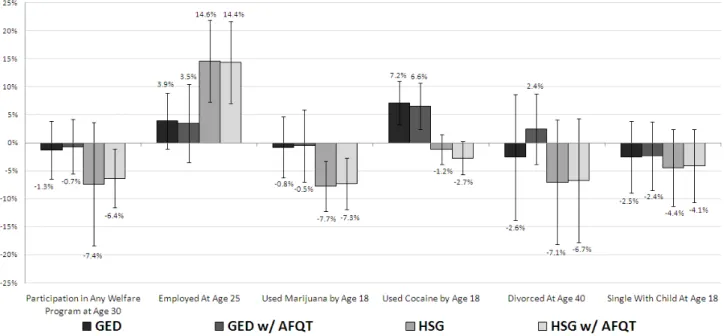
While Section 3.1.1 demonstrates that GEDs lie between dropouts and high school graduates in academic outcomes and home background, Figures 10 and 11 show that GEDs are similar to, or worse than, dropouts in terms of social outcomes.24 This suggests that underlying behavioral characteristics can explain in part why GED recipients do not receive the benet that high school graduates do from their credentials.
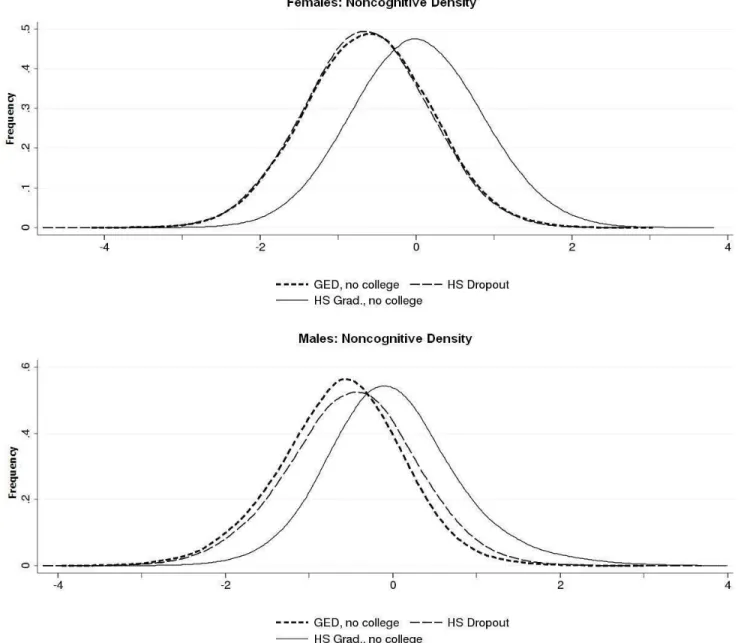
Heckman, Stixrud, and Urzua [2006] test for the inuence of cognitive and noncognitive skills on choices of schooling and the wage returns to schooling. They use the Rosenberg Self-Esteem Scale and Rotter Locus of Control25, both administered early in the NLSY79 panel to measure noncognitive skill.26 Heckman, Urzua, and Veramendi [2010] similarly account for both cognitive and noncognitive ability, but anchor noncognitive ability in crime and risky behavior choices early in life. Figure 12 plots the noncognitive ability distributions from Heckman, Urzua, and Veramendi [2010] for males and females. Terminal GEDs and uncredentialed dropouts have nearly identical distributions of noncognitive ability while high school graduates are substantially right shifted.
Table 8, reproduced from Heckman, Stixrud, and Urzua [2006], shows that both cognitive and noncognitive27skills
24These gures display dierent social outcomes due to the fact that the same measures are not surveyed in the NLSY79 and NLSY97. 25The Rosenberg Self-Esteem Scale is a series of 10 yes or no questions to evaluate self-esteem. The Rotter Locus of Control is a set
of four paired statements used to measure self-ecacy. The taker must indicate which she believes to be more true, then indicates if they believe this to be somewhat true or very true.
26See Section B of the Web Appendix (http://jenni.uchicago.edu/GEDHandbookChapter/) for detailed descriptions of each measure.
Figure 10: Gaps in the Probability of Various Social Outcomes Compared to High School Dropouts with and without controlling for scholastic ability (NLSY79). All demographic groups pooled unless otherwise noted.
Source: National Longitudinal Survey of Youth 1979 (NLSY79). Notes: This analysis is restricted to the cross-sectional sample of NLSY79 reporting no completed years of college, having never been incarcerated, and having valid AFQT scores. Single With Child at Age 18 includes only females. All regressions control for race, gender, Southern residence at age 14, and urban status at age 14. Regressions with controls for ability use pre-8th grade estimates of AFQT scores. Marginal eects reported. 95% condence intervals are displayed.
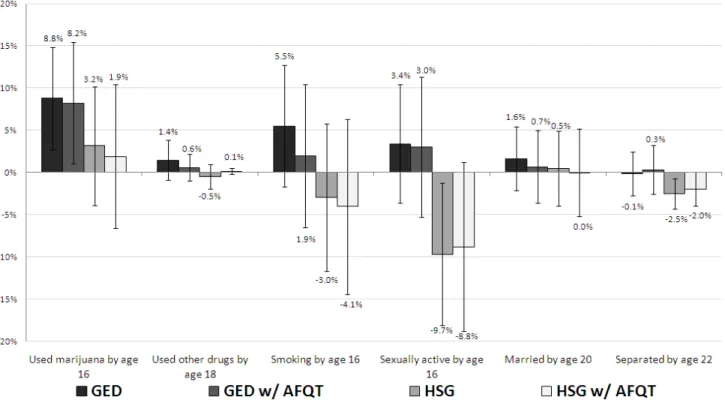
Figure 11: Gaps in the Probability of Various Social Outcomes Compared to High School Dropouts with and without controlling for scholastic ability (NLSY97). All demographic groups pooled unless otherwise noted.
Source: National Longitudinal Survey of Youth 1997. Notes: This analysis is restricted to the cross-sectional sample of NLSY97 reporting no completed years of college at age 22, having valid AFQT scores. Separated by 22 indicates that the individual is divorced or separated from one's spouse by age 22. All regressions include highest grade completed at 22, urban and rural status at age 12, and race and gender dummies. Regressions with controls for ability use pre-8th grade estimates of AFQT scores. Marginal eects reported. 95% condence intervals are displayed.
Figure 12: Noncognitive ability by educational status (no college sample, all ethnic groups)
Source: Reproduced from Heckman, Urzua, and Veramendi [2010]. National Longitudinal Study of Youth 1979. Notes: The distributions above represent noncognitive ability factors estimated using measures of early violent crime, minor crime, marijuana use, regular smoking, drinking, early sexual intercourse, and educational attainment as laid out in Hansen, Heckman, and Mullen [2004]. Sample restricted to the cross-sectional subsample for both males and females. Distributions show only those with no post-secondary educational attainment. The noncognitive ability factors are separately normalized to be mean zero standard deviation one.
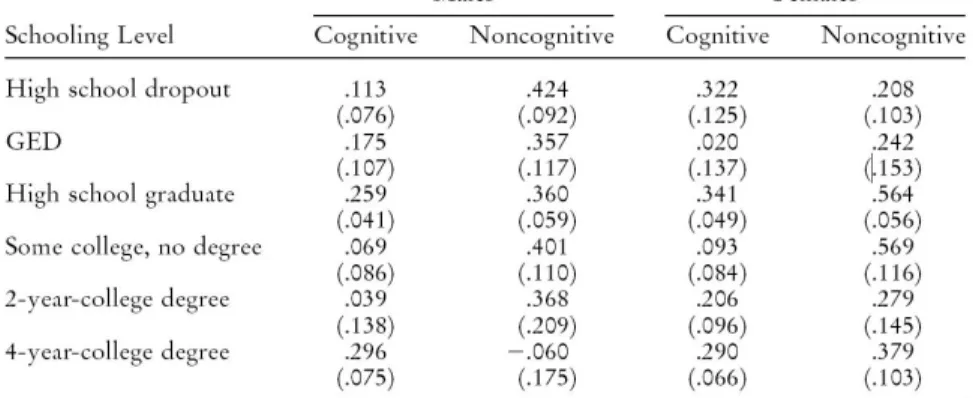
Table 8: Coecients from Log Wage Regression on Cognitive and Noncognitive Measures
Source: Reproduced from Heckman, Stixrud, and Urzua [2006], Table 4. National Longitudinal Survey of Youth 1979 (NLSY79). Notes: Sample from NLSY79 males and females at age 30. Individuals are pooled across race/ethnic groups. The analysis uses the cross-sectional subsample of NLSY79, restricted to those not currently enrolled in college. The cognitive measure represents the standardized average over the raw ASVAB scores (arithmetic reasoning, word knowledge, paragraph comprehension, math knowledge, and coding speed). The noncognitive measure is computed as a (standardized) average of the Rosenberg Self-Esteem Scale and Rotter Internal-External Locus of Control Scale. The model also includes a set of cohort dummies, local labor market conditions (unemployment rate), region of residence, and dummies for race/ethnicity dummies. Standard errors are in parentheses.
are valued in the labor market for individuals of all educational levels. The table reports the coecients for the cognitive and noncognitive measures (which are standardized to mean zero, standard deviation 1) on log hourly wages by educational attainment. While the value of cognitive and noncognitive ability varies by education status and sex, noncognitive skills are of equal or greater importance at many educational levels as measured in eects on outcomes of unit changes in standard deviations.
Heckman, Stixrud, and Urzua [2006] and Heckman, Urzua, and Veramendi [2010] study the eect of education and noncognitive skills on earnings and other outcomes. Both papers use factor models to generate estimates of cognitive and noncognitive ability from multiple measures of those traits, and both choices of education levels and earnings outcomes as functions of those skills. Both papers use a generalized Roy model to control for selection into schooling and to estimate labor market returns to educational attainment that vary by levels of cognitive and noncognitive skill. While both papers measure cognitive ability from AFQT scores, Heckman et al. [2006] measure noncognitive factors using Rosenberg and Rotter scales in conjunction with educational choices. Heckman et al. [2010] construct noncognitive factors from measures of teenage behavior, specically participation in minor and major illegal activity, smoking, drinking, drug use, involvement in after-school clubs, and sexual intercourse by the age of 15.
Figure 13: Distribution of noncognitive factor for GEDs and dropouts (white males)
Source: Reproduced from Heckman and Urzua [2010]. Notes: GED after age 21 are those that GED certify at age 22 or later. GED by age 18 are those that GED certify before the age of 19.
Figure 14: Log wage eects of GED recipient as a function of cognitive and noncognitive skills (white males)
Decile ofCognitive Abi lity Decile
of Noncog
nitive Ability
Decile ofCognitive Ability Decile ofNoncognitive Ability
Lo g w ag e co m pa re d to un ce rt i ed d ro po ut s Lo g w ag e co m pa re d to un ce rt i ed d ro po ut s Lo g w ag e co m pa re d to un ce rt i ed d ro po ut s
Tr
eat
ment
Effect
:
GED
Log
Wage
Compar
ed
t
o
Uncer
t
ied
Dr
opout
s
Source: Reproduced from Heckman et al. (2010). Notes: The top panel represents the log wage eect of GED receipt by joint distribution of cognitive and noncognitive ability. The lower panels show the log wage eect of GED receipt by marginal distributions of cognitive and noncognitive ability.
Figure 13 shows the estimated distributions of noncognitive ability for dropouts and dierent types of GED recipients fromHeckman and Urzua [2010]. Consistent with dierences displayed in Figures 10 and 11, it shows that all GEDs, except those with some college, are below uncredentialed dropouts in noncognitive ability. Figure 14, reproduced from Heckman et al. [2010], shows how the eect of GED certication on wages varies by levels of individual skill type. It shows that the marginal benet of increasing a decile of noncognitive ability for GEDs, especially in the bottom two deciles, is greater than the marginal benet of increasing a decile of cognitive ability. This analysis conrms the ndings of Heckman et al. [2006] that there are positive returns to both noncognitive and cognitive ability in low skill labor markets.
Figure 15: Returns to College and GED Test Takers Seeking Further Education
Source: GED Testing Service [1958-2008] and Current Population Survey Data.
the next section, noncognitive ability is also a key characteristic for predicting which individuals will successfully use the GED to obtain post-secondary training.
3.2 Educational Attainment
Patterns of Post-Secondary Enrollment and Persistence: As noted above, the GED is widely accepted as a prerequisite for admission to post-secondary education. Thus it serves as an intermediate step to obtaining more valuable credentials. In 2008, 60% of GED test takers self-reported further education as a reason for taking the test. Of this 60%, 20% planned on enrolling in four year college, 28% in two year college, and 22% in a technical or trade program [GED Testing Service, 1958-2008]. Figure 15 presents time trends in the motivation to use the GED for post-secondary education, showing an awareness of the increasing returns to college. As the college-high school wage gap has grown, so has the percentage of GED recipients planning further education.
Few GEDs follow through with these plans. A recent study by the GED Testing Service [Patterson et al., 2009] followed 1,000 randomly selected individuals who passed the GED test after the increase in test diculty in 2002. It found that 31% ever enrolled in a post-secondary institution of any kind, and that 77% of those who ever enrolled did so for only a single semester.