This PDF is a selection from an out-of-print volume from the National Bureau
of Economic Research
Volume Title: Behavioral Simulation Methods in Tax Policy Analysis
Volume Author/Editor: Martin Feldstein, ed.
Volume Publisher: University of Chicago Press
Volume ISBN: 0-226-24084-3
Volume URL: http://www.nber.org/books/feld83-2
Publication Date: 1983
Chapter Title: Modeling Alternative Solutions to the Long-Run Social Security
Funding Problem
Chapter Author: Michael J. Boskin, Marcy Avrin, Kenneth Cone
Chapter URL: http://www.nber.org/chapters/c7710
7
Modeling Alternative
Solutions to the
Long-Run Social Security
Funding Problem
Michael J. Boskin, Marcy Avrin, and Kenneth Cone
7.1 Introduction
Since its enactment, the Social Security System has enjoyed unique popularity among public income support programs. In the past several years, however, rising payroll taxes, a huge long-term deficit, and con- cerns over its effects on the economy have led an increasing number of observers to conclude that social security is in urgent need of reform.
This system serves two major goals: to replace income lost at retire- ment, and to provide minimum income support for the aged. The former, the insurance goal, is based on earned entitlements; the welfare, or transfer, goal aims at social adequacy of support. Each goal enjoys wide public support as well as important policy justifications. For example, imperfections in the private annuities market and imperfect foresight regarding future incomes, inflation, life expectancy, etc., may lead many citizens to “undersave” for retirement, forcing them to become general charges on the public via welfare or other programs in the absence of social security.
Over more than four decades, the Social Security System has helped mitigate these problems in an important way. It has provided substantial income security to the elderly; it has kept many elderly persons out of
Michael J. Boskin is professor of economics at Stanford University and a research associate and director of the Social Insurance Program at the National Bureau of Economic Research. Marcy Avrin is a research associate at the National Bureau of Economic Re- search. Kenneth Cone, a graduate student at Stanford University at the time this paper was written, is now assistant professor of economics at the University of Chicago.
The authors thank John Shoven and Denny Dennis for valuable advice, and John Wolfe and Joseph Applebaum for helpful suggestions. The National Science Foundation provided partial support for this research under grant SOC 78-07139. Reported here is part of the N B E R s research in social insurance. Any opinions expressed are those of the authors and not of any organizations.
212 Michael J. BoskinIMarcy AvrinIKenneth Cone
extreme poverty; and it has transferred billions of dollars annually from the younger, wealthier generation of workers to the older, poorer genera- tion of retirees. These are significant achievements indeed. However, the system, which was designed decades ago, has not kept up fully with rapidly changing economic, social, and demographic conditions. It is having several substantial and probably unintended adverse effects on the overall economy; and it faces a long-term funding crisis of substantial proportions.
Social security is thought of in several alternative ways: as an actuari- ally fair pension fund; as a separable system of taxes and transfer pay- ments; and as a pure consumption loan intergenerational transfer pro- gram, where each generation transfers a fraction of its labor income to the retired generation with the expectation that the succeeding genera- tion will treat it similarly. In truth, the existing Old Age Survivors Insurance (OASI) System is none of the above, but has components of each (as well as additional complexities).
The current system differs from the private pension fund analogue in several respects. First, it is unfunded in that current payouts are financed by contemporaneous “contributions,” or taxes. This had the advantage of allowing retirement benefits to be initiated immediately, making the initial recipients “windfall” beneficiaries. That is, they received retire- ment income supplements with little or no previous contributions. In- come was similarly transferred from the initial working population to the initial retirement generation. This intergenerational transfer has con- tinued as the system has matured, although the percentage of net trans- fers (the expected value of a participant’s receipts less payments) in total benefits has diminished. One drawback of this system is that while people accumulate future claims against the system, no corresponding wealth accumulation occurs for the system as a whole. Thus, while the working population is being forced to “save,” no funds are madeavailable for capital formation in the economy. A t any point in time, the system is “bankrupt” in that it has massive future retirement obligations and only a relatively trivial amount of assets. A government can operate such a system because of its powers to tax future income in order to finance its obligations.
There are other major differences between social security and the private annuity or pension fund analogue. The benefits are distinctly tilted in favor of the low-income worker, the worker with a short work history, and the retiree with a spouse with an uncovered work history and those with little retirement income. That is, relative to a system where each participant earned a common rate of return on his or her contribu- tions, the current Social Security System involves a set of taxes and transfers. This redistribution within a generation, in contrast to the intergenerational transfer mentioned above, is accomplished by such
213 Modeling Alternative Solutions
mechanisms as a progressive benefit formula, a minimum benefit, a uniform dependent’s benefit, and an earnings test.
7.2 The Major Problems Confronting Social Security
Three major sets of problems plague social security today. The first is the issue of equity, both inter- and intragenerational. A large proportion of benefits received by retired workers is really an intergenerational transfer. Also, different groups in a given generation of the population are treated differently by the Social Security System. Low-income work- ers receive a higher fraction of their previous earnings in benefits than do high-income workers, married couples usually receive half again as much as single persons with the same earnings history for the primary earner, those with short-covered earnings histories are favored, etc.
A second set of problems plaguing the Social Security System is the potentially adverse effects that it may have on private incentives to work, save, hire workers, etc.
Probably the most overwhelming problem confronting social security as a pay-as-you-go system is the long-term funding crisis. Even after the 1977 social security amendments, the long-term deficit in the OASI System was well over $600 billion (in 1977 dollars). By 1982 this amount had increased to well over one trillion dollars. This is the amount by which the present value of legislated benefits exceeds the present value of legislated taxes. To put this in perspective, this amount is about the size of the privately held regular national debt. The major cause of this pro- jected deficit is the drastic change in the age structure of the population. Once the post-World War I1 baby boom retires (around 2010) the ratio of retirees to workers will increase enormously. The best estimate is that the ratio of retirees to workers will increase by over 60%-from slightly less than one to three to about one to two. Given the pay-as-you-go nature of the system, this implies either a huge increase in taxes to maintain the ratio of benefits to before-tax wages or a significant decline in the ratio. Neither prospect is appealing, but there is no avoiding the choice.
In addition to the rapidly changing age structure of the population, the trend to earlier retirement combined with increased life expectancy has increased the average length of retirement considerably. In 1948 one-half of all males over the age of sixty-five were in the labor force; today that figure is only one in five. The average life expectancy of the elderly has increased over two years since 1960. Thus the length of the average retirement period has increased by about one-third since 1950. This has greatly strained the financial resources of the elderly; to achieve any given level of annual consumption, a retiree now needs substantially greater savings, intrafamily transfers, or public support.
214 Michael J. BoskinIMarcy AvrinIKenneth Cone
security? Even the large tax increases of the 1977 amendments will prove insufficient to finance the program through the first half of the next century. If the current law is maintained until 2025, payroll tax rates would have to increase by more than 8 percentage points to meet benefit payments.’ This would imply combined employer and employee tax rates of about 23% of payroll! Given the huge outcry against the large (but much smaller) increases legislated in 1977, it is clear that the time has come to reexamine the future course of social security. The alternative is continued unpopular tax increases, which add to costs and prices, reduce net wage rates, redirect the system further from an earned entitlements or annuity basis, and continually erode public support of the Social Security System.
While several short-run “quick fixes” have been proposed, such as bringing into the system those, such as government employees, not currently included, or eliminating the ceiling on taxable earnings, these cannot produce a reduction in the long-term deficit unless they are accomplished in a manner that is actuarially disadvantageous to the groups concerned.2 For example, bringing government employees under social security would increase current tax revenues but add to future obligations. This could reduce the deficit only if government employees were given a “bad” deal. But we could then expect them to resist such a proposal en masse.
7.3
In order to appreciate the relation between the annuity and the in- tergenerational transfer components of social security, let us begin by examining the most extreme case: the first cohort of retirees under the United States Social Security System. Consider an individual who was age sixty-two in 1937 and retired in 1940 at age sixty-five.
For a worker making average earnings and investing the sum of em- ployer and employee contributions at interest rates then prevailing, the accumulated retirement principal in 1940 would have been only $68.36, yielding an annuity of $6.59 per year. Clearly, benefits far in excess of contributions would be required if any substantial benefits were to be paid.
The actual average annual benefit paid in 1940 to a male age sixty-five was $270.60. Since an annuity would have yielded only $6.59, $264.01 of the benefits were a pure transfer, or welfare payment.’ Since the benefits
The Transfer and Annuity Components of Social Security
1. See Robertson (1978). The 8 percentage point increase includes that estimated to 2. They might be defensible on other grounds.
3. This example is taken from Parsons and Munro (1977). fund the deficits in hospital and disability insurance as well as OASI.
215 Modeling Alternative Solutions
may and, in fact, did change over the retirement period, it is more convenient to compare capitalized savings and benefits over the expected time span than to compare annuity payments and annual benefits. For the individual in question, the present value of lifetime benefits was $2,962.09, of which $2,893.73 was a transfer. Thus this individual paid for only 2.3% of the benefits received. This percentage has been increasing for individuals over time. Those retiring at age sixty-five in 1970 paid for approximately 32% of the benefits received.
Different indivduals receive vastly different “deals” in the sense of the ratio of benefits received to taxes paid plus interest. This occurs for a number of reasons including the progressive benefit formula, the mini- mum benefit, the spouse’s benefit, the different periods of coverage, etc.
7.4 Separating the Transfer and Insurance Components
Many problems in the Social Security System relate to the conflict between its twin goals of earned benefits and income adequacy. Most critics of the program propose reforming it in the direction of one goal or the other. Separating the transfer and annuity goals would have different effects on individuals depending on their age, income, industry, etc.
The three sets of problems plaguing social security-the long-term funding deficit, the apparent inequities, and the adverse incentives- have generated much interest in reforming the system. One proposed reform is the separation of the transfer and annuity goals of the program. In principle, it may be desirable to separate the financing of these differ- ent goals of the system. Separating the transfer and annuity functions of the Social Security System and funding them respectively out of general revenues and earmarked payroll taxes has been recommended for a number of reasons.
First, the current system is so complex as to obscure the relation between contributions and benefits and impede a rationalization by firms and employees of total retirement support, private pension plus social security.
Second, as we shall demonstrate below, many groups in the population are getting a “bad” deal from social security compared to an actuarily fair system. Separating the transfer and annuity goals would provide the same rate of return for all workers under social security’s annuity program. The inequities which undermine support of the system would be eliminated in this part of the program.
Third, transfers to the elderly poor (beyond Supplemental Security Income) could be financed from general revenues. Many object to financ- ing an income guarantee for the aged poor from a tax which bears so heavily on the low-income workers. The current income tax exemptions,
216 Michael J. BoskinIMarcy Avrin/Kenneth Cone
deductions, and low-income allowance, which together exempt the first several thousand dollars of earnings from tax, indicate the general belief that those at the very bottom of the income scale should not have to help finance general income support programs.
The same argument applies to any intergenerational transfers provid- ing earnings-related benefits beyond those provided by pure insurance and the minimum income guarantee. Many object to a system in which current unskilled workers surrender income (beyond their own insur- ance) to subsidize retired professionals beyond what is actuarially fair.
In separating the insurance from the transfer goals, general revenue financing would also require the transfer goals to compete openly with other government priorities, including tax cuts. General revenue financ- ing would permit policymakers and the public openly to determine the value of transfers to the elderly in relation to other social priorities and to promote cost-effective measures for doing so. It will permit differential needs assessment to deal with different circumstances (marital status, etc.) in the context of a transfer program, where many precedents for doing so already exist.
7.5 Toward a Solution
As we begin to grapple with the problems of the Social Security System, from the apparent inequities and inefficiencies to the long-term deficit, serious consideration is being given to two major reforms: sepa- rating the dual functions of social security and financing them separately, and raising average retirement ages. Separating the transfer component of the system (and funding it out of general revenues) would encourage more cost-effective transfers and enable us to strengthen the earned entitlement functions, which, in turn, would eliminate many inequities and help restore public confidence in the financial integrity of the system. Raising retirement ages would relieve much of the financial pressure on social security and make much sense in view of other labor force and demographic changes.
In what follows we have analyzed a series of long-run policy alterna- tives along these lines and have calculated the projected costs and bene- fits of each for workers of different ages. The age cohorts, cohorts 1 through 5 , are ages twenty-five through thirty-four, thirty-five through forty-four, forty-five through fifty-four, fifty-five through sixty-four, and sixty-five and older, respectively. Those who are not yet twenty-five constitute cohort
X.
We have also calculated the implications of these alternatives with regard to the social security surplus or deficit to the year 2050. Basically, for each alternative, we ask two questions. First, what is the ratio of the present value of benefits an age cohort can expect to receive at age sixty-five to the accumulated value of its lifetime contribu-217 Modeling Alternative Solutions
tions to social security? Second, what is the present value of the resulting social security retirement deficit through 2050?
We have investigated these questions in terms of the following alterna- tive plans: 1. 2. 3.
4.
5 . 6.The Base Case analyzes the Social Security System as it stands today.4
The Trans alternative reduces benefits to eliminate transfers for cohorts 2-5.
The Trans 80 alternative eliminates transfers and adjusts taxes in 1980 to close the future deficit as of 1980. (Taxes were actually lowered by 1.5% of income.)
The Tax 80 alternative raises taxes by 1.7% of income beginning in 1980 to close the future deficit as of that year.
The Tax 2030 alternative raises taxes by 3.9% of income beginning in 2030 to close the future deficit as of that year.
The Ret alternative increases retirement ages an average of three years.
Thus these alternatives allow us to determine the effects of decreasing benefits by eliminating transfers, increasing taxes, and increasing the retirement age.
In all of these alternatives we consider only the old age insurance portion of the Social Security System. Thus we exclude taxes and benefits paid for disability, health, and part of survivor insurance. (The model does include the increased benefits paid to wives when their husbands die.) We will refer to the retirement insurance system as OASI, to distinguish it from OASDHI, which includes health and disability insur- ance.
In order to understand the basis of these calculations, it is important to consider the data on which they are based, the method of analysis used, and the assumptions upon which they rely.
7.5.1 Data
The data used in the calculations are the 1975 Social Security Exact Match File that merges individual records from the 1973 Current Popula- tion Survey (CPS) with OASI earnings and benefit records. With these data, the pattern of actual OASI benefits, as well as lifetime contributions into the system by all individuals, can be found. These data permit redistribution across cohorts to be separated from the annuity aspects and enable us to estimate values for individual households. Since the data used include only a sample of 5,000 individuals in each cohort, sample
218 Michael J. BoskinIMarcy AvrinIKenneth Cone
weights and populations statistics are used to generalize the sample results to the entire population. The weights are present in the file.
The data actually used in the analysis from the social security longitu- dinal earnings tape include the sum of covered earnings from 1937 to 1950, covered earnings from 1951 to 1975, estimated quarters of coverage from 1937 to 1950, and actual quarters of coverage from 1951 to 1975. From the 1973 CPS, the following data were used: region, farm resi- dence, age, sex, race, marital status, class of worker, occupation, indus- try, weeks worked in 1972 as a civilian, industry of longest civilian job in 1972, years of school completed, and wage and salary amount. 7.5.2 Method of Analysis
For cohorts 1-5 we determine the relation between the summation of aggregate contributions and the expected aggregate benefits of all indi- viduals currently in the Social Security System, assuming in all cases but Ret that the retirement age is sixty-five for husbands and singles and that wives retire with their husband^.^ For an individual, the value of total contributions into the system at the point of retirement is the summation of actual and expected OASI taxes paid both by himself and by his employer compounded by a real rate of interest (3% in the base case). These calculations use actual and forecasted income, historical and fore- casted maximum taxable income limits, and historical and forecasted tax rates.
The expected value of OASI benefits over the worker’s remaining life is calculated considering the probability of survival and the wage index from Social Security Bulletin, Annual Statistical Supplement, 1975.6 Wives receive benefits based on their own or their husbands’ benefits, whichever is larger. The entire analysis is converted to 1977 dollars.’
In order to determine the expected contributions for individuals who 5. A fraction of each cohort, those in noncovered industries or with insufficient quarters of coverage, are considered to be ineligible for benefits. Wives who do not qualify on their own or on their husbands’ behalf receive no benefits. The retirement pattern can also be simulated by a retirement behavior equation, but these initial estimates are used to compare them with typical Social Security Administration assumptions.
6. The year of death for each individual in cohorts 1-5 was predicted using a random number generator and his or her probability of death at each age, conditional on race and sex. Individuals predicted to have died before reaching the age of sixty-five are excluded from the analysis of average net benefits, although their taxes are included in the general financing calculations. For cohort X, we used “average” men and women for each year-of- birth cohort, and reduced taxes and benefits in each year to account for the cumulative probability of death. We used an average life expectancy assumption to find the number of years that a wife in cohort Xwill collect widow’s benefits. This assumption potentially adds a small bias in our calculations. Year-of-death predictions used The U. S. Fact Book (1978) for all ages less than sixty-five and ages sixty-five, seventy, and eighty. For ages not given, year of death was predicted interpolating from the 1969-71 death rates in National Center for Health Statistics (1975).
7. Benefits are increased by 17% for cohort 5 to adjust for the disproportionate number of widows, whose social security entitlements are not captured by the data.
219 Modeling Alternative Solutions
have not yet reached the age of sixty-five, we applied the contribution rates specified in the 1977 amendments to the Social Security Act to known earnings and predicted future earnings for each individual. Earn- ings were predicted separately for males and females using an estimating equation based on positive 1972 earnings of all individuals in the sample. The predictions, determined from the estimated coefficients of the inde- pendent variables in the equation and the characteristics of the indi- viduals, were indexed over time using 7% for inflationary earnings in- creases and the assumption of a 1.5% per year earnings increase due to productivity for the Base Case.* Female income is adjusted for labor force participation.
More formally, we “age” our survey data so that we know both the past work history and the projected future work history and retirement bene- fits for the sample population. Having done this we calculate the present value of each household’s total contribution at retirement (PVC;). These are calculated as 1 R I = 1 PVCR=
c
cf
(1+
r ) R + ’where R is a given retirement age and r is the interest rate “credited” to a social security “account” under our pension plan analogue.’” In fact, all projected contributions and benefits are calculated so that they are the anticipated dollar amount times the probability of the individual surviv- ing to that time.
We calculate the expected retirement benefits at age of retirement ( P V B k ) as
1 N
P V B k =
2
Bit = R (1
+
r ) R - ’where N is 100, beyond which the survival probability is taken to be zero. Given that survival probabilities are already embedded in B, and Ct, an actuarially fair system would be one where PVCk = PVBk. We define 8. The actual dependent variable used was the log of earnings. The independent vari- ables include dummy variables for a southern location, rural location, race, the fact of being married, white collar status, service collar status, blue collar status, employment in an industry, self-employment, weeks worked, and level of education.
9. Female labor force participation was assumed to keep the same age distribution as in 1975, but to slowly increase for each age group until 2005. The rate increases 12.5 percent- age points for each age group by 2005. (This is based on assumptions of the 1977Annual Reporr of the Trustees of rhe Social Security System.) Again, this is for comparison only. Future estimates will incorporate a separate female labor force participation equation.
10. We make the usual assumption that the employer component is borne by employees, and hence include the employer part of the payroll tax in estimating total contributions on behalf of a worker. Alternative incidence assumptions could be used, and the data adjusted accordingly. The result, of course, would be to “credit” less tax payment and to increase the size of transfers, as the share of employer contributions assumed paid by someone other than employees increases.
220 Michael J. BoskinlMarcy AvrinJKenneth Cone
the expected present value of any transfer received by the participant as The same type of analysis is performed for cohort
X,
which involves making several assumptions regarding the future.''
After performing the analysis of taxes and benefits by cohort for various scenarios, we sum the results in order to determine the budget surplus or deficit that results from each scenario.
T k = PVBk - P V C k .
7.6 An Overall Comparison of Alternative Social Security Situations
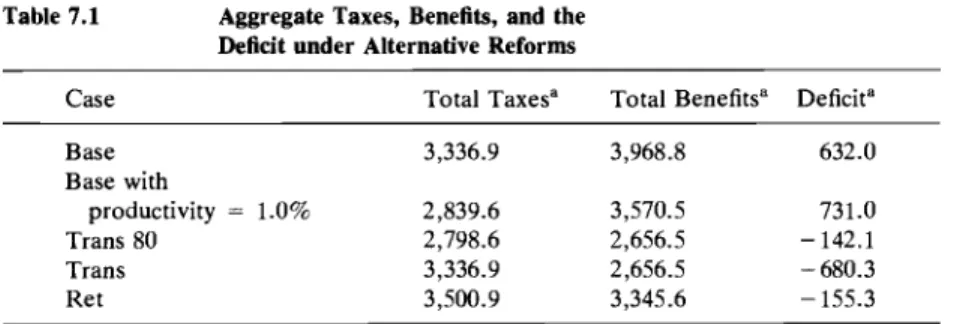
Let us begin by examining some general measures of the overall situation for the OASI system under alternative scenarios. In particular, we consider aggregate taxes, benefits, and the deficit under alternative social security situations and, correspondingly, the total transfers and transfers as a percentage of income for alternative social security situa- tions. The situations to be discussed include the Base Case, i.e. current law, including currently legislated but not yet implemented tax increases; the Base Case with a slightly lower rate of productivity growth; two situations in which the transfer component is eliminated and dealt with separately under general revenues, Trans 80 and Trans; and Ret, which increases the retirement age by three years. Table 7.1 presents estimates of the aggregate taxes, benefits, and resulting present value of the long- term deficit under these alternative scenarios. Recall that we are making very conservative assumptions with respect to the projected long-term deficit in considering the Base Case in order to try to maintain compara- bility, roughly speaking, with the assumptions made by the trustees of the Social Security System.
The Base Case is estimated assuming an annual rate of productivity growth of 1.5% per year and an annual inflation rate of 7% per year, and the total taxes and benefit are discounted at a real rate of 3% with all figures being presented in 1977 dollars. Thus, for the Base Case, we note that the total taxes amount to approximately $3.3 trillion whereas total 11. The assumptions are as follows: (1) In terms of cohort size, actual population statistics are used for individuals born from 1953 to 1977. Estimates of size for 1978 to 2050 were made assuming that birthrates would decline from 1.7 to 1.65 in 1980 and then slowly increase to 2.1 in 2005. (2) Female labor force participation is assumed to keep the same age profile as in 1975 but to slowly increase for each age group until 2005. The rate increases 12.5 percentage points for each group by 2005. (3) Coverage by the Social Security System is assumed constant at 90%. (4) The percentage of women married is assumed constant at 93% on the basis of data from the Statistical Abstract. (5) Unemployment is assumed constant at 5%. (6) The mortality rates for each age group are assumed to remain constant. (7) Each couple is assumed to retire together at age sixty-five. (8) The wage is adjusted to account for the fact that all income used in the estimates is below the taxable limit since the wage equation and the Social Security Match Tape data are used. The adjustment is based on taxable/total ratio in 1977.
These assumptions are based on those of the 1977Annual Report of the Trustees of the Social Security Administration.
221 Modeling Alternative Solutions
Table 7.1 Aggregate Taxes, Benefits, and the kficit under Alternative Reforms
Case Total Taxes" Total Benefits" Deficit"
Base 3,336.9 3,968.8 632.0 Base with productivity = 1.0% 2,839.6 3,570.5 731.0 Trans 80 2,798.6 2,656.5 - 142.1 Trans 3,336.9 2,656.5 -680.3 Ret 3,500.9 3,345.6 - 155.3
"All figures are in billions of discounted 1977 dollars.
benefits amount to about $4 trillion. Again, recall that these figures are adjusted for inflation and discounted to 1977. With these assumptions, the estimated long-term deficit amounts to $632 billion. Recall that this does not include the hospital and disability insurance programs, in which case taxes, benefits, and the deficit would all be substantially larger. This enormous deficit occurs primarily because of the changing age structure of the population, as noted above. When the baby boom generation starts to retire, we face the awkward prospect of an extremely large and rapid increase in the ratio of retirees to workers in our society. Even if the actuarial assumptions of the social security trustees are accurate-and we believe they are optimistic-we will have to raise social security taxes or lower social security benefits, or raise other tax revenues, or some com- bination of these options, by an enormous amount in the years ahead. This combination would have to amount to $632 billion (discounted dollars) in 1977; if we wait for the baby boom generation to retire around the year 2030, the combination necessary will be between $2.5 and $3
trillion in 1977 dollars.
The estimated taxes, benefits, and deficit for the Base Case are very sensitive to the assumptions incorporated in making projections over the long term. Because of the importance of compounding even small differ- ences in growth rates, even so small a difference as one-half of 1 % in the rate of productivity growth increases the long-term deficit-holding other assumptions constant-by almost $100 billion in present value terms. Table 7.1 demonstrates that, when the productivity growth assumption is lowered from 1.5% to 1 % per annum, the Base Case results in a de- creased tax revenue, again in present value discounted dollars of almost $500 billion to $2.8 trillion, and a reduction in total benefits by about $400
billion from slightly under $4 trillion to slightly under $3.6 trillion. The recent behavior of productivity does not give us much cause for optimism for restoring a rapid rate of economic growth in our economy and does not augur well
for
the long-term deficit of social security.222 Michael J. BoskinIMarcy AvrinIKenneth Cone
taxes, benefits, and the deficit concerns the length of retirement. As noted above, early forecasts drastically underestimated how rapidly life expectancies would increase. In the 1960s and 1970s, the life expectancy increased about three years for women and one and one-half years for men. Simultaneously, there has been a rapid acceleration in the numbers of pepple taking early retirement. In 1948, one-half of males over age sixty-five were in the labor force; in 1980, only one-fifth of males over sixty-five are working. If life expectancy rises still further, the long-term deficit in social security will increase drastically. As a rough approxima- tion, increasing life expectancy and eligibility for social security benefits by an extra year would add about $250 billion to the long-term deficit. In view of the increased length of retirement periods (because of increased life expectancy and earlier retirement) and in view of the higher fraction of the population attending college and hence which is entering the labor force later and is shifting out of physically demanding and dangerous jobs, one major avenue of reform of social security would be to raise the age at which people could collect social security benefits. We simulated one such scenario: raising the retirement age from sixty-five to sixty- eight, or, more precisely, adding a maximum of three years to work-lives (which is obviously relevant only to those who survive to those ages). Under the assumptions of the Base Case for productivity growth, infla- tion, etc., such a move would result in a very modest increase in taxes from the additional years of work (about $170 billion) but would result in a $620 billion benefit decrease. Note that this would be accomplished without decreasing the annual benefit received by any worker once retired. The reduction in total benefits in discounted 1977 dollars would come about solely because people would be retiring later and hence would be collecting benefits for a shorter period of time. Such a reduction would more than offset the impending enormous social security deficit and the impending enormous tax increases that would be necessary under the current system above and beyond those already voted. Indeed, such a program in conjunction with the other assumptions noted above would leave social security with a surplus of over $150 billion. An alternative scenario, raising the retirement age less rapidly and not quite as high, could still put the Social Security System into long-term balance. This scenario highlights the extreme importance of the length of the retire- ment period for the total benefits paid out and the long-term deficit of the system.
The long-term benefit payouts and tax collections, especially the former, are also extremely sensitive to the enormous percentage of transfer payments involved in social security benefits, especially for older current workers and retirees. Two other scenarios were simulated to analyze the removal of positive transfer payments: Trans and Trans 80. The Trans alternative removes the transfer component of benefits com-
223 Modeling Alternative Solutions
pletely for cohorts 2-5. The negative transfers for cohorts 1 and X are maintained. The transfers are assumed to be shifted to general revenues in a manner to be decided once a genuine earned entitlement system is set up. We must note, however, that setting up a transfer payment system for the elderly to be funded out of general revenues may involve either increases in general revenue taxes or decreases in other projected govern- ment expenditures as well as the sharp reductions in payroll taxes and projected future payroll tax increases we are about to describe. Also, part of the reduced payroll tax revenue (about 20%) would be recouped automatically by increased taxes once the employer component of social security used to finance these transfers was no longer deductible from taxable income for other taxes. Under Trans, taxes will not go down at all, but total benefits will go down about one-third, from slightly under $4 trillion to about $2.7 trillion. This totally reverses the deficit picture from a two-thirds of a trillion dollar deficit to a two-thirds of a trillion dollar surplus discounted to 1977. Besides totally eliminating the need for future tax increases, the two-thirds of a trillion dollar surplus obviously could result in further deductions in social security taxes from present levels. It could also be used to finance transfer payments if we shifted total trans- fers into general revenue.
The Trans 80 alternative substantially reduces taxes as well as total benefits. Indeed, the total benefits would be treated exactly as under Trans. The difference is that tax revenues would be reduced substantially from 1980 on, leaving social security itself with a very modest surplus of $140 billion.
This overall version of the total situation with respect to taxes, benefits, and the long-term deficit highlights not only the current extreme long- term deficit of the Social Security System as presently constituted, and the large tax increases above and beyond the 1977 legislated ones im- pending in view of the long-term deficit, but also the opportunities and possibilities for deriving a solution by separating the benefits paid to achieve the twin goals of social security: earned entitlement and income adequacy during retirement. It also highlights the extreme sensitivity of the long-term deficit, benefit payments, and tax receipts to such things as slower productivity growth and changes in the length of the retirement period. We might conclude this brief discussion by noting that the long- term future of social security is not something to be left to the long term to deal with. Every year we postpone dealing with the problem gives us one less year to generate a smooth transition to a more rational and cost- effective system of providing adequate income support for our elderly population.
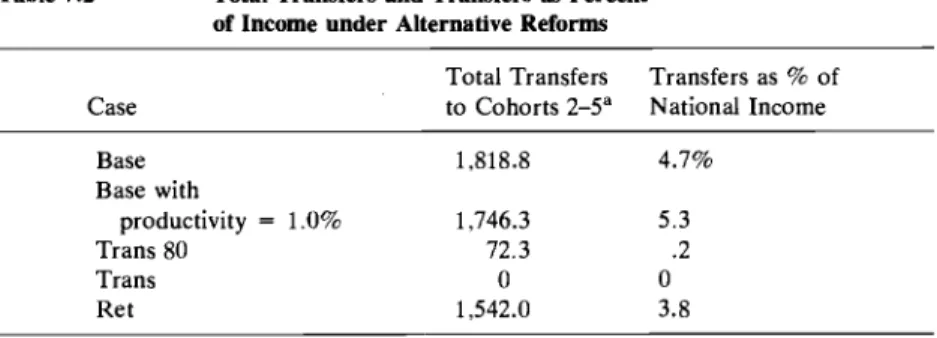
To analyze the transfer component involved in social security at the aggregate level in a little more detail, we present in table 7.2 estimates of the total transfers and transfers as a percentage of total national income,
224 Michael J. BoskinIMarcy AvrinIKenneth Cone
Table 7.2 Total Transfers and Transfers as Percent of Income under Alternative Reforms
Case
Total Transfers
to Cohorts 2-5" National Income Transfers as % of Base 1,818.8 4.7% Base with productivity = 1.0% 1,746.3 5 . 3 Trans 80 72.3 .2 Trans 0 0 Ret 1,542.0 3.8
"All figures are in billions of discounted 1977 dollars.
under the same scenarios discussed above in conjunction with table 7.1. We estimate here that the total transfers to cohorts 2-5. For the Base Case under the standard (if optimistic) assumptions, total transfers to cohorts 2-5 would be $1.8 trillion and amount to slightly under 5% of total national income! Placed in perspective, this is only slightly less than the share of income being devoted to defense expenditures. Some of the transfers to cohort 5 have been paid; the estimated remaining transfers amount to $1.3 trillion.I2 Under the standard assumptions of the Base Case with our slightly lower rate of productivity growth, transfers decline slightly to $1.75 trillion but increase the percentage of the now smaller income (arising from the lower productivity growth) to slightly over 5%. Obviously, under the Trans alternative total transfers have been elimi- nated completely and hence are zero in both the total and as a percentage of income; the Trans 80 alternative allows transfers to be paid for several additional years before taxes are adjusted (remember we start from a base year of 1977, since that is when our data end), and transfers would be virtually abolished in this case. Finally, we note that the increase in the retirement age for all cohorts after cohort 5 would substantially reduce transfer payments by about $275 billion to cohorts 2-5 and reduce trans- fers as a percentage of national income by approximately 1 percentage point. These enormous amounts for total transfers to cohorts 2-5 reveal that fundamental changes in social security toward separating the transfer and annuity goals of the program would allow major changes in the social security tax structure.
7.7 Detailed Results for the Base Case
In order to present disaggregated figures concerning the benefits re- ceived, taxes paid, and transfers received by the average family of differ- 12. John Wolfe and Joseph Applebaum kindly pointed out our failure to separate out transfers already paid to retirees (from those remaining to be paid) in the earlier versions of this paper.
225 Modeling Alternative Solutions
ent age and income, we will focus on the Base Case assumptions. Recall from the discussion above, however, that these assumptions may be somewhat optimistic and that slower productivity growth or increased retirement periods would add substantially to the taxes necessary to finance “promised” benefits. The Base Case simply ignores the long-term deficit and assumes that, despite the enormous long-term deficit, current workers will not be forced to pay any tax increases above and beyond those already legislated. Were part of the solution to the long-term deficit to gradually raise taxes above and beyond those increases already legis- lated, as discussed in the next section, current workers would have to bear substantially more of the burden than under the Base Case; indeed, younger workers would lose substantially with respect to social security. Under the Base Case, assuming that taxes would not be raised until the baby boom generation retires or later, almost all current workers come out fairly well in terms of their average net benefits above and beyond taxes paid plus interest, but workers under the age of twenty-five will ultimately be forced to finance such benefits.
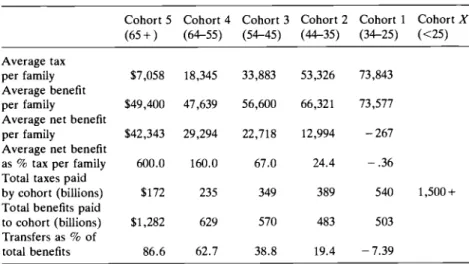
Table 7 . 3 analyzes the Base Case for six different age cohorts: for current retirees (for simplicity, persons over sixty-five); for ten-year age groups (twenty-five through thirty-four, thirty-five through forty-four, forty-five through fifty-four, and fifty-five through sixty-four); and for cohort X , persons under the age of twenty-five. (Family age is defined as the age of the husband.) The situation of a family of each age category is depicted in terms of the average tax paid per family, the average benefit received per family (the difference between benefits and taxes), and the Table 7.3 Base Case
Cohort 5 Cohort 4 Cohort 3 Cohort 2 Cohort 1 Cohort X (65+) (64-55) (54-45) (44-35) (34-25) (<25) Average tax
per family $7,058 18,345 33,883 53,326 73,843 Average benefit
per family $49,400 47,639 56,600 66,321 73,577 Average net benefit
per family $42,343 29,294 22,718 12,994 -267 Average net benefit
as % tax per family 600.0 160.0 67.0 24.4 -.36 Total taxes paid
by cohort (billions) $172 235 349 389 540 1,500+ Total benefits paid
to cohort (billions) $1,282 629 570 483 503 Transfers as % of
total benefits 86.6 62.7 38.8 19.4 -7.39
Notes: Assumes 7% inflation, 1.5% productivity growth, 3% discount. For eligible survi- vors only. Ages of cohorts are given as of 1977.
226 Michael J. BoskinIMarcy AvrinIKenneth Cone
average net benefit as a percentage of the taxes the family paid. Also tabulated are the total taxes paid by the cohort and the total benefits paid to the cohort when they ultimately retire under current estimates, as well as the transfers as a percentage of total benefits received by the cohort when they ultimately retire.
There are a variety of important points illustrated by the Base Case. First, the average tax per family, adjusted for inflation and discounted to the husband’s year of retirement, will increase markedly as time goes by and hence is much higher for younger workers than older workers or current retirees. This occurs for a number of reasons: some of the retirees will not have paid taxes through their entire lives; the tax rates actually paid and taxable ceiling used for each year have been growing through time and hence the annual taxes paid have been growing through time and will continue under current law. The average tax paid in 1977 dollars adjusted for inflation will be 10 times as high for twenty-five through thirty-four year olds as for people currently retired.
Benefit payments increase much less rapidly through time; hence, as we get to younger ages, net transfers become negative. Current retirees and persons soon to retire will receive benefits based not so much on what they paid in taxes but on an estimate of what the current tax revenue will support. Since current tax revenues are levied at a higher rate and on a larger income base than were taxes collected from the current retirees and those soon to be retired, their benefits are obviously much higher than the taxes paid plus interest. Therefore twenty-five through thirty- four year olds will receive only about one-half again as much in the real 1977 value of benefits once they retire as do current beneficiaries (those sixty-five and older). Again, recall the Base Case ignores possible changes in life expectancies or retirement patterns. Differencing the benefits and taxes reveals the very large net benefits, or transfers, re- ceived by current retirees and those about to retire. The average current retiree receives about $42,000 as a net transfer from the taxes paid to the Social Security System by current workers. This amounts to 6 times what these people on average paid plus interest. An average family in the next cohort, the fifty-five through sixty-four year olds, will receive back as a transfer payment 1.6 times what they paid in plus interest, a total of slightly over $30,000. The average net benefit, or transfer, declines for progressively younger ages both in absolute amounts and still more rapidly as a percentage of tax paid per family, since the latter will rise rapidly. By the time we get to younger workers (ages twenty-five through thirty-four), they are actually losing in terms of the taxes paid plus interest being less than the average benefits they can expect to receive. Persons under the age of twenty-five will suffer a loss under the current calculation. Because of the untenable state of the long-run deficit, the current calculation is unrealistic for this young cohort and their actual loss will probably be much larger. The total taxes paid and benefits received
227 Modeling Alternative Solutions
by each cohort follow the obvious pattern: taxes rise substantially as we pass through time. Again, these tax amounts d o not include any increases that must be voted if we are to close the long-run deficit by increasing taxes rather than decreasing benefits or by adopting one of the structural reforms suggested below. Transfers as a percentage of total benefits follow a pattern similar to those for the average family. The overwhelm- ing bulk of benefits are transfers for current retirees; for the next cohort about 60% will be transfers; for the forty-five through fifty-four age cohort slightly under 40% will be transfers; transfers will eventually vanish and become negative as we reach the younger cohorts. Obviously, for ages under twenty-five there will be a large negative transfer. Also, the transfers as a percentage of total benefits will decrease for all age cohorts not currently retired if we start to raise taxes now in anticipation of closing the deficit. The time pattern of such tax increases will be reflected in differential rates of reduction of the transfers as a percentage of total benefits for the different age groups. In the extreme, if we wait until the baby boom generation retires, transfers as a percentage of total benefits will be an extremely large negative number for those currently under the age of twenty-five.
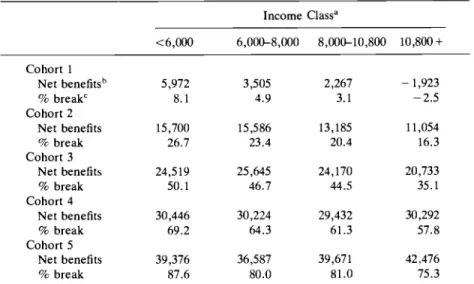
Table 7.4 takes a deeper look at the net transfers from social security Table 7.4 Net Transfers by Income Class
Income Class” <6,000 6,000-8,000 8,000-10,800 10,8OO -t Cohort 1 Net benefitsb 70 break‘ Net benefits 70 break Net benefits % break Net benefits % break Net benefits % break Cohort 2 Cohort 3 Cohort 4 Cohort 5 5,972 8.1 15,700 26.7 24,519 50.1 30,446 69.2 39,376 87.6 3,505 4.9 15,586 23.4 25,645 46.7 30,224 64.3 36,587 80.0 2,267 3.1 13,185 20.4 24,170 44.5 29,432 61.3 39,671 81.0 - 1,923 -2.5 11,054 16.3 20,733 35.1 30,292 57.8 42,476 75.3 Note: Base Case with inflation = 770, productivity = 1.5%, discount rate = 3% net of inflation.
bNet benefits = benefits for average family in income class, where both survive to retire- ment, in 1977 dollars, discounted to year of retirement, less taxes paid computed analo- ‘% break = net benefits t benefits paid.
1977 dollars, for head of household only.
228 Michael J. BoskidMarcy AvridKenneth Cone
received by individuals in the different cohorts. We examine net benefits received and the percentage break (net benefits divided by total benefits) for four different income classes. For each cohort, we note that the percentage break declines rapidly as income increases. For example, for the cohort twenty-five through thirty-four years old the percentage break goes from slightly over 8% for families with incomes under $6,000 to - 2.5% for families with incomes above $10,800. Again, for cohort 5 , the current retirees, the percentage break declines from 87.6% to 75.3% as we move up the income scale. This particular feature of the relation between the percentage break and income reflects primarily the progres- sivity of the benefit payment formula, which is tilted heavily toward replacing a larger fraction of preretirement income for low-income work- ers than for higher-income workers. Of course, the total net benefits may be slightly larger for some cohorts for higher-income people, reflecting the interaction of the larger intergenerational transfer and the larger tax payment which higher-income individuals make.
Finally, in examining the Base Case, we take a look at one other type of transfer as a percentage of benefits paid: disaggregating by industry of employment (table 7.5). Transfers as a percentage of benefits paid vary substantially across industries for a number of reasons: the different average income earned by workers of different industries, the slightly different tax treatment in effective payroll tax rates because of differen- tial proportions of workers above and below the taxable ceiling, etc. It is important to note that once again the substantial net transfer to current retirees and expected net transfers to the oldest cohorts of workers will turn negative for the youngest cohorts. These negative transfers will
Table 7.5 Transfers as Percent of Benefits Paid for Selected Industries by Cohort
Cohort Industry 1 2 3 4 5 Agriculture Mining Construction Manufacturing Transportation/ communication Wholesale Retail Service Banking, insurance, real estate -1.1 - 42.1 - 37.9 -27.3 -24.1 -31.7 - 9.2 3.8 - 19.4 14.9 - 10.1 - 18.5 -6.3 - 16.4 -4.2 14.7 21.4 9.3 40.9 5.1 11.3 17.3 24.4 17.6 41.4 41 .5 28.7 57.7 39.5 43.8 46.8 48.5 38.1 58.4 62.8 51.3 80.0 NA 70.2 64.5 69.0 69.4 82.5 83.5 79.3 Note: Estimates are for average individual in each industry
229 Modeling Alternative Solutions
occur even without considering the large tax increases necessary to finance the impending long-run deficit.
With these insights into the current social security situation in mind, we turn to a brief discussion of the alternative scenarios mentioned above.
7.8 Disaggregated Estimates for Alternative Reform Possibilities
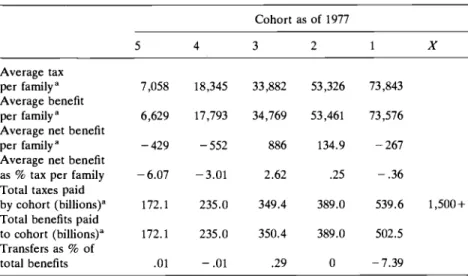
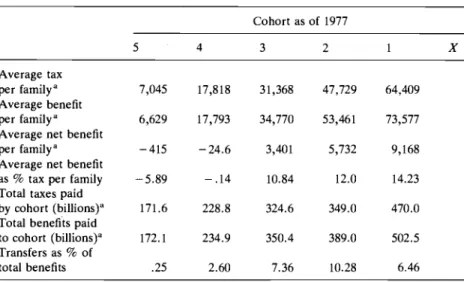
We have calculated, for a series of potential benefit and tax reforms, disaggregated estimates of average taxes per family, average benefits per family, average net benefits per family, average net benefits as a percent- age of taxes per family, total taxes paid and benefits received by each cohort, and transfers as a percentage of total benefits for each cohort. The first alternative considered is that labeled “Trans” (see table 7.6). Recall that this eliminates all transfers to cohorts 2-5 and sets up a situation where transfers would be treated separately under general revenues if so desired. In this scenario, we note the familiar pattern of the average taxes paid per family rising substantially as we move to younger and younger cohorts. We note the same pattern for average benefits. However, now a different pattern emerges for the average net benefits received per family. In this case the average net benefits are virtually zero for all age cohorts. They differ slightly because we have not constrained the transfer to be zero for each cohort in each case, but have reduced the aggregate benefit payout each year to eliminate the transfer. Once again, the total taxes paid and total benefits received by each cohort increase
Table 7.6 Trans Cohort as of 1977 5 4 3 2 1 X Average tax per familya 7,058 18,345 33,882 53,326 73,843 Average benefit per family” 6,629 17,793 34,769 53,461 73,576 Average net benefit
per family” -429 -552 886 134.9 -267 Average net benefit
as % tax per family -6.07 -3.01 2.62 .25 -.36 Total taxes paid
by cohort (billions)” 172.1 235.0 349.4 389.0 539.6 1,500+ Total benefits paid
to cohort (billions)” 172.1 235.0 350.4 389.0 502.5 Transfers as % of
total benefits .01 -.01 .29 0 - 7.39
230 Michael J. BoskinIMarcy Avrinl Kenneth Cone Table 7.1 Trans 80 Cohort as of 1977 5 4 3 2 1 X Average tax per family" 7,045 17,818 31,368 47,729 64,409 Average benefit per family" 6,629 17,793 34,770 53,461 73,577 Average net benefit
per family" -415 -24.6 3,401 5,732 9,168 Average net benefit
as % tax per family -5.89 - .14 10.84 12.0 14.23 Total taxes paid
by cohort (billions)" 171.6 228.8 324.6 349.0 470.0 Total benefits paid
to cohort (billions)" 172.1 234.9 350.4 389.0 502.5 Transfers as % of
total benefits .25 2.60 7.36 10.28 6.46 "In 1977 dollars
substantially as we go to younger and younger cohorts and net to approx- imately zero in the aggregate for each cohort.
Moving from Trans to Trans 80 (table 7.7), which you recall involves a tax cut as well as eliminating the transfers, yields a very similar pattern to that discussed above for Trans; indeed, the benefits received by the average family in each cohort are identical to the situation under Trans, as are the total benefits paid out to each cohort. However, now the taxes differ somewhat to take account of the modest surplus that would result by eliminating all the transfers. In this case the average taxes per family are somewhat lower for each cohort, decreasing progressively more in percentage terms for younger and younger age cohorts. The total taxes paid per cohort follow the same pattern.
Table 7.8 presents the same analysis under the Base Case assumptions for the scenario we label "Ret" to indicate retirement ages raised by three years on average. As noted before, Ret results in a situation in which slightly higher taxes will be paid by the younger cohorts because they will be working slightly longer, and the benefits received, while maintainable at the same annual level, will be paid out over a somewhat shorter period.I3 Therefore the aggregate benefits and the average benefits will decline relative to the Base Case; we present estimates of benefits dis- counted to the original retirement age and note the decline in absolute 13. A Ret-type reform could be phased in: The retirement age could be increased to sixty-seven or sixty-eight gradually, before the baby boom generation reaches retirement age, by delaying the age of eligibility for benefits a month per year, for example. This would avoid problems of changing the rules abruptly for those soon to retire or just retired.
231 Modeling Alternative Solutions Table 7.8 Ret Cohort as of 1977 Average tax per family" Average benefit per family" Average % Reduction relative to Base Case Average net benefit per family" Average net benefit as % tax per family Total taxes paid by cohort (billions)" Total benefits paid to cohort (billions)" Transfers as % of total benefits 6,459 45,208 8.5 38,750 600 172.1 1,282.2 86.58 20,582 43,319 9.0 22,737 109.04 236.6 525.7 55.0 36,885 51,087 9.7 14,202 38.50 355.7 465.4 27.88 57,328 59,284 10.6 1,956 3.41 382.3 395.3 3.29 77,680 64,079 12.9 - 13,601 - 17.51 508.4 396.7 -28.18 Note: Values listed here are conditional on our standard assumption of the continuation of current life expectancies.
"In 1977 dollars.
and percentage terms. For example, the twenty-five through thirty-four year old cohort loses about $9,500, or 13% of average family benefits relative to the Base Case estimates presented in table 7.3. Remember, however, that the benefits calculated in the Ret scenario are feasible
because the long-term funding deficit has been closed. The Base Case benefit calculations ignore the funding problem and hence are notfeasible without tax changes. We note again that the average net benefit per family declines with age from $38,000 for current retirees to virtually zero for people now forty to a large negative number for people now around the age of thirty. The same is obviously true of average net benefits as a percentage of taxes per family. We note, however, that the total benefits received by each cohort will decline substantially with the later retire- ment. This decline becomes progressively more important as we approach younger age cohorts and reflects the importance of doing something about the long-term deficit as soon as possible, before enor- mous implicit obligations, which are currently unfunded, become cemented in place and we are forced to go to enormous tax increases to fund them.
This point is vividly documented by comparing Ret with the two tax scenarios: Tax 80, a small tax increase now (above those already legis- lated to take effect in the future), which will totally close the deficit; and Tax 2030, a large tax increase to finance the baby boom generation's
232 Michael J. BoskinJMarcy AvrinIKenneth Cone Table 7.9 Tax 80 Cohort as of 1977 5 4 3 2 1 Average tax per family" 7,074 18,966 36,839 59,907 84,935 Average benefit per family" 49,400 47,640 56,600 63,321 73,576 Average net benefit
Average net benefit Total taxes paid
by cohort (billions)" 172 237 378 440 605 Total benefits paid
to cohort (billions)".b 1,297 614 592 485 516 Transfers as % of
per family" 42,327 28,674 19,761 6,414 - 11,358 as % tax per family 598.3 151.2 53.64 10.71 - 13.37
total benefits 87 61 36 9 - 17
"In 1977 dollars.
bThese values differ slightly from the Base Case because a smaller sample size was used in this calculation.
retirement in the year 2030. Estimates for the latter two alternatives are contained in tables 7.9 and 7.10, respectively. Recall that these refer to the increases necessary to cover the OASI deficit only; the Disability Insurance and Health Insurance deficits would add considerably to the totals. The average tax paid and average benefit received per family look rather similar to the Ret case; the average net benefits differ somewhat. What is most important is the large difference in the total benefits received by each cohort as part of the Social Security System and the total social security taxes paid for each cohort. Under Trans, Trans 80, or Ret, the benefits are reduced in the Social Security System either directly or indirectly, and the total benefits paid to each cohort are much lower than if the implicit unfunded obligation involved is paid. The total benefits paid to younger cohorts differ enormously under the Tax 80 and Tax 2030 programs, as do the taxes paid. For example, while the total benefits paid to each cohort are identical under Tax 80 and Tax 2030, the time patterns and hence aggregate amounts of taxes paid by each age cohort differ substantially. The aggregate taxes paid by current retirees and by workers aged fifty-five through sixty-four are virtually identical under these two scenarios. By the time we get to the thirty-five through forty-four year olds, Tax 80 has this cohort paying $50 billion more in social security taxes than if we wait until after they retire to raise the tax rates in order to finance the unfunded deficit. For those aged twenty-five through thirty- four the difference amounts to $80 billion! This highlights the importance
233 Modeling Alternative Solutions Table 7.10 Tax 2030 Cohort as of 1977 5 4 3 2 1 Average tax per family" 7,058 18,346 33,883 53,326 73,843 Average benefit per family" 49,401 47,640 56,600 66,321 73,576 Average net benefit
Average net benefit Total taxes paid
by cohort (billions)" 167 230 349 393 526 Total benefits paid
to cohort 1,297 614 592 486 516
Transfers as % of
total benefits 87 63 41 19 - 2
per family" 42,343 29,294 22,717 12,994 - 267 as % tax per family 600 159.68 67.05 24.37 - .36
'In 1977 dollars.
These values differ slightly from the Base Case because a smaller sample size was used in this calculation.
of chosing a time frame for dealing with the long-term funding problems of social security. Chosing to do nothing about this implies that we are trying to stick younger and younger generations with the bill. Will they be willing to finance future retirement payments at much higher tax rates than now exist?
In summary, we may note the variety of potential strategies for disen- tangling the severe problems that high and rising social security taxes and dual-purpose unrationalized benefits create. We can simply say that we are going to raise taxes by substantially more than those legislated in the 1977 amendments either currently (Tax 80) or in the distant future (Tax 2030), and try to shift around the burden of paying for these increased social security benefits, which are not currently funded, or we can try to rationalize the benefit payments by separating out the transfer and annu- ity goals of the system, strengthening the earned entitlement function and having a separate transfer payment program funded by general revenues at whatever level is deemed socially desirable. The latter alternatives exist under Trans and Trans 80, and are easily combined with a slight increase in the retirement age as in Ret. These different scenarios suggest not only that there will be an enormous long-run impact on our overall economy depending upon which of these types of avenues we pursue, but that different groups in the population will be taxed and benefited quite differently depending upon which of these alternatives we select. It is time for a fundamental refocusing of social security to rationalize the
234 Michael J. BoskidMarcy AvrinJKenneth Cone
benefit structure and relieve the long-run burden of the much higher payroll taxes implicit in the unfunded deficit. This paper is the first of our social security simulation model projections. Subsequent work will deal with other issues (e.g. alternative indexing possibilities). We hope to stimulate discussion as well as provide some quantitative estimates of the taxes, benefits, and deficit implied by alternative potential solutions to the long-run social security funding problems.
7.9 Further Work Completed
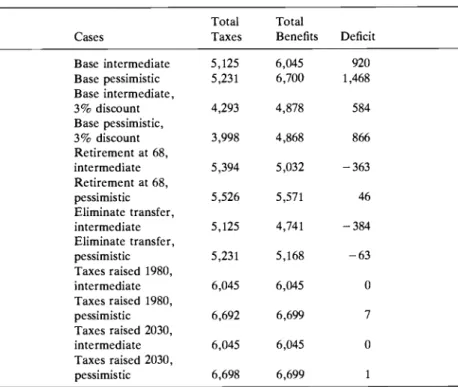
Since the original version of this paper was written, the Social Security Administration 1980 trustees’ annual report was issued with considerably altered assumptions in their intermediate and pessimistic Base Case scenarios. Therefore we have recalculated a variety of the aggregate tax, benefit, and deficit totals, and discounted them back to 1980 under the assumptions used by the Social Security Administration 1980 trustees’ annual report. These results are summarized in table 7.11. In all cases, “intermediate” refers to the intermediate assumptions of the trustees and “pessimistic” refers to the pessimistic assumptions of the trustees. The major differences between the 1980 assumptions and those made pre- viously are a slower rate of productivity growth, higher inflation in the pessimistic case, lower fertility rates, higher unemployment in the short term, and a lower discount rate.
The general nature of the results conforms closely with those reported earlier in our paper-obviously, however, updated to 1980 from 1977 dollars. For example, the intermediate base projection reveals a deficit of slightly under $1 trillion in the social security retirement system; the pessimistic assumptions reveal a real 1980 deficit of almost $1.5 trillion. Because the Social Security Administration trustees have chosen to use lower discount rates in reporting results in their 1980 report, we also present in rows 3 and 4 the same estimates using our earlier 3% real discount rate; this reduces the present values of the deficit to about two-thirds of those just reported. The other major findings remain qual- itatively unchanged: Raising the retirement age to sixty-eight runs a modest surplus under the intermediate assumptions and nearly elimi- nates the deficit under the pessimistic one. Eliminating the transfers runs large surpluses, but such a scenario, of course, would have to be sup- plemented by an expanded income security program for the elderly, which would probably more than make up for the difference. Raising taxes in 1980 or in 2030 to close the deficit over the entire period 1980-2050 would require, in the four cases considered, tax rate increases above and beyond those already legislated of 1.6 and 2.4%, in the intermediate and pessimistic scenarios beginning in 1980; and 7% and 12% under these two scenarios in the year 2030.
235 Modeling Alternative Solutions
Table 7.11 Aggregate Taxes, Benefits, and the Deficit under Alternative Reforms
Total Total
Cases Taxes Benefits Deficit Base intermediate Base pessimistic Base intermediate, 3% discount Base pessimistic, 3% discount Retirement at 68, intermediate Retirement at 68, pessimistic Eliminate transfer, intermediate Eliminate transfer, pessimistic Taxes raised 1980, intermediate Taxes raised 1980, pessimistic Taxes raised 2030, intermediate Taxes raised 2030, pessimistic 5,125 5,231 4,293 3,998 5,394 5,526 5,125 5,231 6.045 6,692 6,045 6,698 6,045 6,700 4,878 4,868 5.032 5,571 4,741 5,168 6.045 6,699 6,045 6,699 920 1,468 584 866 - 363 46 - 384 - 63 0 7 0 1 ~~ ~
Note: All figures are in billions of discounted 1980 dollars.
As can be seen, the assumptions of the Social Security Administration trustees are becoming slightly more pessimistic, and hence the problems discussed in this paper are, if anything, becoming more and more acute.
7.10 Induced Retirement
All the estimates made thus far conform in their assumptions to those usually made by the Social Security Administration trustees, for exam- ple, those that pertain to labor force participation, retirement behavior, etc. It is possible, and indeed in some cases desirable, to build behavioral simulations into the model that will account for econometric evidence on these decisions. Since the real level of social security benefits is scheduled to increase substantially as time goes on through the use of wage, as opposed to price, indexing of the formula calculating the initial benefits, any response of retirement behavior to increases in real social security benefits should be taken into account in analyses of the type performed above. As a first step in this direction, we have overridden the Social Security Administration’s retirement assumption with a series of retire-