A FRAMEWORK FOR DEVELOPING
SYNTHETIC CHEMICAL AND BIOLOGICAL AGENT RELEASE DATA SETS
George Bieberbach1, Paul E. Bieringer1, Ryan Cabell1, Jonathan Hurst1, Jeffrey Weil1, Andrzej Wyszogrodzki1, and John Hannan2
1National Center for Atmospheric Research, Boulder, Colorado 2Defense Threat Reduction Agency, Fort Belvoir, Virginia
Abstract: Our nation invests heavily in technologies to defend against the hostile use of chemical and biological (CB) weapons and ensure that Department of Defense (DoD) operations remain unconstrained by a CB attack. The new contamination avoidance systems now being developed and tested are key to meeting this requirement. The robust system development and testing of these technologies requires the extensive use of observational data sets. Unfortunately, it is not cost-effective to create the large quantity of data sets necessary for this task through simulated-agent or live-agent testing. Virtual-environment test data sets provide a powerful tool that can be used to overcome this challenge. This presentation will describe a modeling and simulation framework currently under development that is designed to meet this critical need. This framework, called the Virtual THreat Response Emulation and Analysis Testbed (VTHREAT), accomplishes this task by utilizing a variety of research grade atmospheric and transport and dispersion (T&D) models to generate physically realistic four-dimensional representations of the CB agent behavior in various turbulent atmospheric environments. These virtual environments may then be probed by virtual CB sensor platforms, to evaluate their performance under varying atmospheric regimes, background interferent levels, and CB release scenarios. One of the core modeling components, called the EULerian semi-LAGrangian research model for geophysical flows (EULAG), can utilize Direct Numerical Simulation (DNS) or Large Eddy Simulation (LES) numerical techniques for simulating atmospheric turbulent flows and is used extensively by the atmospheric turbulence community. Within VTHREAT, EULAG has been coupled to a Lagrangian Particle Dispersion Model (LPDM) to simulate the turbulent transport and dispersion of a CB material release. The combined EULAG/LPDM system has undergone preliminary evaluations characterizing its ability to produce realistic virtual CB dispersion patterns, has been used to support field test planning/design, and is being enhanced to test future CB defense applications. Examples of these evaluations and applications will be presented along with a discussion of future plans. The presentation will also include a demonstration of the latest VTHREAT User Interface (UI).
Key words: Large Eddy Simulation, Transport & Dispersion, Observing System Simulation Experiment, Virtual Test & Evaluation.
INTRODUCTION
Sensor technologies developed and used by the chemical, biological, and radiological (CBR) defense community are designed to provide information that can be used to save lives and maintain operational tempo of the United States (US) and allied armed forces in the event of a CBR attack. Similar technologies are used to defend civilian populations against the accidental or intentional release of CBR warfare agents or toxic industrial materials. One of the major challenges, faced by this community, is the ability to comprehensively test and evaluate emerging sensor technologies for the broad range of geo-graphic locations and environmental conditions, in which these systems may be deployed. While live agent field-testing is certainly the preferred method, it is arguably the most expensive and logistically complex. Additionally, it is difficult to test under all expected environmental conditions and geographic locations.
“Virtual” field-testing is an approach that can be utilized to supplement actual field-testing of systems, thereby improving the confidence of the expected system performance. Also known as Observing System Simulation Experiments (OSSEs), virtual testing has been widely used by the meteorological community for decades. For example, OSSEs are routinely used to evaluate the potential impact on forecast skill of new satellite based meteorological measurements systems, before they are developed and deployed (Kuo and Guo, 1989).
This paper describes a new virtual testing system framework being specifically developed for and sponsored by the Defense Threat Reduction Agency - Joint Science and Technology Office for Chemical and Biological Defense (DTRA-JSTO-CBD). This framework, called the Virtual THreat Response Emulation and Analysis Testbed (VTHREAT), is a toolbox of modeling and simulation capabilities, which can be used to evaluate CBR sensor systems, against a wide range of synthetic CBR environments. Note that VTHREAT is not a fixed system of software components/models, but rather is a modular framework that can utilize a variety of atmospheric, transport and dispersion (T&D), sensor-emulator, information-fusion, and response-system models, based on the specific needs of the end application.
The VTHREAT underlying modeling systems and some preliminary validation results are described in Sections 2 and 3. In section 4, we discuss some past and current applications of VTHREAT, ending with summary and conclusions in section 5. VTHREAT COMPONENTS
Although VTHREAT can be used to simulate a variety of atmospheric and dispersion scales, it has primarily been utilized to simulate conditions at the micro beta (100m) and gamma (10m) scales. Therefore, we only review those modeling systems, applicable at these scales.
Atmospheric and dispersion models EULAG
The EULerian semi-LAGrangian research model for geophysical flows (EULAG) is the primary atmospheric model, in VTHREAT, used to simulate atmospheric turbulence in the Planetary Boundary Layer (PBL) at the micro beta and gamma
scales, also known as Large Eddy Simulations (LES). EULAG is a general multi-scale, multi-physics computational model for simulating thermo-fluid flows across a wide range of scales and physical scenarios (Smolarkiewicz and Prusa 2005, Prusa et al. 2008). It solves the nonhydrostatic anelastic equations of motion with options available for compressible or incompressible Boussinesq fluids and the incompressible Euler/Navier-Stokes equations (Smolarkiewicz et al. 2001). Some unique model features include non-oscillatory integration algorithms, a robust preconditioned elliptic solver, and a generalized coordinate formulation enabling grid adaptation. The EULAG model has applicability to turbulence, gravity wave dynamics, micrometeorology, cloud dynamics, and global atmospheric flows.
Lagrangian Particle Dispersion Model (LPDM)
For simulating turbulent atmospheric transport and dispersion at the micro scale, VTHREAT is utilizing the Lagrangian Particle Dispersion Model (LPDM) of Weil et al 2004. LPDM has been specifically developed to utilize the resolved and subgrid-scale (SGS) velocities from a LES to simulate the advection and dispersion of passive particles. The SGS velocities are derived from an adaptation of Thomson’s (1987) Lagrangian Stochastic Model (LSM), which replaces the ensemble mean velocity and velocity variance with the resolved velocity and SGS variance, provided by the LES.
Meteorological and CB Sensor models
VTHREAT currently includes a small number of both research grade and operational grade chemical sensor models. These include the Dugway Proving Ground (DPG) operated digital photo-ionization detector (digiPID), the Defense Science and Technology Laboratory (DSTL) ultra-violet ion collector (UVIC), and the Department of Defense (DoD) Automatic Chemical Agent Detector Alarm (ACADA). Other CB sensor emulations model, planned for integration into VTHREAT, include the DoD Joint Chemical Agent Detector (JCAD), Joint Biological Point Detection System (JBPDS), and Joint Services Lightweight Standoff Chemical Agent Detector (JSLSCAD). Simplistic sensor models have also been developed and implemented which emulate the response of in situ point meteorological instruments, including the DPG Portable Weather Information Display System (PWID), which consists of tripod mounted propeller-vane wind monitor and a temperature/humidity sensor, providing measurements at 2 meters AGL.
Graphical User Interface (GUI)
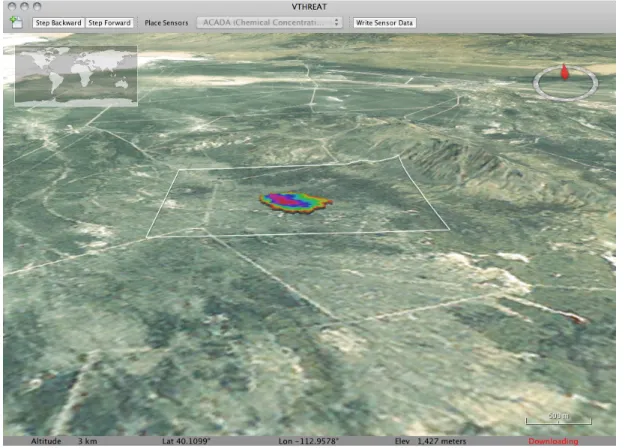
The VTHREAT GUI core capabilities allow a user to easily load existing virtual test simulations (e.g. EULAG-LPDM simulation results), visualize the 4-dimensional environment, place CB and meteorological sensors within that environment, and save the CB sensor readings for later analysis or as input to downstream CB sensor information systems. The GUI architecture is currently based on the National Aeronautics and Space Administration (NASA) World Wind Java Geospatial Visualization Platform (Hogan and Coughlan 2006), which provides access to a variety of external web map server (WMS) services and datasets. The latest GUI prototype is shown in Figure 1 below.
Figure 1. Screenshot of the VTHREAT prototype GUI, based on the NASA World Wind Java Geospatial Visualization Platform. A virtual CB plume is shown at Dugway Proving Ground, Utah, overlaying local overhead imagery and terrain elevation.
VTHREAT VALIDATION
The ability of the VTHREAT system to replicate field experiment conditions has been validated against a variety of field and laboratory experimental datasets. In particular, EULAG and LPDM were configured to simulate the turbulent transport and dispersion within three idealized planetary boundary layers representing convective, neutral, and weakly stable atmospheric stabilities. These results were then compared against the convection-tank experiments of Willis and Deardorff (1976), Deardorff and Willis (1984), the CONDORS data by Briggs (1993), and the Project Prairie Grass (PPG) experiment (Barad 1958). The convective stability results are summarized in Figure 2, below.
Figure 2. Clockwise from top left: Dimensionless lateral dispersion, vertical dispersion, crosswind integrated concentration, and mean plume height as a function of dimensionless downwind distance for the EULAG-LPDM ensemble mean (red dashed line), CONDORS surface releases (black dot), CONDORS elevated releases (square), Willis and Deardorff convective tank (diamond and circles with x), Prairie Grass (open circles), LPDM-NCM3 simulations (blue dashed line), and surface layer similarity (SLS) theory (green dashed line).
As shown, dimensionless cross wind integrated concentrations (CWIC)
€
CyUzi/Q, lateral and vertical dispersion
€
σy/zi and
€
σz/zi respectively, and mean plume height
€
zp/zi, are plotted as a function of dimensionless downwind distance,
€ X=w*x/(Uzi), where, € Cy = Non-dimensionless CWIC €
U = Mean Wind Speed
€
zi = Boundary Layer Depth € Q = Source Strength € σy = Lateral dispersion € σz = Vertical Dispersion €
zp = Mean Plume Height
€
w* = Convective velocity scale
€
x = Downwind distance
The LPDM-EULAG simulation results compare well with both the field experimental datasets (Prairie Grass and CONDORS) and laboratory convective tank observations (Willis and Deardorff). In particular, the dimensionless lateral dispersion simulated curve increases linearly with dimensionless downwind distance with the same slope as the observed
datasets. Similarly the dimensionless vertical dispersion increases linearly, before reaching a maximum value at ~ X < 1. The dimensionless mean plume height also displays a linear increase up to ~ X = 1, consistent with the field and laboratory data. Lastly, the dimensionless CWIC shows good agreement with not only the observed datasets, but also previous LES-LPDM simulations (LES-LPDM-NCM3) and surface layer similarity (SLS) theory. Similar results were found for the neutral and stable cases (not shown here).
VTHREAT APPLICATIONS
CB Source Term Estimation Algorithm Development
The VTHREAT concept was originally conceived to support development and testing of CB Source Term Estimation (STE) algorithms. These algorithms attempt to estimate CB release source characteristics (e.g. mass, location, release rate) using operationally available CB and meteorological sensor measurements. In order to robustly test these emerging algorithms, CB sensor measurements were needed for a wide range of release scenarios, and atmospheric conditions. Unfortunately, readily available CB sensor datasets were lacking. As a consequence, the VTHREAT concept was first envisioned and subsequently developed to meet this immediate need.
Using the same simulations, discussed in Section 3, and the sensor models described in Section 2, a large quantity of synthetic CB sensor measurements have been generated and used as input to the STE algorithms under evaluation. These virtual data sets, combined with actual field test measurements, have greatly enhanced the ability to more quickly identify flaws and limitations within the STE algorithm designs.
CB Field Test Planning
To support the development and testing of CB STE algorithms, described above, the Defense Threat Reduction Agency (DTRA) Joint Science and Technology Office (JSTO) Chemical Biological Defense (CBD) program sponsored an extensive set of field trials, also known as the FUsing Sensor Information from Observing Networks (FUSION) Field Trial 2007 (FFT-07). FFT-07 was a short-range (~500 m), highly instrumented dispersion test that was conducted at the U.S. Army’s Dugway Proving Ground in September 2007.
During the field test design phase, several conflicting sensor grid designs were pro-posed to meet the field test objectives. The optimal sensor grid layout would be large enough to capture the entire chemical plume, while also having enough sensor density to resolve the plume. To aid the grid design decision, VTHREAT was used to simulate a variety of proposed release scenarios, under varying atmospheric conditions, and extract virtual sensor measurements for each grid design. The synthetic sensor measurements from each design were then analyzed to determine which design best met the field test objectives. Using these results, the field test designers were able to quantitatively analyze the pros and cons of different field test designs, and choose a design that had the highest likelihood of success.
CB Sensor Testing
More recently, VTHREAT is currently being tailored to support testing and evaluation of new and emerging CB sensor platforms for the Department of Defense (DoD), with particular emphasis on adding the ability to test biological sensor equipment. As men-tioned previously, the robust operational testing and evaluation of these sensor technologies is a major challenge, due to cost and limitations associated with live agent field tests. This is particularly challenging when testing biological sensor equipment in an operationally relevant environment. Not only are biological agent field tests restricted to using simulants, rather than live agents, but they are also limited to a specific geographic test location (e.g. DPG). Due to Dugway’s dry climate and pristine air quality, evaluations of biological sensors, which are sensitive to atmospheric humidity and background aerosol interferents, will likely be favorably biased. Therefore, there is an urgent need to expand the range of test environmental conditions, with particular emphasis on expanding the range of background aerosol interferent levels. Due to this need, work is underway to develop a biological aerosol background modeling capability, in VTHREAT, which will faithfully represent the random structure and magnitude of naturally occurring background aerosol levels. Initial plans are to couple EULAG/LPDM with a background aerosol model, being developed by the United Kingdom‘s Defense Science and Technology Laboratory (DSTL).
CONCLUSIONS
A new virtual testing framework, to support testing and evaluation of emerging CB sensor platforms and associated information systems/algorithms, was reviewed. This framework, called VTHREAT, combines research grade atmospheric and dispersion modeling systems with atmospheric and CB sensor response models to evaluate sensor effectiveness for a variety of realistic atmospheric conditions and CB release scenarios. A simple user interface has been developed which allows a user to load existing virtual CB scenarios, visualize the environment, place sensors within that environment, then save the virtual sensor readings either for later analysis or for input into downstream in-formation technology systems. VTHREAT dispersion simulation results compare well against both field and laboratory experimental data for convective, neutral, and weakly stable conditions.
VTHREAT has been successfully used to support field experiment design and CB source term estimation algorithm development and is presently being enhanced to support Operational Testing and Evaluation (OT&E) of DoD contamination avoidance sensor systems. Future work includes development of a biological aerosol background modeling capability, adding a biological sensor capability, and enhancing the user interface.
REFERENCES
Barad, M.L., 1959. Project Prairie Grass, a Field Program in Diffusion. Vol. 1., Air Force Cambridge Research Center. Briggs, G.A., 1993. Plume dispersion in the convective boundary layer. Part II: Analyses of CONDORS field experiment
data. J. Appl. Meteor. 32, 1388–1425.
Deardorff, J.W. and G.E. Willis, 1984. Ground level concentration fluctuations from a buoyant and a non-buoyant source' within a laboratory convectively mixed layer. Atmos. Environ. 18, 1297-1309.
Hogan, P. and J. Coughlan, 2006. NASA World Wind, Open Source 4D Geospatial Visualization Platform: .NET & Java*. Eos Trans. AGU, 87(52), Fall Meet. Suppl.
Kuo, Y.-H. and Y.-R. Guo, 1989. Dynamic initialization using observations from a hypothetical network of profilers: Impact on short-range numerical weather prediction. Mon. Wea. Rev. 117, 1975–1998.
Prusa, J.M., P.K. Smolarkiewicz, and A.A. Wyszogrodzki, 2008. EULAG, a computational model for multiscale flows. Computers and Fluids 37, 1193–1207.
Smolarkiewicz, P.K., L.G. Margolin, and A.A. Wyszogrodzki, 2001. A class of nonhydrostatic global mod-els. J. Atmos. Sci. 58, 349–364.
Smolarkiewicz, P.K. and J.M. Prusa, 2005. Towards mesh adaptivity for geophysical turbulence: continuous mapping approach. Int. J. Numer. Meth. in Fluids 47, 789-801.
Thomson, D.J., 1987. Criteria for the selection of stochastic models of particle trajectories in turbulent flows. J. Fluid Mech. 180, 529-556
Willis, G.E., and J.W. Deardorff, 1976. A laboratory model of diffusion into the convective planetary boundary layer. Quart. J. Roy. Meteor. Soc. 102, 427–446.
Weil, J.C., P.P. Sullivan, and C.-H. Moeng, 2004. The use of large-eddy simulations in Lagrangian particle dispersion models. J. Atmos. Sci. 61, 2877-2887.