Micro-Benchmark Level Performance Comparison of High-Speed Cluster
Interconnects
Jiuxing Liu
Balasubramanian Chandrasekaran
Weikuan Yu
Jiesheng Wu
Darius Buntinas
Sushmitha Kini
Peter Wyckoff
ÝDhabaleswar K. Panda
Computer and Information Science
The Ohio State University
Columbus, OH 43210
liuj, chandrab, yuw, wuj, buntinas,
kinis, panda
@cis.ohio-state.edu
Ý
Ohio Supercomputer Center
1224 Kinnear Road
Columbus, OH 43212
[email protected]
Abstract
In this paper, we present a comprehensive performance evaluation of three high speed cluster interconnects: Infini-Band, Myrinet and Quadrics. We propose a set of micro-benchmarks to characterize different performance aspects of these interconnects. Our micro-benchmark suite includes not only traditional tests and performance parameters, but also those specifically tailored to the interconnects’ ad-vanced features such as user-level access for performing communication and remote direct memory access. In order to explore the full communication capability of the inter-connects, we have implemented the micro-benchmark suite at the low level messaging layer provided by each inter-connect. Our performance results show that all three in-terconnects achieve low latency, high bandwidth and low host overhead. However, they show quite different perfor-mance behaviors when handling completion notification, unbalanced communication patterns and different commu-nication buffer reuse patterns.
1
Introduction
Today’s distributed and high performance applications require high computational power as well as high commu-nication performance. In the past few years, the compu-tational power of commodity PCs has been doubling about every eighteen months. At the same time, network intercon-nects that provide very low latency and very high bandwidth are also emerging. This trend makes it very promising to build high performance computing environments by cluster-ing, which combines the computational power of commod-ity PCs and the the communication performance of high speed network interconnects.
Currently, there are several network interconnects that provide low latency (less than 10 s) and high
This research is supported in part by Sandia National Laboratory’s contract #30505, Department of Energy’s Grant #DE-FC02-01ER25506, and National Science Foundation’s grants #EIA-9986052 and #CCR-0204429.
width (in the order of Gbps). Two of the leading prod-ucts are Myrinet[12] and Quadrics[13]. More recently, InfiniBand[8] has entered the high performance comput-ing market. All three interconnects share many similari-ties: They provide user-level access to the network interface card for performing communication and support access to remote processes’ memory address space. However, they also differ in a lot of ways. Therefore, an interesting ques-tion arises:How can we conduct a meaningful performance comparison among all the three interconnects?
Traditionally, simple micro-benchmarks such as latency and bandwidth tests have been used to characterize the com-munication performance of network interconnects. Later, more sophisticated models such as LogP[6] were proposed. However, these tests are designed for general parallel com-puting systems and they do not address many features that are present in the interconnects studied in this paper.
Another way to evaluate different network interconnects is to use real world applications. However, real applications usually run on top of a middleware layer such as the Mes-sage Passing Interface (MPI). Therefore, the performance we see reflects not only the capability of the network in-terconnects, but also the quality of the MPI implementa-tion and the design choices made by different MPI imple-menters. Thus, to provide more insights into the communi-cation capability offered by each interconnect, it is desirable to conduct tests at a lower level.
In this paper, we have proposed an approach to evalu-ate and compare the performance of three high speed in-terconnects: InfiniBand, Myrinet and Quadrics. We have designed a set of micro-benchmarks to characterize differ-ent aspects of the interconnects. Our micro-benchmarks in-clude not only traditional performance measurements, but also tests that are more relevant to networks that provide user-level mode access. Our benchmarks also concentrate on the remote memory access capabilities provided by each interconnect. We have conducted tests in an 8-node cluster that has all the three network interconnects. From the
ex-periments we have found that although these interconnects have similar programming interfaces, their performance be-havior differs significantly when it comes to handling com-pletion notification, different buffer reuse patterns and un-balanced communication, all of which cannot be evaluated by latency/bandwidth tests.
The rest of this paper is organized as follows: In Sec-tion 2 we provide an overview of the studied interconnects and their messaging software. In Section 3 we present our micro-benchmarks and their performance results. We then discuss related work in Section 4. Conclusions are pre-sented in Section 5.
2
Overview of Interconnects
2.1
InfiniBand/VAPI
The InfiniBand Architecture defines a network for inter-connecting processing nodes and I/O nodes. In an Infini-Band network, processing nodes and I/O nodes are con-nected to the fabric by Host Channel Adapters (HCAs) or Target Channel Adapters (TCAs).
Our InfiniBand platform consists of InfiniHost 4X HCAs and an InfiniScale switch from Mellanox[10]. InfiniScale is a full wire-speed switch with eight 10 Gbps ports. Infini-Host MT23108 HCAs connect to the host through PCI-X bus. They allow for a bandwidth of up to 10 Gbps over their ports.
VAPI is the software interface for InfiniHost HCAs. The interface is based on InfiniBand verbs layer. It supports both send/receive operations and remote direct memory access (RDMA) operations. Currently, Reliable Connection (RC) and Unreliable Datagram (UD) services are implemented. In this paper, we focus on RC service. In VAPI, user buffers must be registered before they can be used for communica-tion. The completion of communication requests is reported through completion queues (CQs).
2.2
Myrinet/GM
Myrinet was developed by Myricom[11] based on com-munication and packet-switching technology originally de-signed for massive parallel processors (MPPs). Myrinet has a user-programmable processor in the network interface card that provides much flexibility in designing communi-cation software.
Our Myrinet network consists of M3F-PCIXD-2 NICs connected by a Myrinet-2000 switch. The link bandwidth of the Myrinet network is 2Gbps. The Myrinet-2000 switch is a 8-port crossbar switch. The network interface card uses 133MHz/64bit PCI-X interface. It has a programmable Lanai-XP processor running at 225 MHz. The Lanai pro-cessor on the NIC can access host memory via the PCI-X bus through the DMA controller.
GM is the low-level messaging layer for Myrinet clus-ters. It provides protected user-level access to the network
interface card and ensures reliable and in-order message de-livery. GM provides to the upper layer a connectionless communication model. GM supports send/receive opera-tions. It also has directed send operation which can di-rectly write data to a remote node’s address space. Similar to VAPI, user communication buffers must be registered in GM.
2.3
Quadrics/Elanlib
Quadrics networks consist of Elan3 network interface cards and Elite switches[15]. The Elan network interface cards are connected to hosts via 66MHz/64Bit PCI bus. Elan3 has 64 MB on-board SDRAM and a memory man-agement unit (MMU). An Elite switch uses a full crossbar connection and supports wormhole routing.
Our Quadrics network consists of Elan3 QM-400 net-work interface cards and an Elite 16 switch. The Quadrics network has a transmission bandwidth of 400MB/s in each link direction.
Elanlib supports protected, user-level access to Elan net-work interfaces. It provides a global virtual address space by integrating individual node’s address space. One node can use DMA to access a remote node’s memory space. Elanlib provides a general-purpose synchronization mech-anism based on events stored in Elan memory. The com-pletion of remote DMA operations can be reported through events. Unlike VAPI and GM, communication buffers do not need to be registered. Elan network interface cards have an on-board memory management unit. The system soft-ware is responsible for synchronizing the MMU table and doing the address translation.
3
Micro-Benchmarks and Performance
To provide more insights into communication behavior of the three interconnects, we have designed a set of micro-benchmarks and performance parameters to reveal different aspects of their communication performance. They include traditional benchmarks and performance parameters such as latency, bandwidth and host overhead. In addition, we have designed tests that are more related to the user-level com-munication model used by these interconnects. For exam-ple, we have designed benchmarks to characterize the im-pact of address translation mechanisms used by the network interface cards as well as the effect of completion notifica-tion. In the hot-spot tests, we provide information about how these interconnects can handle unbalanced communi-cation patterns.
Our experimental testbed consists of 8 SuperMicro SU-PER P4DL6 nodes with ServerWorks GC chipsets and dual Intel Xeon 2.40 GHz processors. The machines were con-nected by InfiniBand, Myrinet and Quadrics interconnects. The InfiniHost HCA adapters and Myrinet NICs work under the PCI-X 64-bit 133MHz interfaces. The Quadrics cards use 64-bit 66MHz PCI slots. We used the Linux Red Hat 7.2 operating system.
3.1
Latency and Bandwidth
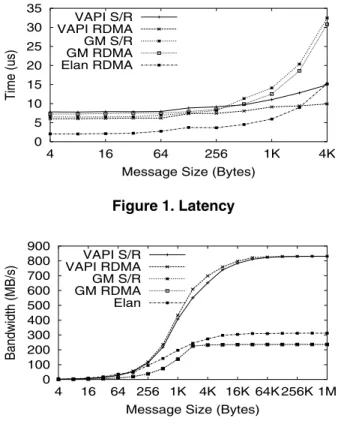
End-to-end latency has been frequently used to charac-terize the performance of interconnects. All the intercon-nects under study support access to remote nodes’ memory space. We thus also measured the latency to finish a remote put operation. InfiniBand/VAPI and Myrinet/GM also sup-port send/receive operations. Figure 1 shows the latency re-sults. For small message, Elanlib achieves the best latency, which is 2.0 s. VAPI RDMA latency is around 6.0 s and send/receive latency is around 7.8 s. GM has a small mes-sage latency of about 6.5 s for send/receive. Its RDMA (directed send) has a slightly higher latency of 7.3 s. For messages less than 64 bytes, GM send/receive can combine data and descriptor at the sender side. Therefore it offers better performance than directed send.
The bandwidth test is used to determine the maximum sustained data rate that can be achieved at the network level. In this test, a sender keeps sending back-to-back messages to the receiver until it has reached a pre-defined queue size Q. Then it waits for Q/2 messages to finish and sends out another Q/2 messages. In this way, the sender ensures that there are at least Q/2 and at most Q outstanding messages. A similar method has been used in [4]. Figure 2 shows the bandwidth results with very large queue size. Figure 3 shows the bandwidth with different queue size. The peak bandwidth for VAPI, GM, and Elan is around 831MB/s, 236MB/s and 314MB/s, respectively. We can see that VAPI is more sensitive to the value of queue size Q and it per-forms much better for large messages. (Note that unless stated otherwise, the unit MB in this paper is an abbrevia-tion for 2¾¼
bytes.)
3.2
Bi-Directional Latency and Bandwidth
Compared with uni-directional latency and bandwidth tests, bi-directional latency and bandwidth tests put more stress on the PCI bus, the network interface cards, and the switches. Therefore they may be more helpful to us to un-derstand the bottleneck in communication. The tests are carried out in a way similar to the uni-directional tests. The difference is that both sides send data simultaneously. From Figure 4, we can see bi-directional latency performance for all interconnects is worse than their uni-directional latency except for Elan. Figure 5 shows results for bandwidth. We see that for VAPI, the PCI-X bus becomes the bottleneck and limits the bandwidth to around 901MB/s. Although Elan has better uni-directional bandwidth than GM, its peak bi-directional bandwidth is only around 319MB/s, which is less than GM’s 471MB/s.3.3
Host Communication Overhead
We define host communication overhead as the time CPU spends on communication tasks. The more time CPU spends in communication, the less time it can do compu-tation. Therefore this can serve as a measurement of the
ability of a messaging layer to overlap communication and computation. We characterize the host overhead for both latency and bandwidth tests. In the latency test, we directly measure the CPU overhead for different message sizes. In the bandwidth test, we insert a computation loop in the pro-gram. By increasing the time of this computation loop, eventually we see a drop in the bandwidth.
Figure 6 presents the host overhead in the latency test. VAPI has the highest overhead, which is 2.0 s. Elan over-head is around 0.7 s. GM has the least overover-head, which is around 0.5 s. GM reduces the overhead further for mes-sages less than 64 bytes by combining data and send de-scriptors. Figure 7 shows the impact of computation time on bandwidth. All three interconnects can overlap com-munication and computation quite well. Their bandwidth drops only after over 99% of running time is used for com-putation.
3.4
Overhead of Completion Notification
Since all three interconnects support remote direct mem-ory access, one way to detect the arrival of messages at the receiver side is to poll on the memory content in the desti-nation buffer. This approach can be used to minimize the receiver overhead. However, this method is hardware de-pendent because it relies on the order how the DMA con-troller writes to host memory.
The network interconnects we have studied support dif-ferent mechanisms to report the completion of remote mem-ory operations. For example, VAPI uses CQ, while GM and Elanlib rely on event abstractions. Figure 8 shows the in-crease in latency when using these mechanisms for remote memory access at the receiver side. Elan has very efficient notification mechanism, which adds only 0.4 s overhead for large messages. For messages less than 64 bytes, there is no extra overhead. VAPI has an overhead of around 1.8 s. GM’s directed send does not have a mechanism to notify the receiver of message arrival. Therefore, we simulated the notification by using a separate send operation. This adds around 3-5 s overhead. Instead of busy polling, the upper layer can also use blocking to wait for completions. From Figure 9 we can observe that VAPI has the highest overhead, which is over 20 s. The overheads for GM and Elan are about 11 s and 13 s, respectively.
3.5
Impact of Buffer Reuse
In most micro-benchmarks that are designed to test com-munication performance, only one buffer is used at the sender side and the receiver side, respectively. However, in real applications a large number of different buffers are usually used for communication. The buffer reuse pattern can have a significant impact on the performance of inter-connects that support user-level access to network interfaces such as those studied in this paper. More information re-garding buffer reuse patterns can be found in [5].
To capture the cost of address translation at the network interface, we have designed two schemes of buffer reuse pattern and we have changed the tests accordingly. In the first scheme, N different buffers of the same size are used in FIFO order for multiple iterations. By increasing the number N, it may happen that eventually the performance drops. Basically, this test measures how large the commu-nication working set can be in order to get best communi-cation performance. Figure 10 shows the bandwidth results with 512KBytes messages. We can see that up to 25 buffers, GM and Elan show no performance degradation. However, VAPI performance drops when more than 10 buffers are used.
The second scheme is slightly more complicated. In this scheme, the test consists of N iterations and we define a buffer reuse percentage R. For the N iterations of the test, N*R iterations will use the same buffer, while all other it-erations will use completely different buffers. By changing buffer reuse percentage R, we can see how communication performance is affected by buffer reuse patterns. From Fig-ures 11 and 12, we can see that Elan is very sensitive to buffer reuse patterns. Its performance drops significantly when the buffer reuse rate decreases. VAPI also shows sim-ilar behavior. GM latency increases slightly when the buffer reuse rate decreases, but its bandwidth performance is not sensitive to the buffer reuse rate.
3.6
Hot-Spot Tests
Hot-spot tests are designed to measure the ability of net-work interconnects to handle unbalanced communication patterns. Similar tests have been conducted in [14]. We have used two sets of hot-spot tests. In hot-spot send tests, a master node keeps sending messages to a number of differ-ent slave nodes. In hot-spot receive tests, the master node receives messages from all the slave nodes. We vary the number of slave nodes. Figures 13 and 14 show the hot spot performance results. We can see that Elan scales very good when the number of slaves increases. On the other handle, VAPI and GM do not scale very well.
3.7
Impact of PCI and PCI-X Bus on VAPI
In previous comparisons, our InfiniHost HCAs use PCI-X 133 MHz interface. To see how much impact the PCI-PCI-X interface has on the communication performance of Infini-Band, we have forced the InfiniHost HCAs to use PCI inter-face running at 66 MHz. We have found that with PCI, there is a slight performance degradation for small messages. For large messages, the bandwidth performance drops due to the limited bandwidth of PCI bus. The details can be found in [9].4
Related Work
LogP [6] and its extension LogGP [1] are the methodolo-gies which are often used to extract performance parameters
in conventional communication layers. In addition to the performance parameters shown in the LogGP model, our study explores performance impact of other advanced fea-tures that are present in the interconnects under study.
Studies on the performance of communication layers on the Myrinet network and the Quadrics network have been carried out in the literature [2, 14, 13]. Our previous work [3] devises a test suite and uses it to compare perfor-mance for several VIA[7] implementations. In this paper, we extend the work by adding several important scenarios which have strong application implication and apply them to a wider range of communication layers and networks. Bellet al[4] evaluate performance of communication layers for several parallel computing systems and networks. How-ever, their evaluation is based on the LogGP model and they have used different testbeds for different interconnects.
5
Conclusions
In this paper, we have used a set of micro-benchmarks to evaluate three high performance cluster interconnects: In-finiBand, Myrinet and Quadrics. We provide a detailed per-formance evaluation for their communication perper-formance by using a set of micro-benchmarks. We show that in or-der to get more insights into the performance characteristics of these interconnects, it is important to go beyond simple tests such as latency and bandwidth. Specifically, we need to consider the performance impact of certain features such as remote memory access, completion notification and ad-dress translation mechanisms in the network interface.
References
[1] A. Alexandrov, M. F. Ionescu, K. E. Schauser, and C. Scheiman. LogGP: Incorporating long messages into the LogP model for parallel computation. Journal of Parallel and Distributed Computing, 44(1):71–79, 1997.
[2] S. Araki, A. Bilas, C. Dubnicki, J. Edler, K. Konishi, and J. Philbin. User-space communication: A quantitative study. InSC98: High Performance Networking and Computing, November 1998.
[3] M. Banikazemi, J. Liu, S. Kutlug, A. Ramakrishna, P. Sa-dayappan, H. Shah, and D. K. Panda. VIBe: A Micro-benchmark Suite for Evaluating Virtual Interface Architec-ture (VIA) Implementations. InIPDPS, April 2001. [4] C. Bell, D. Bonachea, Y. Cote, J. Duell, P. Hargrove, P.
Hus-bands, C. Iancu, M. Welcome, and K. Yelick. An evaluation of current high-performance networks. InInternational Par-allel and Distributed Processing Symposium (IPDPS’03), April 2003.
[5] B. Chandrasekaran, P. Wyckoff, and D. K. Panda. MIBA: A Micro-benchmark Suite for Evaluating InfiniBand Ar-chitecture Implementations. InPerformance TOOLS 2003, September 2003.
[6] D. E. Culler, R. M. Karp, D. A. Patterson, A. Sahay, K. E. Schauser, E. Santos, R. Subramonian, and T. von Eicken. Logp: Towards a realistic model of parallel computation. In
0 5 10 15 20 25 30 35 4 16 64 256 1K 4K Time (us)
Message Size (Bytes) VAPI S/R VAPI RDMA GM S/R GM RDMA Elan RDMA Figure 1. Latency 0 100 200 300 400 500 600 700 800 900 4 16 64 256 1K 4K 16K 64K 256K 1M Bandwidth (MB/s)
Message Size (Bytes) VAPI S/R VAPI RDMA GM S/R GM RDMA Elan Figure 2. Bandwidth
Principles Practice of Parallel Programming, pages 1–12, 1993.
[7] D. Dunning, G. Regnier, G. McAlpine, D. Cameron, B. Shu-bert, F. Berry, A. Merritt, E. Gronke, and C. Dodd. The Virtual Interface Architecture. IEEE Micro, pages 66–76, March/April 1998.
[8] InfiniBand Trade Association. InfiniBand Architecture Specification, Release 1.0, October 24 2000.
[9] J. Liu, B. Chandrasekaran, W. Yu, J. Wu, D. Buntinas, S. Kini, P. Wyckoff, and D. K. Panda. Micro-Benchmark Level Performance Comparison of High-Speed Cluster In-terconnects. Technical Report, OSU-CISRC-5/03-TR30, Computer and Information Science department, The Ohio State University, April 2003.
[10] Mellanox Technologies. Mellanox InfiniBand InfiniHost Adapters. http://www.mellanox.com.
[11] Myricom, Inc. Myrinet. http://www.myri.com.
[12] N.J. Boden, D. Cohen, R.E. Felderman, A.E. Kulawik, C.L. Seitz, J.N. Seizovic, and W. Su. Myrinet: A Gigabit-per-second Local Area Network. IEEE Micro, 15(1):29–36, February 1995.
[13] F. Petrini, W. Feng, A. Hoisie, S. Coll, and E. Frachtenberg. The Quadrics Network: High-Performance Clustering Tech-nology.IEEE Micro, 22(1):46–57, 2002.
[14] F. Petrini, A. Hoisie, W. chun Feng, and R. Graham. Perfor-mance Evaluation of the Quadrics Interconnection Network. In Workshop on Communication Architecture for Clusters 2001 (CAC ’01), April 2001.
[15] Quadrics, Ltd. QSNET. http://www.quadrics.com.
0 100 200 300 400 500 600 700 800 900 4 16 64 256 1K 4K 16K 64K 256K 1M Bandwidth (MB/s)
Message Size (Bytes) VAPI Q = 8 VAPI Q = 16 GM Q = 8 GM Q = 16 Elan Q = 8 Elan Q = 16
Figure 3. Bandwidth with Queue Size
0 10 20 30 40 50 60 70 4 16 64 256 1K 4K Time (us)
Message Size (Bytes) VAPI S/R
VAPI RDMA GM S/R GM RDMA Elan
Figure 4. Bi-Directional Latency
0 100 200 300 400 500 600 700 800 900 1000 4 16 64 256 1K 4K 16K 64K256K 1M Bandwidth (MB/s)
Message Size (Bytes) VAPI S/R
VAPI RDMA GM S/R GM RDMA Elan
Figure 5. Bi-Directional Bandwidth
0 0.5 1 1.5 2 2.5 4 16 64 256 1K 4K 16K 64K256K 1M Time (us)
Message Size (Bytes) VAPI
GM Elan
0 200 400 600 800 1000 90 92 94 96 98 100 Bi-directional bandwidth MBps
Percentage of CPU allocated for other computation VAPI
GM Elan
Figure 7. CPU Utilization in Bandwidth Test
0 2 4 6 8 10 4 16 64 256 1K 4K Time (us)
Message Size (Bytes) VAPI
GM Elan
Figure 8. Overhead due to Completion
8 10 12 14 16 18 20 22 4 16 64 256 1K 4K Time (us)
Message Size (Bytes) VAPI
GM Elan
Figure 9. Overhead due to Blocking
200 300 400 500 600 700 800 900 5 10 15 20 25 Bandwidth MBps Number of buffers VAPI GM Elan
Figure 10. Bandwidth (size=512K) Buffer Scheme 1 10 15 20 25 30 35 40 45 50 55 60 0 20 40 60 80 100 Time (us)
Percentage of buffer reuse VAPI
GM Elan
Figure 11. Latency (size=4K) Buffer Scheme 2
0 100 200 300 400 500 600 700 800 900 0 20 40 60 80 100 Bandwidth MBps
Percentage of buffer reuse VAPI
GM Elan
Figure 12. Bandwidth (size=512K) Buffer Scheme 2 0 5 10 15 20 25 30 1 2 3 4 5 6 7 Time (us) Number of Clients VAPI GM Elan
Figure 13. Hot Spot Test Send
0 5 10 15 20 25 30 35 1 2 3 4 5 6 7 Time (us) Number of Clients VAPI GM Elan