Proposed Performance-Based Seismic Design Method for
Assessing Vulnerability and Fragility of RC Buildings
Aung Mon
*, Dr. Nang Su Le′ Mya Thwin
***
Department of Civil Engineering, Mandalay Technological University, The Republic of the Union of Myanmar
**
Professor in Department of Civil Engineering, Mandalay Technological University, The Republic of the Union of Myanmar
Abstract- The objective of this study is to develop a simplified
seismic performance based design method which reduce the repetition cycles of nonlinear process. The peak ground accelerations are estimated using earthquake data along the Sagaing Fault for Mandalay city in Myanmar. The evaluated yield accelerations of twenty case studies of the seismic force resisting systems that complying with the performance objectives are documented as a data bank based on the current analysis and design procedure. Then, they are converted to a proposed yield acceleration equation using second-order polynomial regression. This method is also verified by the total of four buildings based on different number of stories. By introducing, this proposed yield acceleration at the initial stage of analysis and design as a simplified method, some repetitions of the nonlinear process can be reduced. Fragility curves are developed for performance based buildings on different peak ground accelerations and their damage probability is compared. The vulnerability of the buildings is estimated in terms of vulnerability index to assess the performance of the building.
Index Terms- A Simplified Performance-Based Seismic Design,
Yield Acceleration, Second Order Polynomial Regression, Fragility curves, Vulnerability Index
I. INTRODUCTION
erformance Based Seismic Design (PBSD) has been considered as an essential part of earthquake engineering. New developments and methods for the application of PBSD methodology are needed because most existing PBSD approaches tend to provide guidance and tools for the evaluation of seismic performance of a building that has already been designed [8]. In other words, more research work is needed for development of initial design because there is no guideline provided in current PBSD practice [6]. Several approaches mainly provide a suitable design base shear that accounts for higher mode effects, system over strength, yield displacement, effective stiffness, viscous damping, effective period, or displacement ductility. Additionally, iteration during the design process is still required. Thus, practical methods based on these approaches are still under development and improvement [5]. Losses inflicted on modern buildings from recent earthquakes have shown the pressing need for investigation of the seismic safety of code-compliant buildings at various performance limit states. This need has stimulated significant research to develop methodologies for deriving fragility relationships, which are a key component in seismic loss assessment. The seismic vulnerability of a structure can be described as its susceptibility
to damage byground shaking of a given intensity. The methodologies are used to develop various tools such as vulnerability functions and fragility curves, from structural damages observed during earthquakes
.
II. METHODOLOGY AND MODEL DEVELOPMENT
A. Seismic Hazard Analysis for Mandalay City Area
In considering earthquake hazard environment of Mandalay City, the probability of exceedance in 50 years is 50% for the operational earthquake level (MOE), 10% for the design basic level earthquake (DBE) and 2% for the maximum considered earthquake level (MCE) [4].
/n 1 p) (1 1 1 T
where, p = Probability of exceedance in 50years T= Return period
n=50 years
Magnitude probability for Guntenberg-Richter law of Equation as follows [1].
) M M ( b ) M M ( b M min max min 10 1 10 1 ) m (
F
Where Mmax the maximum and Mmin the minimum
earthquakes.
P(M=mj)=FM (mj+1)- FM(mj) (3)
Where mj are the discrete set of magnitudes, ordered so that
mj<mj+1.
Estimation of peak ground acceleration is based on earthquake data from the Sagain Fault [2].
Ln (PGA) = -0.152+0.859Mw-1.803ln(R+25) (4) where, PGA = Peak ground acceleration
Mw = Moment magnitude R = Source Distance
TABLE I
ESTIMATE SEISMIC HAZARD ANALYSIS
Earthquake Type SE DBE MCE
Return Period 72 475 2475
Moment magnitude 6.5 7.325 7.875
Acceleration at the base
rock (g) 0.166 0.331 0.508
Amplification (Cg) 1.2 1.2 1.2
Acceleration at the 0.2 0.4 0.6
P
ground surface (g)
B.Performance Criteria
TABLE II PERFORMANCE CRITERIA [3]
Seismic Hazard Level
Performance
Level Probability/year Critical Limit
SE IO 50%/50yr 1%
DBE LS 10%/50yr 2%
MCE CP 2%/50yr 4%
C. Description of General Design Process
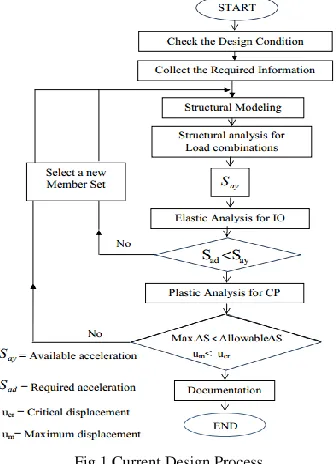
[image:2.612.35.301.58.193.2]This flow chart shows that the key steps in the performance based design process. It is an iterative process that begins with the selection of structural members, followed by the development of a preliminary design, an assessment as to whether or not the design meets the performance objectives, and finally redesign and reassessment, if required, until the desired performance level is achieved [7].
Fig.1 Current Design Process
D.Case Study for Building Configurations
The present research is a study of nonlinear behaviors of irregular concrete framed buildings which are divided into four groups based on bay spans and length to width ratios. Each group consists of five case studies and total of twenty case studies are considered.The dimensions of buildings for case studies included are shown in Table III.
TABLE III
BUILDINGS CONFIGURATIONS OF CASE STUDIES
Case L/B L (ft) B (ft) H (ft) No of Storey
1 1.25 100 80 11 3,5,7.9,12
2 1.5 120 80 11 3,5,7,9,12
3 1.75 140 80 11 3,5,7,9,12
4 2 160 80 11 3,5,7,9,12
E.Performance Based Seismic Design Of RC Buildings
[image:2.612.313.573.58.101.2]The reinforced concrete buidings are designed as on performance based seismic design procedure. Analytical results such as hinge formation maximum considered earthquake are shown from Fig. 2.
Fig. 2 Summary of Case Studies
F.Evaluated Yield Acceleration, Say
The Evaluated Say for Four Group based on performance based
seismic design of RC building. The minimum requirements of Say
for Immediate Occupancy are shown in Table IV.
TABLE IV SUMMARY OF EVALUATED,SAY
No. of Storey 3 5 7 9 12
T 0.413 0.606 0.78 0.942 1.168
Say for Group 1 0.672 0.475 0.431 0.348 0.283
Say for Group 2 0.67 0.467 0.384 0.339 0.272
Say for Group 3 0.658 0.461 0.375 0.332 0.251
Say for Group 4 0.656 0.457 0.373 0.323 0.249
Average Say 0.664 0.465 0.391 0.334 0.263
Standard deviation x10-3 8.16 7.83 27 10 16
The average Say and time period T are considered as a proposed
yield acceleration for the proposed design method.
[image:2.612.315.572.179.402.2] [image:2.612.83.251.313.545.2]In this study, the SayTare indicated in term of the fundamental
periods of buildings. Equations are derived using second-order polynomial regression based on the average evaluated yield acceleration. The second-order polynomial regression is shown in Equation 5.
SayT = a0+a1T+a2T2 (5) where, SayT= proposed yield acceleration
T = fundamental period a0, a1, and a2 = coefficients
The coefficients can be determined by using the following set of equations.
n i i ayT i n i i n i i n i i i ayT n i i n i i n i i n i i n i i ayT n i i n i i S T a T a T a T S T a T a T a T S a T a T a n 1 2 1 2 4 1 1 3 0 1 2 1 1 2 3 1 1 2 0 1 1 1 2 2 1 1 0 ) ( ) ( ) ( ) ( ) ( ) ( ) ( ) ( ) ( [image:3.612.339.524.123.398.2]where, n= number of set of data
Fig. 3 Proposed SayT in Term of T
Proposed SayT for proposed performance-based seismic design method
Evaluated Say by using performance-based seismic design data bank
H.The Proposed Yield Acceleration Equation with SF≥ 1
In this approach, the proposed equation is determined by using on yield accelerations based on the minimum safety factor of 1.0 for IO level. The proposed yield acceleration is shown in equation 6.
SayT=1.135-1.406T-0.571T2(6)
I. Computation of an Error Analysis
The computation of an error analysis is for the proposed yield acceleration. The correlation coefficient is usually used to check whether the proposed yield acceleration is excellent fit or not for the proposed performance-based seismic design method for reinforced concrete buildings.
R =Sxy/ (Sxx0.5 x Syy0.5) (7)
where R = the correlation coefficient
The correlation coefficient R=0.956 indicate that the proposed yield acceleration is excellent fit.
J.The Proposed Simplified Seismic Design Method
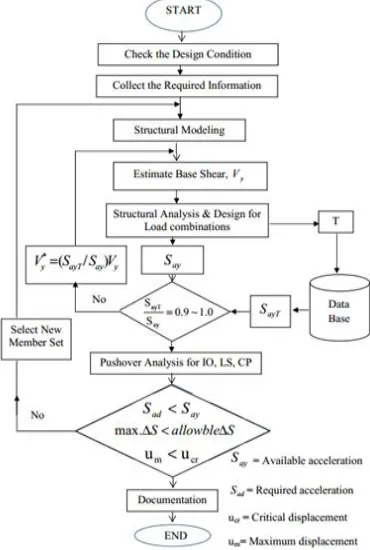
A proposed simplified seismic design method using SayT is
shown in Figure 4. The SayTfrom the proposed Equation 6 is used
in this method.
Fig.4 The Proposed Simplified Seismic Design Method
K. Algorithm of Proposed Seismic Method
1. Checking of design condition and obtaining the design requirement are required. Then, the structural model is developed.
2. Estimation of the base shear using R factor according to the UBC-97 and analysing of the model are included. Then the member design is done based on moment, shear, and axial force from the analysis and the Sayis calculated. The required data for
this equation can be obtained from the analysis.
3. Checking of the Say with the SayT from the proposed Equation
6 is required. If they are not nearly equal, go to the step-2 to determine new structural member set by adjusting R factor for the based shear. Then calculation of SayT and comparison with
the SayTis done until they are almost equal.
4. The pushover analysis was done to check the three limit states such as IO, LS, and CP.
5. To check the IO level, the minimum required Sad from the
performance point at under SE is obtained and with the evaluated Say calculated from the step-3 is compared. To check the LS and
CP levels, the story drifts are calculated using the structural deformations under DBE and MCE. Then, they are compared with the maximum drift limitations. If one of the three limit states check is not acceptable, it is required to repeat the step-4 by increasing stiffness to upgrade yield acceleration until they are acceptable. S ay n S ayi S yy S ay T n S ayi T i S sy T n T
S xx i
[image:3.612.39.272.194.410.2]L. Range of Applicability
1.Special concrete moment resisting frame with fundamental period 0.413≤ T ≤1.168 seconds.
2. Irregular structure located in seismic zone 4. 3. The L/B ratio must be between 1.25 to 2.
III. VERIFICATION
The four verification examples are considered according to various number of stories and plans.
A.Verification for Different Numbers of Storey
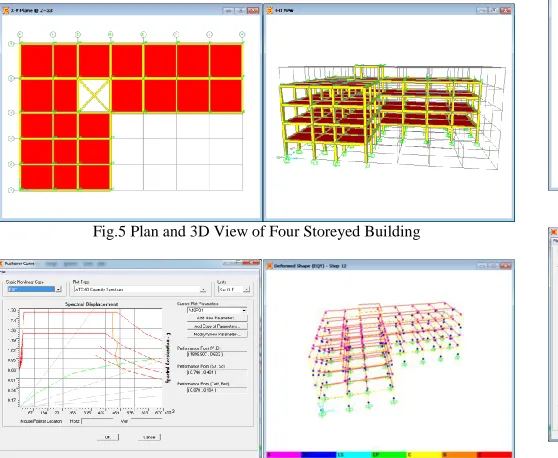
The geometries of the selected buildings are shown from Figure 5, 7, 9 and 11. Analytical results such as hinge formation,performance point at the maximum considered earthquake are shown from Figure 6, 8, 10 and 12.
[image:4.612.314.568.57.165.2]Verification Example 1, (135’x85’x55’), L/B=1.59
Fig.5 Plan and 3D View of Four Storeyed Building
Fig. 6 ATC-40 Capacity Spectrum Curve and Hinge formation for MCE This spectrum curve points out the performance point at Life Safety level, the spectral acceleration 0.746g and spectral displacement 5.532in. It is occurred between step 12 and 13.
[image:4.612.310.573.237.486.2]Verification Example 2, (114’x72’x77’), L/B=1.58
Fig.7 Plan and 3D View of Six Storeyed Building
Fig.8 ATC-40 Capacity Spectrum Curve and Hinge formation for MCE This spectrum curve points out the performance point at Life Safety level, the spectral acceleration 0.588g and spectral displacement 7.992in. It is occurred between step 12 and 13.
Verification Example 3, (115’x70’x99’), L/B=1.64
[image:4.612.36.576.237.494.2]Fig.9 Plan and 3D View of Eight Storeyed Building
Fig.10 ATC-40 Capacity Spectrum Curve and Hinge formation for MCE This spectrum curve points out the performance point at Life Safety level, the spectral acceleration 0.365g and spectral displacement 12.3in. It is occurred between step 11 and 12.
[image:4.612.39.318.259.488.2]Verification Example 4, (114’x87’x121’), L/B=1.31
[image:4.612.37.305.563.675.2] [image:4.612.43.573.565.675.2]Fig.12 ATC-40 Capacity Spectrum Curve and Hinge formation for MCE The performance level of structure in Maximum Considered Earthquake is shown in Fig. 12.This spectrum curve points out the performance point at Life Safety level, the spectral acceleration 0.344g and spectral displacement 12.564in. It is occurred between step 12 and 13.
B.Summary of Analytical Results for Different Number of Storey
The evaluated Say based on the analytical results of each case
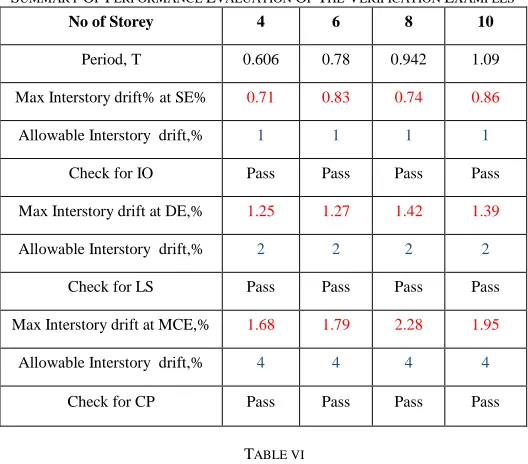
study are shown in Tables V. The minimum requirements of for IO and maximum interstory drift limitations for LS and CP are also checked.
TABLE V
SUMMARY OF PERFORMANCE EVALUATION OF THE VERIFICATION EXAMPLES
No of Storey 4 6 8 10
Period, T 0.606 0.78 0.942 1.09 Max Interstory drift% at SE% 0.71 0.83 0.74 0.86 Allowable Interstory drift,% 1 1 1 1
Check for IO Pass Pass Pass Pass Max Interstory drift at DE,% 1.25 1.27 1.42 1.39 Allowable Interstory drift,% 2 2 2 2
Check for LS Pass Pass Pass Pass Max Interstory drift at MCE,% 1.68 1.79 2.28 1.95 Allowable Interstory drift,% 4 4 4 4
Check for CP Pass Pass Pass Pass
TABLE VI
COMPARISON OF YIELD ACCELERATION FOR DIFFERENT NUMBERS OF STOREY
No. of Story 4 6 8 10
Period, T 0.606 0.78 0.942 1.094
Proposed Say 0.492 0.385 0.317 0.28
Evaluated Say 0.512 0.411 0.332 0.295
Proposed Say/Evaluated Say 0.96 0.937 0.955 0.949
The four verification examples for different numbers of storey are selected. They are irregular buildings with L/B ratios
between 1.3 and 1.64.From the results, it is concluded that the Proposed Say/Evaluated Say ratio must be between 0.9 to 1.
C.Comparison of Repetition Cyclesfor Different Numbers of
Storey
As a result, it is found that the number of repetitions required for the analysis and design process to satisfy the three limit states are five times for Four storeyed building, six times for the Six and Eight storeyed buildings, and eight times for Ten storeyed building when the general design procedure is used.
[image:5.612.37.296.58.157.2]However, when the simplified approach is used, the repetitions are decreased to one time for Four, Six and Eight storeyed buildings, and two times for the Ten storeyed building. The comparison of required numbers of repetition for the both methods is shown in Fig. 13.
Fig. 13 Comparison of Repetition Cycles
In summary, the number of repetitions required for the simplified method is less than that of using the general procedure. In addition, L/B ratio is small effect on the proposed method as long as the building is irregular.
D.Seismic Vulnerability Assessment of Verification Examples
The vulnerability index is a measure of the damage in a building obtained from the pushover analysis. It is defined as a scaled linear combination (weighted average) of performance measures of the hinges in the components, and is calculated from the performance levels of the components at the performance point or at the point of termination of the pushover analysis. The vulnerability index of a building is assessed with the expression as follows [9].
Where Nic and Njb are the numbers of hinges in colunmns and
beams, respectively, for the ith and jth performance range. A weightage factor (xi ) is assigned for columns and (xj) is assigned
for beams to each performance range, the weightage factor is shown in Table VII .
VIbldg is a measure of the overall vulnerability of the building.
A high value of VIbldg reflects poor performance of the building.
However, this index may not reflect a soft storey mechanism.
TABLE VII
WEIGHT FACTORS FOR PERFORMANCERANGE
[image:5.612.329.532.237.369.2] [image:5.612.36.300.345.577.2]Serial Number Performance Range Weight Factor
1 O 0.125
2 IO 0.375
3 LS 0.625
4 CP 0.875
5 C 1.000
A storey vulnerability index (VI storey ) defined to quantify the
possibility of a soft/weak storey with the formation of flexural hinges. For each storey, VI storey is defined as
A Storey Vulnerability Index based on Maximum Considered Earthquake (Verification Example I)
From theresults, it is found that, the storey 3 are more vulnerable than other storey.The value of storey vulnerability index are different due to their configurations.
A Storey Vulnerability Index based on Maximum Considered Earthquake(Verification Example II)
From this table it is apparent that, storey 5 are more vulnerable than other storey.
A Storey Vulnerability Index based on Maximum Considered Earthquake(Verification Example III)
The storey vulnerability index of zero indicate that most of the hinges are formed in beams rather than in columns.
A Storey Vulnerability Index based on Maximum Considered Earthquake(Verification Example IV)
From this table, the storey vulnerability index of zero indicate that most of the hinges are formed in beams rather than in columns.These are strong column and weak beam design.
TABLE VIII
VULNERABILITY INDEX FOR STRUCTURAL SYSTEM
Building Vulnerability Index
4-stoery 0.36
6-storey 0.356
8-storey 0.313
10-storey 0.334
VIbldg is a measure of the overall vulnerability of the building. A
high value of VIbldg reflects poor performance of the
building.From this table it is apparent that,The buildings (Verification Examples III and IV)are more resistant than Verification Examples I and II under DBE and MCE.
E.Seismic Fragility Analysis of Verification Examples
Fragility curves describe the probability of damage to building. Building fragility curves are lognormal functions that describe the probability of reaching, or exceeding, structural and non-structural damage states, given median estimates of spectral response, for example spectral displacement. These curves take into account the variability anduncertainty associated with capacity curve properties, damage states and ground shaking.
Evaluation of Structural Fragilities [10]
P[ds/Sa] = φ[(1/βas) ln(Sa/Sa,ds)](10) Where,
P[ds/Sa] = damage probability value, ds
Sa,ds=Median value of spectral acceleration at which the
building reaches the threshold of damage state, ds βds= Standard deviation of the natural logarithm of
spectral acceleration for damage state, ds
Φ = Standard normal cumulative distribution function. Sa = Given peak spectral acceleration
Fragility Curve for Verification Example I
If the spectral acceleration 0.746g (PGA =0.6g) corresponding to a return period of 2475 years, the probabilities of slight, moderate and severe damage to the Verification Example I is 97%, 77% and 45% respectively.
Fragility Curve for Verification Example II
If the spectral acceleration 0.588g (PGA =0.6g) corresponding to a return period of 2475 years, the probabilities of slight, moderate and severe damage to the Verification Example II is 98%, 89% and 36% respectively.
Fragility Curve for Verification Example III
If the spectral acceleration 0.366g (PGA =0.6g) corresponding to a return period of 2475 years, the probabilities of slight, moderate and severe damage to the Verification Example III is 98%, 91% and 22% respectively.
Fragility Curve for Verification Example IV
If the spectral acceleration 0.352g (PGA =0.6g) corresponding to a return period of 2475 years, the probabilities of slight, moderate and severe damage to the Verification Example IV is 99%, 85% and 30% respectively. This table shows the probability of damage for SE(0.2g), DBE(0.4g) and MCE(0.6g).
IV. CONCLUSIONS
In this study, the proposed yield acceleration SayT or Vythat
satisfy the basic safety objectives including acceptable story drift limits for LS, CP and minimum required Say for IO. Therefore,
the yield acceleration Sayis evaluated for concrete moment frames
based on the total of twenty case studies. The yield acceleration, Say decreases substantially with increased building height. The
proposed simplified seismic performance based design method is developed by using evaluated yield acceleration, SayT. The
repetition cycles of nonlinear analysis and design process can be reduced by using the proposed method.
A storey vulnerability index of zero indicates that most of the hinges are formed in beams rather than in columns. These are strong column and weak beam design.The yield mechanisms adopted in earthquake resistant design are strong column and weak beam. These buildings (Verification Examples III and IV)are more resistant than Verification Examples I and II under DBE and MCE.
The Fragility Curve are plotted considering Spectral Acceleration as a ground motion parameter.Fragility curves were developed for performance based seismic design of RC buildings and compared their damage states.It is observed that verification example III is seismically more resistant than other verification examples for severe damage states.
ACKNOWLEDGMENT
I would like to express heartfelt gratitude to Dr.Nilar Aye Professor and Head of Civil Engineering Department and all of my teachers at Mandalay Technological University for their encouragement and suggestions.
REFERENCES
[1] Baker, J.W. 2008. “An Introduction to Probabilistic Seismic Hazard Analysis (PSHA)”. US Nuclear Regulatory Commission.
[3] SEAOC Vision 2000 Committee (1995). “Performance Based Seismic Engineering of RC Building, Part 2: Conceptual framework.” Structural Engineers Association of California, Sacramento, Calfornia.
[4] ATC (1996), “Seismic Evaluation and Retrofit of Concrete Buildings”, ATC-40 Report, Applied Technology Council, Redwood City, California, USA.
[5] Dr. Rehan A. Khan, “Performance Based Design of RC Building”, Journal Forum (IJIRSET) Vol. 3 Issue 6, June 2014
[6] Rohit Bansal, “Pushover Analysis of of Reinforced Concrete Frame”, M.E dissertation. India: Thapar university; july 2011.
[7] ATC, 2006, “Next-Generation Performance-Based Seismic Design Guidelines: Program Plan for New and Existing Buildings”, FEMA 445,Federal Emergency Management Agency, Washington, D.C.
[8] Computers and Structures SAP2000,“Three Dimensional Static and Dynamic Finite Element Analysis and Design of Structures”.
[9] A.Cinitha.A,,“Nonlinear Static Analysis to assess Seismic Performance and Vulnerability Code-Conforming RC Building”.
[10] Marco,,“Fragility Curves of Existing RC Buildings Based on Specific Structural Performance Levels”,SciRes,June,2014.
AUTHORS
First Author – Aung Mon, Ph.D. candidate, Mandalay
Technological University, Myanmar, [email protected].
Second Author – Dr.Nang Su Le′ MyaThwin,Professor,