http://www.scirp.org/journal/ojapps ISSN Online: 2165-3925 ISSN Print: 2165-3917
An Evaluation of Abidjan Container Terminal
Competitive Position in West Africa Using a Fuzzy
Quantified SWOT Framework
China Flora Carine Anguibi
1, Veronique Nguele Balla
2, Brou Mathias Allate
11School of Economics and Management, Shanghai Maritime University, Shanghai, China 2Scientific Research Academy, Shanghai Maritime University, Shanghai, China
Abstract
This article proposes a quantified SWOT framework which integrates fuzzy linguistic preference relation to evaluate the competitive position of Abidjan container terminal in West Africa. The integration of fuzzy linguistic preference relation in the quantified SWOT framework circumvents the difficulties in terms of data collection and consis-tency of judgment matrices prevailing in the conventional AHP and Fuzzy AHP. Moreover, the study provides relevant evidences about the key internal and external attributes shipping lines considered as important and hence the attributes that ports/ terminals most need to enhance in order to improve their attractiveness and be well positioned in the market. On the other hand, the change in terminals competitive posi-tion between 2010 and 2013 highlights that the difficulties of West African ports in at-tracting customers in the sub-region are not only related to internal problems such as inadequate infrastructures, facilities or inefficiency, but significant political and eco-nomic constraint outside the ports constraints their competitiveness.
Keywords
Port Competitiveness, Fuzzy Linguistic Preference Relation, SWOT, Port Selection Criterial, African Port
1. Introduction
Containerization and the ever-increasing size of ships have facilitated the movement and increased the volume of goods transported worldwide but also put more pressures on port authorities limited in their ability to expand easily and fast their infrastructures. Shipping companies looking for economies of scale, tend to concentrate on a limited
How to cite this paper: Anguibi, C.F.C., Balla, V.N. and Allate, B.M. (2016) An Evaluation of Abidjan Container Termi- nal Competitive Position in West Africa Using a Fuzzy Quantified SWOT
Frame-work. Open Journal of Applied Sciences,
6, 648-666.
http://dx.doi.org/10.4236/ojapps.2016.69062
Received: August 17, 2016 Accepted: September 20, 2016 Published: September 23, 2016
Copyright © 2016 by authors and Scientific Research Publishing Inc. This work is licensed under the Creative Commons Attribution International License (CC BY 4.0).
http://creativecommons.org/licenses/by/4.0/
number of ports capable of offering competitive services [1]. Hence, in order to avoid being marginalized in the business environment or lose their market shares, ports whether located in the developed or undeveloped countries, are forces to adopt meas-ure aiming to enhance their operational efficiency, reduce the cost of their operation or upgrade their facilities. In the context of this competitive business environment, major coastal countries in West Africa, namely, Cote d’Ivoire, Ghana, Senegal, Nigeria, Benin, and Togo, have implemented some reforms aiming to build or upgrade their container terminal infrastructures and improve management practices in order to supply efficient services and promote the integration of the sub-region into the global market. With the rise of port development in the region, intense pressures in terms of competitiveness have been put on terminals and ports, especially Abidjan, one of the first and leading container terminals.
Abidjan, recovering from a decade of political crisis in Cote D’Ivoire, ended in 2011, faces greater challenges in terms of attractiveness that is keeping its existing customers and attracting new customers. The port suffers from the lack of terminal infrastructures and operations, fragile political environment and limited performance affecting import and export competitiveness. Moreover, the container terminal faces constant risk of losing its customers not just because of the factors mentioned, but also because of the changing and various requirements of customers. Accordingly, in this complex and competitive environment, making the right strategic decision aiming to serve the inter-est of their clients is essential for Abidjan to succeed in Winter-est African maritime market. Furthermore, in order to develop or maintain a superior position in the market over its competitors, the container terminal should understand the factors affecting its main customers’ decision that is shipping lines decision to call at a specific port. It is worth mentioning that shipping lines make port selection decisions by considering port in-ternal and exin-ternal environmental factors [2]. A misunderstanding of these factors can lead the container terminal to a waste of resources and failure.
strate-gies in Foreign Exchange market in Iran, proposed a hybrid method combining SWOT and SEM (structural equation Modelling) method. The Analytic hierarchy process (AHP) technique developed by [6] has been integrated to SWOT analysis to assess the weight of the SWOT factors [7]. Nevertheless, unlike the conventional SWOT and the others hybrid method based on SWOT, the quantified method proposed by researchers [5], rather than just providing an analytical mean to either determine the weight of the factors or prioritize factors or strategies for organization, offers a framework to carry out SWOT comparison on several enterprises simultaneously. The authors developed a hybrid AHP SWOT method based on the grand strategy matrix (GSM) model, to assess the competitive position of container ports in East Asia. The analytical technique not only offers a framework to identify the competitive position of firms but also provides a reference for formulating strategies in accordance with the GSM model [8]. In other terms, using the quantified method, the competitive position of the organizations eva-luated can be identified and serve as a basis to formulate strategies. This method has been applied by others researchers in maritime sector and in software industry, demon-strating the applicability and the usefulness of the model in strategy formulation in the competitive environment. For instance, scholars [8] employed the quantified metho-dology but integrated Fuzzy AHP to SWOT analysis instead of using the conventional AHP, to assess the competitive environment of international distribution centers in Pa-cific-Asian region. In the same vein, the quantified SWOT integrating fuzzy AHP was used by [9] to assess the competitive strength of software companies in China. The au-thors have indicated that integrating fuzzy theory in the conventional AHP when using the quantified SWOT approach contributes to reduce the fuzziness existing in many decision making problems.
2. Review of Factors Affecting Port Selection
3. Port Environmental Condition
There are various factors affecting port choice decision and thus port competitiveness. These factors can be categorized in two main groups, which are factors related to in-ternal environment and factors from the exin-ternal environment. The inin-ternal environ-ment of port includes factors within port and under its control while the external envi-ronment encompasses factors related to competitors, suppliers, political conditions, and government regulations which are not controllable by the ports. The internal envi-ronment factors include resources and capabilities affecting port competitive position. The key challenges for ports in order to be competitive, is to develop effective facilities, supply reliable services at the competitive price, and achieve efficient productivity level. Accordingly, the internal resources can be related to port infrastructures and condi-tions of its facilities and equipment. Port infrastructures can be related to yard and warehouse potential capacity storage as well as berth capacity to accommodate different size of vessels. Regarding the facilities and equipment, availability and quality of han-dling equipment are considered by shipping lines in their decision to select a particular port. Besides, port capabilities refer to port security, information systems, service qual-ity and efficiency. Efficiency can be reflected in ship turnaround time, crane productiv-ity, dwell time and the volume of container handled revealing the current status of port in terms of handling ability but also its development potential. Moreover, service quali-ty is associated with customers’ satisfaction level. This implies that a shipping line will select the port meeting it expectation with regards to the level of service offer.
On the other side, the external factors influencing port competitiveness can be re-lated to the locational advantage of port, political environment of port region and so-cio-economic development of port’s hinterland and government policies and regula-tions regarding custom service. The locational advantage of port includes the proximity to hinterland and significance in the international shipping network. As pointed by [24], the higher the integration of port in the global shipping network, the higher its reputation in the industry which may increase its attractiveness and thus contribute to enhance its competitiveness. Moreover, in light to the weaknesses of the intermodal transportation in Africa due to poor conditions of road and rail transportation, the closer the port is to the hinterland, the higher is its attractiveness. A stable political en-vironment of port region is one of the main factors affecting shipping line decision in choosing a port in West Africa [22]. Therefore, it influences on port competitiveness cannot be neglected. The efficiency of custom service in ports reflects in a great extent the policies and regulation adopted by the different government and may influence port performance. Furthermore, within a particular range, ports activities are influencing primary by the economy conditions and policies of port host country which include economic performance and trade liberalization.
4. Research Methods
4.1. Fuzzy Linguistics Preference Relation Framework
follows:
A fuzzy preference relation P on a set of alternatives X =
{
x x1, 2,,xn}
is a fuzzy set on the product set X×X with membership function P X: × →X[ ]
0,1 . Thepre-ference relation is characterized by the n n× matrix P= pij , where pij =
(
x xi, j)
for all i j, ∈{
1,,n}
. For pij defined as the degree of preference of xi over xj, if0.5
ij
p = , it shows that no difference exists between xi and xj and pij =1 means
that xi is absolutely preferred to xj, and pij >0.5 implies that xi is preferred to j
x . In this case, the preference matrix P is assumed to be an additive reciprocal that is
1
ij ji
p +p = for all i j, ∈
{
1, 2,,n}
. Due to the fact that, the consistency fuzzy relationdefined above use crisp value in the fuzzy preference relation matrices and thus does not capture the fuzziness in human evaluation. Researchers [10] developed the fuzzy linguistic preference relation by integrating fuzzy linguistic assessment variables which are quantified by triangular fuzzy numbers (TFNs) in the decision matrices. The same scholars assume that if a given set of alternatives X =
{
x x1, 2,,xn}
associated withthe fuzzy linguistic preference relations matrix
(
l, m, u)
ij ij ij ijP= p = p p p with respect to n evaluation criteria C=
{
c c1, 2,,cn}
verifies the additive reciprocal consistencyproperties, then the following statements must be equivalent.
{
}
{
}
{
}
( )1 ( )(1 2) ( 1)
1 , 1, , ,
1 , 1, , ,
1 , 1, , ,
3 , 2 3 , 2 3 , 2 1 2 l u ij ji m m ij ji u l ij ji
l l u
ij jk ki
m m m
ij jk ki
u u l
ij jk ki
l l l u
ji
i i i i j j
p p i j n
p p i j n
p p i j n
p p p i j k
p p p i j k
p p p i j k
j i
p + p + + p − p i j
+ = ∀ ∈
+ = ∀ ∈
+ = ∀ ∈
+ + = ∀ < <
+ + = ∀ < <
+ + = ∀ < <
− +
+ + + + = ∀ <
( ) ( )( ) ( ) ( ) ( )( ) ( )
1 1 2 1
1 1 2 1
, 1 , 2 1 . 2
m m m m
ji
i i i i j j
u u u l
ji
i i i i j j
j i
p p p p i j
j i
p p p p i j
+ + + −
+ + + −
− +
+ + + + = ∀ <
− +
+ + + + = ∀ <
(1)
The statements presented in (1) are very important in the sense that they are used to construct the judgments matrices. Experts are invited to provide pair wise comparisons for a set of n − 1 preference values. In others terms, they must fill the questionnaire by providing answer for only n − 1 cells of the matrices and the values of the other cells are obtained by applying the statements in (1) in order to obtain an additive reciprocal consistency matrices. After construction of the preference matrices, in order to preserve the reciprocity and additive consistency, scholars [10] suggest to apply the function written below to transform the judgments values in case the pair wise comparisons ma-trices obtained, have values included in the interval
[
−c,1+c]
rather than in the( )
( )
( )
, 1 2
, 1 2
. 1 2
l l
m m
u u
x c
f x
c
x c
f x
c
x c
f x
c + =
+ + =
+ + =
+
(2)
where c is the maximum amount of violation from interval [0, 1] among elements of P~. Determination of Criteria Weight
According to scholars [13], the following steps are adopted to determine the criteria weight.
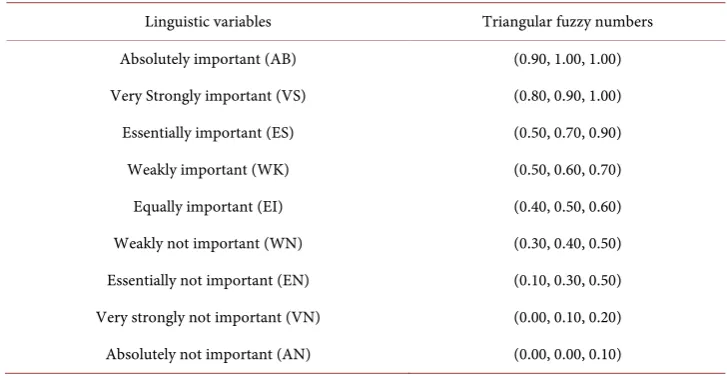
Step1: Construct the pair wise comparison matrices. After building the model hie-rarchy, it is suggested to construct the pair wise comparison matrices for criteria by us-ing the fuzzy lus-inguistic variables. The lus-inguistic variables used in the present study are expressed in triangular fuzzy number and summarized in Table 1.
Step 2: Determine the fuzzy linguistic preference relation decision matrices. As rec-ommended by [10], in case, the pair wise comparisons matrices obtained, have values included in the interval
[
−c,1+c]
rather than in the interval [0, 1], the judgmentsvalues should be transformed by using the transformation function written above to preserve the reciprocity and additive consistency.
Step3: Aggregate the judgment matrices. Based on the work of [12], the individual evaluation of m decision makers are aggregated using the average value method de-scribed below.
(
1 2)
1 m
ij ij ij ij
p p p p
m
= ⊗ ⊗ ⊗ ⊗
[image:7.595.190.554.506.696.2] (3) In order to estimate the criteria weight, scholars [13] propose to use the equation written below.
Table 1. Fuzzy linguistic assessment variables.
Linguistic variables Triangular fuzzy numbers
Absolutely important (AB) (0.90, 1.00, 1.00)
Very Strongly important (VS) (0.80, 0.90, 1.00)
Essentially important (ES) (0.50, 0.70, 0.90)
Weakly important (WK) (0.50, 0.60, 0.70)
Equally important (EI) (0.40, 0.50, 0.60)
Weakly not important (WN) (0.30, 0.40, 0.50)
Essentially not important (EN) (0.10, 0.30, 0.50)
Very strongly not important (VN) (0.00, 0.10, 0.20)
Absolutely not important (AN) (0.00, 0.00, 0.10)
1
,
i i
n
g w
g g
=
⊕ ⊕
(4) where gi is the mean of the comparison values of row i and is computed as follows:
[
1 2]
1
, 1, , .
i i i in
g p p p i n
n
= ⊕ ⊕ ⊕ =
(5)
Finally, the fuzzy weight obtained in Equation (4) is defuzzified using fuzzy mean method presented below:
3
l m u
i i i
i
w w w
w = + + (6)
4.2. Fuzzy Quantified SWOT Framework
It is worth mentioning that since the integrated method has been constructed by intro-ducing the concept of multi-criteria decision making method into SWOT analysis, the technique include therefore the four components of a decision-making process namely criteria, alternatives, performances and weights. Criteria are defined as SWOT factors that are the internal and external factors; alternatives refer to objects compared; per-formances are the values of the objects compared with regards to all the key factors; and finally weights are the relative measurements of criteria. Within the integrated method, the steps of fuzzy linguistic preference relation proposed by [13] are followed to deter-mine the weights of the internal and external criteria. The integrated approach consists of the following steps outlined below:
Step 1: Select alternatives ports in competition.
Step 2: Identify the key criteria of internal and external assessment to be used in the model.
Step 3: Build a hierarchical structure to assess the ports regarding their internal and external criteria and construct the pair wise comparison matrices based on fuzzy lin-guistic preference relations framework.
Step 4: Survey experts to evaluate the weights of key factors. Step 5: Aggregate the individual evaluation of the decision makers. Step 6: Estimate the internal and external criteria weights.
Step 7: Collect performance data.
Step 8: Normalize the performance values. The performance values should be trans-formed into dimensionless units and the criteria compared to each other. According to the same authors, the following normalization formula has been applied:
1) Benefit criteria normalization (the higher the better)
( )
, maxij ij
j ij p
r j
p
= ∀ (7)
2) Cost-criteria normalization (the lower the better)
( )
min
,
ij ij
ij
ij
p
r j
p
3) Moderation criteria normalization (the more moderate the better)
{
}
{
0}
0 10
min , 1 , where max ,
ij n
ij j ij
ij
p p
r p p
n
p p =
= =
∑
(9)where pij and rij respectively denote the non-normalized and normalized
perfor-mance value of the jth alternative of the ith criterion and for rij,0≤ ≤rij 1.
Step 9: Determine the internal and external weighted score I J
R and E J
R of each
port which is computed by using the criteria weight obtained under fuzzy linguistic preference relation and the normalized performance values. The equations are ex-pressed as follows
(
)
1
1
, 1, 2, ,
m
I I I
j i ij
i
R w r j n
=
=
∑
× = (10)(
)
1
1
, 1, 2, ,
m
E E E
j i ij
i
R w r j n
=
=
∑
× = (11) where Ii
w is the weight of the ith internal factor (i=1, 2,,m1) and
E i
w is the
weight of the ith external factor (i=1, 2,,m2).
Step 10: Calculate the internal and external benchmark values to serve as references in the comparison of port internal and external competitive performance. The bench-marks values can be estimated by applying the mean of the alternatives weighted score method or take the benchmarking objective as reference value. The current study adopted the mean method. Accordingly, the internal benchmark values (IB) and exter-nal benchmark value (EB) are calculated based on Equation (12) and Equation (13) re-spectively.
1 2
I I I
n
R R R
IB
n
+ + +
= (12)
1 2
E E E
n
R R R
EB
n
+ + +
= (13) Step 11: Calculate and compare the internal coordinate value (ICj) and the external
coordinate value (ECj) such as:
, 1, 2, , and 1 1
i
j j
IC =R −AI j= n − ≤IC≤ + (14)
, 1, 2, , and 1 1
i
j j
EC =R −AE j= n − ≤EC≤ + (15)
Step 12: Set the ports on the four quadrants in the SWOT-GSM matrix to identify their competitive positions.
At this stage, the sampled ports are placed altogether in the four quadrants of the coordinate according to their internal and external condition with the ordinate refer-ring to the external environment and the abscissa defining the internal environment. The strategies to be proposed in the grand strategy matrix regarding the position in the quadrant are explained in Appendix 1.
4.3. Variables Selection and Data Collection
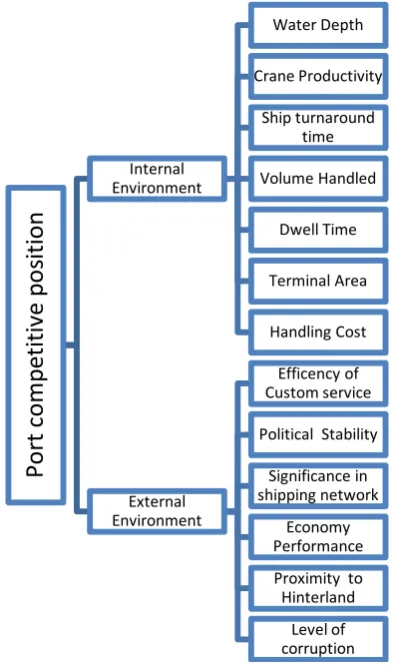
used for the purpose of this study. A survey questionnaire based fuzzy preference lin-guistics relation was constructed to evaluate the weight of the variables selected. The choice of the questionnaire participants was based on non-probability sampling, espe-cially expert sampling. In fact, expert sampling consist of targeting a sample of persons with known or demonstrable experience and expertise in some area [26]. The literature has highlighted the major role played by shipping lines in making the decisions to select a specific port [15]. Moreover, within a shipping company, the decision to select a spe-cific port is made by one or few senior officials, thus in this context, the non-probability sampling is selected. Major shipping lines calling at the ports studied were therefore in-vited to evaluate the relative importance of these factors regarding their decision to se-lect a particular port in the sub-region. Due to the limited performance data availabili-ty, the factors were refined and selected in order to obtain the key attributes affecting shipping lines perception in their decision to choose a port in West Africa. The factors used in the internal evaluation are namely water depth, crane productivity, ship turna-round time, quay length, volume handled, dwell time, terminal area and handling cost while those utilized in the external evaluation are efficiency of custom service, political risk, and significance in the international shipping network, economy performance, proximity to hinterland and level of corruption. Data collection was implemented via google forms. The performances data related to the internal factors were obtained from official websites of the container ports and West and Central Africa port authorities as-sociation over the period 2010 and 2013. The performance data related to external fac-tors are collected from World Development Indicator database for the years 2010 and 2013 respectively, except data related to political risk obtained from [27][28]. The gross domestic product (GDP) is used as a proxy for the economic performance of port host country. Custom efficiency score is used as proxy for the efficiency of custom service to reflect the efficacy of government regulation and policies regarding custom sector. Lin-er shipping connectivity index is used to proxy the significance of port host country in the international shipping network. Country corruption perception index is used as proxy for Level of corruption. A hierarchical structure of the evaluation of port internal and external condition was constructed and described in Figure 1.
5. Empirical Analysis
Considering the purpose of this study, the container terminals were selected with the aim to include those comparable to Abidjan and reflecting best performances in terms of throughput in West Africa sub-region. Accordingly, the sample size is limited to Abidjan container port and its main competitors in West Africa namely Tema, Coto-nou, Lome, Dakar and Lagos. A quantified SWOT approach which integrates Fuzzy lin-guistic preference relations is adopted to assess the competitive position of these ports.
5.1. Evaluation of Criteria Weight
Figure 1. Model hierarchy.
additive and consistent fuzzy pair wise comparison matrices. The additive and consis-tent judgment matrices of all the evaluators were aggregated with respect to internal and external environment using Equation (3). The fuzzy weight criteria and the defuzzi- fied weight are obtained according to Equation (4) and Equation (6) respectively. Ac-cording to [5], It is assumed that the internal and external environment have the same weight in the hierarchy that is one. Considering the internal factors assessment, the re-sults reveal that among all criteria, crane productivity and ship turnaround time fol-lowed by water depth respectively are the most important criteria influencing the per-ception of shipping lines calling at West African port and thus affecting port competi-tiveness in the region. The results can be seen in Table 2.
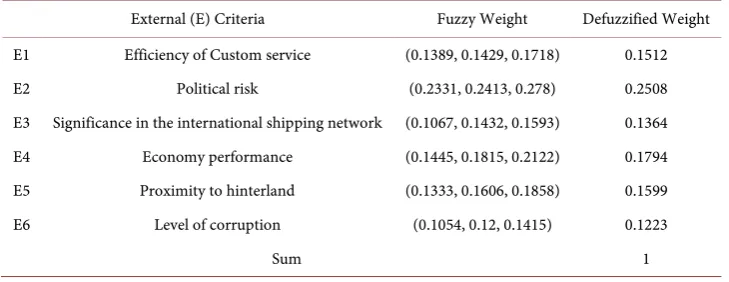
Besides, the internal factors evaluation, the results from the external factors analysis show that port host country political risk greatly affects shipping lines decision in choosing a specific port in West Africa. These results confirm the findings of the em-pirical research conducted by researchers [22] on West African ports attractiveness. Moreover, the respondents highlighted the importance of the region economy perfor-mance as well as port proximity to hinterland. In fact, with the poor conditions of roads network and the few railway dating back to the colonial period in the region, it is ad-vantageous to select port close to the hinterland in order to reduce total cost in terms of
Po
rt c
om
pe
titiv
e
po
sitio
n
Internal Environment
Water Depth
Crane Productivity
Ship turnaround time
Volume Handled
Dwell Time
Terminal Area
Handling Cost
External Environment
Efficency of Custom service
Political Stability
Significance in shipping network
Economy Performance Proximity to Hinterland
time, security and distance. The results can be seen in Table 3.
5.2. Determination of Port Competitive Position
The scales and direction of criteria have been unified by normalizing the performance values for the year 2013. The weighted scores computed can be seen in Table 4. The benchmarks and the coordinates values calculated for each container terminal are summarized in Table 5. It can be seen that Abidjan has the best internal coordinate value of 0.1329, followed by Lagos (0.0272), Dakar (0.0176), Tema (−0.0624), Lome (0.0034) and Cotonou (−0.1186) respectively. This means that Abidjan had a substan-tial internal strength in comparison to its competitors and Cotonou had a critical in-ternal weakness. Considering the exin-ternal environment, Tema had the best exin-ternal coordinate value of (0.1257), followed by Abidjan (0.0746), Lome (0.0389), Cotonou (−0.0211), Lagos (−0.1049) and Dakar (−0.1133) respectively.
[image:12.595.191.554.360.533.2]The results imply that compared to Abidjan and the four others port, Tema enjoyed the best opportunities for development. In order to identify the competitive position of the ports, their coordinate values are plotted in the quadrant of the grand strategy matrix as described in Figure 2. The analysis of Figure 2 reveals that Abidjan with its substantial
Table 2. Internal factor weight.
Internal (I) Criteria Fuzzy Weight Defuzzified Weight
I1 Water depth (0.1399, 0.1464, 0.1537) 0.1467
I2 Crane productivity (0.1478, 0.1554, 0.1634) 0.1553
I3 Ship Turnaround time (0.1496, 0.1563, 0.1639) 0.1567
I4 Quay Length (0.1263, 0.1325, 0.1394) 0.1323
I5 Volume handled (0.0961, 0.102, 0.108) 0.102
I6 Dwell time (0.0943, 0.0998, 0.1053) 0.0997
I7 Terminal area (0.0811, 0.0867, 0.0914) 0.0863
I8 Handling cost (0.1149, 0.1208, 0.1274) 0.121
Sum 1
Table 3. External factor weight.
External (E) Criteria Fuzzy Weight Defuzzified Weight
E1 Efficiency of Custom service (0.1389, 0.1429, 0.1718) 0.1512
E2 Political risk (0.2331, 0.2413, 0.278) 0.2508
E3 Significance in the international shipping network (0.1067, 0.1432, 0.1593) 0.1364
E4 Economy performance (0.1445, 0.1815, 0.2122) 0.1794
E5 Proximity to hinterland (0.1333, 0.1606, 0.1858) 0.1599
E6 Level of corruption (0.1054, 0.12, 0.1415) 0.1223
[image:12.595.192.557.566.707.2]Table 4. Assessment of weighted average scores of container terminals.
Criteria Defuzzified weight Container terminals
Abidjan Tema Lome Cotonou Lagos Dakar
I1 0.1467 0.1467 0.135 0.1408 0.1174 0.1056 0.135
I2 0.1553 0.1398 0.1553 0.1398 0.1398 0.1165 0.1553
I3 0.1567 0.1567 0.0049 0.1567 0.0065 0.0131 0.0065
I4 0.1323 0.1316 0.0756 0.0566 0.0711 0.1323 0.0869
I5 0.102 0.0406 0.0558 0.018 0.019 0.102 0.0283
I6 0.0997 0.0582 0.0279 0.0537 0.0582 0.0166 0.0997
I7 0.0863 0.0534 0.0377 0.0188 0.0314 0.0863 0.0549
I8 0.121 0.0721 0.1116 0.0852 0.1042 0.121 0.1172
Sum/Rj 1 0.7991 0.6038 0.6696 0.5476 0.6934 0.6838
E1 0.1512 0.1334 0.1271 0.1197 0.1512 0.1346 0.1495
E2 0.2508 0.1759 0.2084 0.2508 0.111 0.0654 0.1693
E3 0.1364 0.1121 0.1236 0.0943 0.0912 0.1364 0.0708
E4 0.1794 0.1794 0.1423 0.0996 0.1339 0.105 0.0705
E5 0.1599 0.1526 0.1599 0.1485 0.144 0.1373 0.091
E6 0.1223 0.0791 0.1223 0.0839 0.1055 0.0743 0.0935
Sum/Rj 1 0.8325 0.8836 0.7968 0.7368 0.653 0.6446
Table 5. The benchmarks and coordinate values for the year 2013.
Coordinate value Abidjan Tema Lome Cotonou Lagos Dakar Benchmark value
Weighted score (WS) 0.7991 0.6038 0.6696 0.5476 0.6934 0.6838 0.6662
Coordinate value (IC) 0.1329 −0.0624 0.0034 −0.1186 0.0272 0.0176
Weighted score (WS) 0.8325 0.8836 0.7968 0.7368 0.653 0.6446 0.7579
Coordinate value (EC) 0.0746 0.1257 0.0389 −0.0211 −0.1049 −0.1133
internal strength and positive external environment is located in the first quadrant of the matrix, and thus has the best competitive position in comparison to its competitors. Tema and Lome are positioned in the second quadrant. In fact, both ports, particularly Tema with the significant opportunities offers by its environment, are limited in terms of internal resources. Compared to the port of Abidjan, Tema is limited in terms of yard space, storage area, handling equipment and capacity to transport the container to the hinterland. The results are in line with the report made in [29]. According to this report, Tema has reached its limit to accommodate trade traffic and the port is facing with increase congestion for mooring at the berths
[image:13.595.189.555.428.511.2]environ-ment. Lagos and Dakar located in the fourth quadrant are facing critical threat from their environment, which undermines their competitive position.
5.3. Examining the Changes in Terminal Competitive Position
[image:14.595.74.548.268.576.2]The environmental scan can be done several times to identify the changes in the petitive position of the ports. Accordingly, in order to observe the change in the com-petitive position of the ports and especially Abidjan, the analysis have been done a second time considering the performance values of the year 2010 and assuming the weight of the criteria constant. It is worth reminding that during that period, Cote d’Ivoire was experiencing a political conflict which had greatly affected its economic activities. The results relative to the benchmarks and coordinates values are summa-rized in Table 6. The analysis of the position of Abidjan indicates that it had enjoyed a
[image:14.595.193.556.630.706.2]Figure 2. Port competitive position in combined SWOT-GSM matrix (2013).
Table 6. The benchmarks and coordinate values for the year 2010.
Coordinate value Abidjan Tema Lome Cotonou Lagos Dakar Benchmark value
Weighted score (WS) 0.8065 0.6014 0.6823 0.5572 0.6934 0.6871 0.6713
Coordinate value (IC) 0.1352 −0.0699 0.011 −0.1141 0.0221 0.0158
Weighted score (WS) 0.6126 0.8962 0.816 0.6119 0.7219 0.6929 0.7253
Coordinate value (EC) −0.1127 0.1709 0.0907 −0.1134 −0.0034 −0.0324 0.14
TEMA 0.12
0.10
0.08
ABIDJAN 0.06
0.04 LOME
0.02
0.00
-0.14 -0.12 -0.10 -0.08 -0.06 -0.04 -0.02 0.02 0.04 0.06 0.08 0.10 0.12 0.14
-0.02 COTONOU
-0.04
-0.06
-0.08
-0.1 LAGOS
-0.12DAKAR
-0.14
T O
S W
competitive strength but in the meantime, was facing a significant threat undermining its ability to compete in the sub-region. This can be explained by the political instability In Cote d’Ivoire which led many operators to shift their activities in the neighboring ports. The competitive position of each port during the year 2010 and 2013 are summa-rized in Figure 3. The direction of the arrow indicates the evolution from 2010 to 2013. It can be seen that during the year 2010, none of the ports were located in the first qua-drant. This means that all the ports were facing significant issues either in terms of li-mited strength or in terms of critical threat. For instance, Abidjan was located in the fourth quadrant due to the threat from the external environment. Considering the change in the competitive position from 2010 to 2013, the most significant change is the promotion of Abidjan from the fourth quadrant to the first quadrant resulting from an enhancement in the external environment. On the other hand, it can be seen that the port of Cotonou has improved its competitive position by an improvement of its external
[image:15.595.74.555.274.686.2]2010 2013
Figure 3. Port competitive position in combined SWOT-GSM matrix in 2010 and 2013.
0.18
TEMA
0.16
0.14
TEMA 0.12
0.10
LOME
0.08
ABIDJAN
0.06
0.04
LOME
0.02
0.00 LAGOS
-0.14 -0.12 -0.10 -0.08 -0.06 -0.04 -0.02 0.04 0.06 0.08 0.10 0.12 0.14
-0.02
COTONOU DAKAR
-0.04
-0.06
-0.08
-0.1 LAGOS
COTONOU
-0.12DAKAR
-0.14
-0.16
-0.18
O
T
W S
A
coordinated, reflecting a reduction of the threats in its environment. While Tema and Lome have experienced a slight increase in their internal strength, they were faced with a reduction of opportunities in their environment. Finally, the ports of Dakar and La-gos have declined in terms of competitive position resulting to an increase of threats in their environment.
6. Conclusion
This article adopts a quantified SWOT framework which integrates fuzzy linguistic preference relation to evaluate the competitive position of Abidjan container terminal in West Africa. The integration of fuzzy linguistic preference relation in the quantified SWOT framework circumvents the difficulties in terms of data collection and consis-tency of judgment matrices prevailing in the conventional AHP and Fuzzy AHP. On the other hand, the study provides relevant evidences about the key internal and exter-nal attributes shipping lines considered as important and hence the attributes that ports in the region most need to enhance in order to improve their attractiveness and com-petitive position in the sub-region. The findings indicate that West African port au-thorities and terminal operators could focus on improving ship turnaround time, crane productivity and physical infrastructure among the internal factors while government should assure political stability, economy performance but also improve transport in-frastructure in order for the ports to achieve a competitive advantage. The change in port competitive position from 2010 to 2013, highlights that the difficulties of West African port in attracting customers in the sub-region are not only related to internal problems such as inadequate infrastructures and facilities or inefficiency, but significant constraint outside the ports constraints their competitiveness. Consequently, a suitable strategy fit between the internal strength and weaknesses, and external opportunities and threat may help the port to achieve a sustainable growth.
References
[1] Lee, S.W., Song, D.W. and Ducruet, C. (2008) A Tale of Asia’s World Ports: The Spatial Evolution in Global Hub Port Cities. Geoforum, 39, 372-385.
http://dx.doi.org/10.1016/j.geoforum.2007.07.010
[2] Panayides, P. and Song, D.-W. (2012) Determinants of Users’ Port Choice. In: Talley, W.K., Ed., The Blackwell Companion to Maritime Economics, Wiley-Blackwell, Oxford, 599-622.
http://dx.doi.org/10.1002/9781444345667.ch29
[3] Shariatmadari, M., Sarfaraz, A.H., Hedayat, P. and Vadoudi, K. (2013) Using SWOT Analy-sis and SEM to Prioritize Strategies in Foreign Exchange Market in Iran. Procedia-Social and Behavioral Sciences, 99, 886-892. http://dx.doi.org/10.1016/j.sbspro.2013.10.561
[4] Pur, M.M. and Tabriz, A.A. (2012) SWOT Analysis Using of Modified Fuzzy QFD: A Case Study for Strategy Formulation in Petrokaran Film Factory. Procedia-Social and Behavioral Sciences, 41, 322-333. http://dx.doi.org/10.1016/j.sbspro.2012.04.037
[5] Chang, H.H. and Huang, W.C. (2006) Application of a Quantification SWOT Analytical Method. Mathematical and Computer Modelling, 43, 158-169.
[6] Saaty, R.W. (1987) The Analytic Hierarchy Process—What It Is and How It Is Used. Ma-thematical Modelling, 9, 161-176. http://dx.doi.org/10.1016/0270-0255(87)90473-8
[7] Kurttila, M., Pesonen, M., Kangas, J. and Kajanus, M. (2000) Utilizing the Analytic Hie-rarchy Process (AHP) in SWOT Analysis—A Hybrid Method and Its Application to a For-est-Certification Case. Forest Policy and Economics, 1, 41-52.
http://dx.doi.org/10.1016/S1389-9341(99)00004-0
[8] Lee, K.L. and Lin, S.C. (2008) A Fuzzy Quantified SWOT Procedure for Environmental Evaluation of an International Distribution Center. Information Sciences, 178, 531-549.
http://dx.doi.org/10.1016/j.ins.2007.09.002
[9] Qu, L. and Chen, Y. (2009) An Integrated Fuzzy AHP-SWOT Method and Its Application in the Analysis of China’s Software Industry Bases.
[10] Wang, T.C. and Chen, Y.H. (2008) Applying Fuzzy Linguistic Preference Relations to the Improvement of Consistency of Fuzzy AHP. Information Sciences, 178, 3755-3765.
http://dx.doi.org/10.1016/j.ins.2008.05.028
[11] Chen, Y.H., Wang, T.C. and Wu, C.Y. (2011) Multi-Criteria Decision Making with Fuzzy Linguistic Preference Relations. Applied Mathematical Modelling, 35, 1322-1330.
http://dx.doi.org/10.1016/j.apm.2010.09.009
[12] Lu, S.T., Yu, S.H., Chang, D.S. and Su, S.C. (2013) Using the Fuzzy Linguistic Preference Relation Approach for Assessing the Importance of Risk Factors in a Software Development Project. Mathematical Problems in Engineering, 2013, Article ID: 376375.
http://dx.doi.org/10.1155/2013/376375
[13] Rezaei, J. and Ortt, R. (2013) Multi-Criteria Supplier Segmentation Using a Fuzzy Prefe-rence Relation Based AHP. European Journal of Operational Research, 225, 75-84.
http://dx.doi.org/10.1016/j.ejor.2012.09.037
[14] Herrera-Viedma, E., Herrera, F., Chiclana, F. and Luque, M. (2004) Some Issues on Con-sistency of Fuzzy Preference Relations. European Journal of Operational Research, 154, 98- 109. http://dx.doi.org/10.1016/S0377-2217(02)00725-7
[15] Aronietis, R., Markianidou, P., Meersman, H., Pauwels, T., Pirenne, M., Van de Voorde, E.,
et al. (2010) Some Effects of Hinterland Infrastructure Pricing on Port Competitiveness: Case of Antwerp. 12th WCTR, Lisbon, 11-15 July 2010, 1-23.
[16] Wiegmans, B.W., Hoest, A.V.D. and Notteboom, T.E. (2008) Port and Terminal Selection by Deep-Sea Container Operators. Maritime Policy & Management, 35, 517-534.
http://dx.doi.org/10.1080/03088830802469329
[17] Park, N.K. and Suh, S.C. (2013) An Empirical Research on Container Terminal Selection Criteria and the Relationship with Shipping Company's Satisfaction: The Case of Korea.
Journal of Contemporary Management, 41-53.
[18] Yeo, G.T., Roe, M. and Dinwoodie, J. (2008) Evaluating the Competitiveness of Container ports in Korea and China. Transportation Research Part A: Policy and Practice, 42, 910- 921. http://dx.doi.org/10.1016/j.tra.2008.01.014
[19] Song, D.-W. and Panayides, P.M. (2008) Global Supply Chain and Port/Terminal: Integra-tion and Competitiveness. Maritime Policy & Management, 35, 73-87.
http://dx.doi.org/10.1080/03088830701848953
[20] Chang, Y.-T., Lee, S.-Y. and Tongzon, J.L. (2008) Port Selection Factors by Shipping Lines: Different Perspectives between Trunk Liners and Feeder Service Providers. Marine Policy, 32, 877-885. http://dx.doi.org/10.1016/j.marpol.2008.01.003
Research in Transportation Economics, 35, 34-40.
http://dx.doi.org/10.1016/j.retrec.2011.11.005
[22] Gohomene, D.A., Yang, Z., Bonsal, S., Maistralis, E., Wang, J. and Li, K.X. (2015) The At-tractiveness of Ports in West Africa: Some Lessons from Shipping Lines’ Port Selection.
Growth and Change, 47, 416-426. http://dx.doi.org/10.1111/grow.12133
[23] Notteboom, T. (2011) An Application of Multi-Criteria Analysis to the Location of a Con-tainer Hub Port in South Africa. Maritime Policy & Management, 38, 51-79.
http://dx.doi.org/10.1080/03088839.2010.533710
[24] Medda, F. and Caschili, S. (2015) The Port Attractiveness Index: Application on African Ports. Region et Developpement, 41, 47-82.
[25] Hyuksoo, C.H.O. and Sangkyun, K.I.M. (2015) Examining Container Port Resources and Environments to Enhance Competitiveness: A Cross-Country Study from Resource-Based and Institutional Perspectives. The Asian Journal of Shipping and Logistics, 31, 341-362.
http://dx.doi.org/10.1016/j.ajsl.2015.09.002
[26] Trochim, W., Donnelly, J.P. and Arora, K. (2015) Research Methods: The Essential Know-ledge Base. Nelson Education,Cengage Learning, Boston.
[27] Hewitt, J.J., Wilkenfeld, J. and Gurr, T.R. (2010) Peace and Conflict 2010 Executive Sum-mary. University of Maryland, College Park.
[28] Hewitt, J. J., Wilkenfeld, J. and Gurr, T. R. (2012) Peace and Conflict 2012 Executive Sum-mary. University of Maryland, College Park.
Appendix 1: Strategy Related to the Competitive Position in GSM
Quadrant Competitive Position Strategy
1) Strengths and market opportunities
Firms positioned in this quadrant can use their strengths to adopt strategies, such as market penetration, market development, and product development, to form competitive strength. If a particular firm in the first quadrant has extra resources, forward, backward and horizontal integration may be efficient strategies.
2)
Market development opportunities but placed on the weak side on the competition
In such position, the priority for the firms is to address their weaknesses to intensify competitive strength. If they lack unique competence, they may consider intensifying their competitive strength through joint ventures or horizontal merger strategies.
3) Low competitive strength and facing threats from other competitors.
These firms can adopt defensive strategies, such as focusing on the most favored markets to avoid threats. But in case of failure, divestiture or liquidation should be considered.
4) Competitive strength but facing greater threats than
opportunities. Diversification or joint ventures should be adopted to reduce threats.
Submit or recommend next manuscript to SCIRP and we will provide best service for you:
Accepting pre-submission inquiries through Email, Facebook, LinkedIn, Twitter, etc. A wide selection of journals (inclusive of 9 subjects, more than 200 journals)
Providing 24-hour high-quality service User-friendly online submission system Fair and swift peer-review system
Efficient typesetting and proofreading procedure
Display of the result of downloads and visits, as well as the number of cited articles Maximum dissemination of your research work