ISSN 2250-3153
Identification of Eddy in Bone Bay By Using
Landsat-8
Angraeni1), Achmar Mallawa2), Anshar Amran2)
1) Masters in the Program of Fisheries Science, Hasanuddin University
2) Marine Science and Fishery Faculty of Hasanuddin University
Makassar-South Sulawesi
DOI: 10.29322/IJSRP.9.07.2019.p9140 http://dx.doi.org/10.29322/IJSRP.9.07.2019.p9140
Abstract
Bone Bay is a fairly potential water area in eastern Indonesia, especially in its fisheries. Eddy can indirectly affect water fertility,
so it is necessary to identify eddy to see which areas are fertile. Identification of Eddy is done by utilizing AVISO and
LANDSAT- 8 which was processed in Envi 5.1 then included in ArcGIS where eddy points can be produced in July as many as
33 points, August 74 points, September as many as 46 points and October as many as 15 points, where eddy currents gather in the
middle of the Bone bay caused by current movement.
Keywords
Eddy, Bone Bay, Arc Gis, Temperature, Landsat
INTRODUCTION
Bone Bay is a fairly potential water area in eastern Indonesia, especially in its fisheries. Bone bay has fertile waters, rich
in nutrients so it is usually used as a place for spawning and maintenance. The fertility of a waters characterized by increased
nutrient can affect the abundance of phytoplankton because nutrient is needed to support the growth of phytoplankton (Nybaken,
1992).
Nutrients needed by phytoplankton can be carried by upwelling while downwelling carries large oxygen content (Azis,
2006). In the area that occurs upwelling is known as O2 that is rich in dissolved nutrients, phosphate and nitrate which can
support plankton growth because the surface is rich in nutrients which will provide food for fish. There will be the food chain
where phytoplanktons act as primary producers, whereas zooplanktons play an important role in moving energy from primary
producers to a higher level of consumers. Whereas downwelling which occurs alternately with upwelling can carry gas
compounds that are needed by living things under the sea to stay alive. In the eddy cycle phytoplankton can change, variations in
eddy properties change the distribution and level of phytoplankton by influencing upwelling displacement and the swirling
horizontal scale of the vortex (Liu, 2018).
In the simulation of the barotropic 3-dimensional current model, upwelling is viewed from the parameters of the vertical
current that moves from a certain depth to a more shallow / surface layer. The simulation results also show the phenomenon of
sinking/downwelling currents around the waters of the Gulf of Bone, but with a not so significant speed. Upwelling phenomena in
the Gulf of Bone waters occurs due to the existence of Ekman Transport which attracts surface water masses to the West from the
ISSN 2250-3153
Eddy current transport, trap and disseminate chemical elements, dissolved substances, nutrients, small organisms, and
heat. Eddy can trap water masses for months within hundreds of kilometers. Eddy initially provides heat transfer and nutrients
horizontally and vertically but over time moves away and eventually the vortex dies (Williams, 2011). There are two types of
eddy movements, namely cyclonic (clockwise in the southern hemisphere) and anticyclonic (counter-clockwise in the southern
hemisphere). Eddy currents can cause upwelling or downwelling in accordance with the direction of rotation (Martono 2009).
Eddy indirectly can affect the fertility of the water, so that eddy identification is needed to see which areas are fertile.
Identification of Eddy is done by utilizing LANDSAT-8 because it has better capabilities where this satellite carries two sensors
namely Operational Land Imager (OLI) with a spatial resolution of 15 meters and a Thermal Infrared Sensor (TIRS) sensor with a
spatial resolution of 100m to produce thermal infrared channels (USGS, 2019). In addition, Landsat-8 can also reduce
electromagnetic wavelengths so that it is more sensitive to differences in reflectance of seawater or aerosols in the atmosphere.
Research methods
Identification of Eddy was carried out by interpreting LANDSAT8 satellite data from July to October 2018 then
processed using ENVI 5.1. To determine the position of eddy is done by looking at the temperature changes that occur where the
area is different from the surrounding area. according to (Arraza et al, 2003; Castellani, 2006 and ChuanHua, 2015) areas that
have a sea surface temperature that resembles a circle and experiences an increase in temperature from the center of the outgoing
circle can be identified as eddy.Then the direction and speed data and sea surface temperature data are overlapped using ArcGIS
10.2 and seen in each eddy occurrence can be seen what day, month and how much eddy is formed.
RESULTS AND DISCUSSION
The results of the Landsat 8 data processing using Envi 5.1 which uses sea surface temperature data as an indicator of
eddy formation as with the research conducted (Lehodey et al, 2006) that uses sea surface temperature as an indicator in
determining upwelling and downwelling associated with potential fish areas. (Nontji, 2008) stated that upwelling and
downwelling can be caused by eddy currents. Then the eddy obtained will be processed by using Arcgi so that there are four map
ISSN 2250-3153
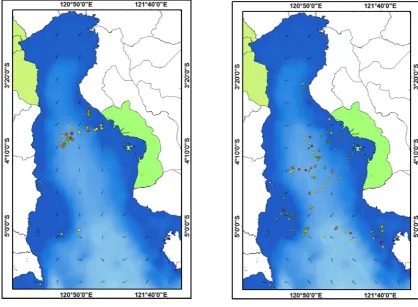
[image:3.595.88.507.55.362.2]:
Figure 1. Eddy identification map based on LANDSAT imagery in July 2018 and b in August 2018
In figure 1, in July 2018 33 eddy can be identified with the lowest sea surface temperature obtained is 20.34oC while the
highest temperature is 24.95oC. The temperature 20oC is three points, 21oC 9 points, 20oC 10 points, temperature 23oC as many as
8 points, and 24oC as many as 3 points. As for August 2018 the identified eddy was 74 points with the lowest sea surface
temperature of 20.2oC and the highest sea surface temperature of 27.34oC. The temperatures of 20oC contained of 13 eddy points,
21oC as much as 17 eddy points, 22oC 18 eddy points, temperature of 23oC as much as 17 eddy points, temperature of 24oC as
ISSN 2250-3153
[image:4.595.92.504.52.363.2]
Figure 2. Eddy identification map based on LANDSAT imagery a September 2018 and b in October 2018
In Figure 2, we can see eddy identification in September and October 2018, wherein September 2018 there were 46 eddy
points with the lowest temperature was 20.13oC and the highest was 24.6oC. The eddy point at temperature of 20oC was 9 points,
21oC as much as 8 points, temperature of 22oC as much as 12 points, temperature of 23oC as much as 13 points and temperature
of 24oC as much as 3 points. Whereas in Figure 2b is the eddy identification map in October 2018 that had 15 eddy points which
the lowest eddy temperature was 20.74oC and the highest temperature was 25.7oC. The eddy point of 20oC was 2 points, of 21oC 4
points, of a temperature of 22oC as much as 1 point, at temperature of 23oC as much as 2 points, at a temperature of 24oC as much
as 2 points and at temperature of 25oC for 2 points.
In July it was found 33 eddy points. In August there were 206 points, September as many as 78 points and October as
many as 15 points which range of sea surface temperature is of 20-25oC. The value of sea surface temperature was lower than the
surrounding sea surface temperature identified as eddy. Eddy currents are oceanographic phenomena that have an important
influence on atmospheric conditions and dynamics. This effect is through the formation of upwelling and downwelling due to
eddy. Welling and downwelling currents will change the sea surface temperature. According to research done by (Martono,
2010), Changes in sea surface temperature will change air pressure, then the wind circulation will result in ocean waves and ocean
currents. This chain process will continue.
Based on research done by (Kunarso et al, 2011) SPL distribution has different values in each season. In the East season,
in general, the waters have a temperature range of 24-27oC with conditions in the eastern region cooler than the western region.
The waters tend to be warm up in the western season with a range of values of 28-30oC and tend to be homongen each month.
The intensity of upwelling increases with conditions of very low sea surface temperatures and higher chlorophyll-a content.
In June-August, when the sun is in the northern hemisphere, the continent of Asia has a higher temperature than the
continent of Australia. This causes the air pressure in the Asian Continent to be lower than the air pressure on the Australian
ISSN 2250-3153
and the wind that blows comes from the southeast (Southeast Muson Wind) for the Southern Hemisphere. In December-February,
the position of the sun is in the southern hemisphere so that the continent of Asia has a higher pressure than the continent of
Australia. This causes winds to blow from the Asian Continent to the Australian Continent. This condition is called West Season
and the wind originating from the northwest (Wind of the North West Monsoon, in the Southern Hemisphere blowing (Wyrtki,
1961)
In July to August, the number of eddy has increased while from August to September and from September to October
there have been decreases in the number of eddy points. This is in accordance to the study of (Alawiyah, 2018) which stated that
June-August is the most potential month for triggering eddy currents that can cause upwelling. The upwelling phenomenon that
occurs in the west is calculated to be weaker than the eastern season because overall upwelling is a response to the blowing of the
southeast monsoon (Susanto, 2001). (Wyrtki, 1987) said that in normal circumstances, in the Pacific blews southeast easterly
winds throughout the year. This wind friction power serves to push the mass of water in the Pacific towards the west. So that there
is a buildup of water masses in the western Pacific which are close to Indonesia.
The upwelling phenomenon occurs when the wind blows from the east and the drag effect turns to the south because in
the north there is a barrier (another land/beach/ dominant wind front, in the southern part of the earth), then causes a series of
water masses to be dragged to the south away from the coast so that the mass of water from the deeper layers will fill the void in
the surface layer. Downwelling is a process that occurs when the wind blows in the opposite direction. This pattern of upwelling
and downwelling is very likely to affect the pattern of aquatic fertility in the region.
In figures 1 and 2, it can be seen that the eddy points converge in the middle due to the current located in the north of the
Bone bay was towards the south of the bone bay and so the southward current moves towards the northern of Bone bay too. Based
on research (Widodo, 2014) the Bone bay currents generally moved from the south to the northwest of Wulu and then moved
along the east coast to Tanjung Tabako and turned west around Murante, then joined the west coast railroad which moved from
the southern of Lakaloto Cape Bay to the North to go to the reefs and Palopo. In addition, some of the moving currents from
Tanjung Tabako run along the East and North shores then turn towards Southwest to the coast of Palopo.
In coastal areas, upwelling can occur if a mass of surface water flows to leave the coast. Off the sea, upwelling occurs
because of a spread surface pattern (divergence), so that the mass of water from the subsurface layer will flow up to fill the void
that occurs due to the spread of the current. This process is characterized by a significant decrease in sea surface temperature
(around 2oC for the tropics, and > 2oC for subtropical regions (Dahuri et al., 1996). Changes in sea surface temperature will affect
the production and distribution of fish in the Sea (Nybakken.1988). Water temperature varies from time to time in accordance
with natural conditions that affect these waters. According to Illahude (1997), the influence of strong land on water temperature
causes coastal waters to have higher temperatures than offshore waters. According to (wicaksono, 2010) the temperature in the
sea can be affected by the influence of the season on regional sea circulation processes such as the warm flow of water from the
Pacific Ocean to the Indian Ocean through parts of Indonesia and also from the existence of the El Nino phenomenon.
Upwelling areas are generally characterized by high nutrient content and lower surface temperatures than surrounding
areas. The condition of low sea surface temperatures and relatively higher surface wind speeds coincides with the abundance of
chlorophyll-a concentrations as an indication of upwelling. And conversely the abundance of chlorophyll-a tends to decrease
where sea surface temperatures experience a temporary increase as soon as the wind decreases. This indicates a downwelling in
the region, the sea surface temperature is very heavy (Ratnawati, 2016). Sea surface temperature is very closely related to primary
productivity and ocean currents (Arsjad, 2014). Sea surface temperature in June has decreased which is predicted to occur
upwelling or removing of low-temperature water masses from deeper layers of water to the surface. The upwelling process that
ISSN 2250-3153
(Yoga, 2014; Rochmady, 2015) and in his research (Nontji, 2008) said that the decreases in surface temperature, the presence of
upwelling is also characterized by rising levels nutrients or nutrients in that location. Nutrients, especially phosphate and silicate
in the photic zone, have an effect on the productivity of phytoplankton, therefore phytoplankton in large numbers will be found at
the location of upwelling.
CONCLUSION
The conclusions that can be taken in the study of identification of eddy in Bone bay by using Landsat is that the number
of eddy in each month is different. The number of eddies identified in July is 33 points, in August are 74 points, in September are
46 points and months October is 15 points. The eddy points gather in the middle of the Gulf of Bone caused by current
movements
BIBLIOGRAPHY
Alawiyah Esa Agustin, Sasmito Bandi, Bashit Nurhadi, 2018. Analysis of Geostrophic Flow Patterns of Indian Ocean Waters for
Upwelling Identification using Altimetry Satellite Data. Undip Geodesy Journal. January 2018
Arsjad, S.M., Y.Siswantoro and R.S. Goddess. 2004. Distribution of Chlorophyll-a in Indonesian Waters Inventory of Natural
Resources and the Environment; Center for Marine Natural Resources Survey. BAKOSURTANAL. Bogor.
Azis, M.F. 2006. Water Motion in the Sea. Oceana (31) 4: p. 9-21.
Dahuri, R., J. Rais., P. Ginting., M.J. Sitepu. 1996. Integrated Management of Coastal and Oceanic Resources, Pradnya Paramita,
Jakarta.
Hasanuddin. M. 1998. Lintas Indonesia (ARLINDO). Oceana XXIII (2): 1-9
Ilahude, A. G. 1997. Distribution of temperature, salinity, sigma-T, and nutrients in the waters of the South China Sea. In:
Suyarso (ed.). Oceanology Atlas of the South China Sea. Research Center for Oceanology-LIPI Jakarta. Pp .: 25-34.
Kunarso, S. Hadi, N.S. Ningsih and M.S. Baskoro. 2011. Variability of Temperature and Chlorophyll-a in Upwelling Areas in
Variations in ENSO and IOD Events in South Java to Timor Waters. Journal of Marine Sciences, 16 (3): 171-180.
Liu, Fenfen, 2018. Influence on Phytoplankton of Different Developmental Stage of the Mesoscale Eddies off Eastern Australia.
Elsevier: Journal of Sea Research 137 (2018) 1-ó.
Martono. 2010. Effect of El Nino and Laina phenomena on Eddy Flow in the Java Sea and the Flores Sea. Journal of Proceedings
of the Flight and Space Seminar.
Nontji, A. 2008. Plankton Laut. LIPI-Press. Jakarta.
Nybakken, J.W., 1988. Marine biology: An ecological approach. Translation of marine biology: An ecological approach (Eidman,
M., Koesoebiono, D.G. Bengen, M. Hutomo, S. Sukardjo, Translator). PT. Gramedia, Jakarta.
Pranowo, Widodo, S., et al. 2014. Flow Dynamics in Supporting Marine Aquaculture in Bone Bay. December 2014 Harpodon
Borneo Journal.
Susanto et al 2001. Upwelling along the Coast of Java and Sumatra and its Relations to ENSO. Geophysical Research Letter. 28
ISSN 2250-3153
Ratnawati H Ika, Rahmat Hidayat, Ahmad Bey, T June. 2016. Upwelling in the Banda Sea and the South Coast of Java and its
relationship with ENSO and IOD. Omni Aquatica 12 (3): 119-130
Rochmady. 2015. Analysis of Oceanographic Parameters through a WEB-based Management Information System Approach.
Agribusiness and Fisheries Scientific Journal (Agrikan UMMU-Ternate) 8 (1).
USGS. 2019. Landsat. http: // landsat.usgs.gov / band _ designations _ Landsat _satellites.php. Accessed on May 14, 2019
Wicaksono, A., Muhsoni, F.F., Fahrudin, A., 2010. Application of NOAA-17 Satellite Image Data to Measure Variations in Luat
Java Surface Temperature. Marine Journal. 3 (1).
Williams, R.G., 2011. Oceanography: ocean eddies and plankton blooms. Nat. Geoscience. 4 (11), 739-740.
Wyrtki, K. 1961. Physical Oceanography of Southeast Asian Waters. Naga Report, Volume 2. The University of California's
Scripps Institution of Oceanography: La Jolla California. The United States of America. 225p.
Wyrtki K. 1987. 111 Indonesian 11 through and associated pressure gradients, Journal of Geophysical Research 92: 12941-12946.
Yoga, Raden B, H. Setyono, G. Harsono. 2014. Dynamics of Upwelling and Downwelling based on Variability of Sea Surface