Eurographics/ ACM SIGGRAPH Symposium on Computer Animation (2007) D. Metaxas and J. Popovic (Editors)
Smooth Movers: Perceptually Guided Human Motion
Simulation
Rachel McDonnell,†1Fiona Newell,2and Carol O’Sullivan1
1Graphics, Vision and Visualisation Group,2Institute of Neuroscience, Trinity College Dublin, Ireland
Abstract
To animate a character, a number of poses are displayed in quick succession in order to create the illusion of motion. For most real-time applications, such as games, the pose update rate is largely constrained by the avail-able hardware and overall simulation complexity. To date, no analysis of the factors that affect the perceived smoothness of animated virtual characters has been presented. In the first perceptual studies aimed at identifying such factors and their interactions, we have determined some thresholds that could be used to produce acceptably smooth human animations in a variety of conditions. Some interesting results were found, e.g., that character type, clothing, scene complexity or motion synchronicity had no effect on smoothness perception in our experiments, but cycle rate, linear velocity, motion complexity and group size all had a significant effect, with slower or lower intensity movements generally requiring fewer updates. Our results should be of real practical use to character animators in various application areas, but in particular to developers of real-time applications where Simulation Levels Of Detail (SLOD) need to be employed.
Categories and Subject Descriptors(according to ACM CCS): I.3.7 [Computer Graphics]: Three Dimensional Graph-ics and Realism
1. Introduction
Pose update rate, expressed in poses per second (pps), can be defined as the frequency of individual simulation steps dis-played when animating a character (see Figure1). Depend-ing on the application domain, this rate can be as low as 10 or 12 pps (e.g., for simple game characters or “claymation” figures such as Aardman’s Wallace and Gromit), between 30 and 60pps for most 3D games, and sometimes even higher for production-level motion. In stop motion animation and traditional cartoons, creating double frames (i.e., simulating at 12pps while filming at 24fps), reduces the level of work-ing hours required in these already labor-intensive processes. For most real-time applications, such as games, the pose up-date rate is largely constrained by the available hardware and overall scene complexity. Simulation Level of detail (SLOD) methods are often employed to optimize resource allocation, perhaps by updating the motions of unimportant characters less frequently, thus reducing computational costs.
Further-† [email protected]
more, individual mesh or image-based (impostor) keyframes can be “pbaked” for background characters, which re-duces rendering and simulation costs but increases memory consumption (thus the pps must remain low).
While significant advances have been made in terms of the technical aspects of creating animations of characters, the perceptual significance of certain design or engineering choices is still not fully understood. For example, what im-pact does a particular pose update rate have on the visual fidelity of an animation - what is the threshold below which it becomes unacceptable, or the upper limit above which we are simply wasting valuable resources on imperceptible de-tail? Are these thresholds always the same, regardless of the motion or scene properties being depicted, or are there fac-tors that lower or raise them? Our answers to these questions could be used as metrics for perceptually guided human mo-tion simulamo-tion.
In this paper, we identify some factors and thresholds for the perceived smoothness of animated virtual characters. In a Baseline Experiment (Section3), we first determined whether different pose update rates are in fact needed for
Copyright c2007 by the Association for Computing Machinery, Inc.
Permission to make digital or hard copies of part or all of this work for personal or class-room use is granted without fee provided that copies are not made or distributed for commercial advantage and that copies bear this notice and the full citation on the first page. Copyrights for components of this work owned by others than ACM must be hon-ored. Abstracting with credit is permitted. To copy otherwise, to republish, to post on servers, or to redistribute to lists, requires prior specific permission and/or a fee. Re-quest permissions from Permissions Dept, ACM Inc., fax +1 (212) 869-0481 or e-mail [email protected].
human motions with different character and motion proper-ties - we found that the type of character and clothing have no effect, whereas different motion types do. Our detailed Movement Experiment (Section4) examined the impact and interactions of various motion properties - we found, for ex-ample, that motions with lower cycle rate, complexity and linear velocity needed significantly fewer pose updates. Fi-nally, several experiments were carried out to determine the effects of having different Simulation Levels of Detail (Sec-tion5) in a scene, where we found that lower pose update rates were acceptable for background characters, and that neither synchronicity of their motions nor the complexity of the scene had any effect on the perceived smoothness of the animations.
Figure 1:The update rate or poses per second (pps) used to update characters typically varies based on the applica-tion domain. In this figure, the animaapplica-tion on the top is being updated at 30pps, whereas the one on the bottom is only up-dated at 15pps.
2. Background
The issue of appropriate pose update rates for animation is related to the study of frame rates for movies and refresh rates for monitors and televisions. Much research has been conducted into the factors that affect thecritical fusion fre-quency, which is the refresh rate of a display device above which a picture stops flickering and fuses into a steady im-age (e.g., [Rog83,Lan54]). More closely related to our work, Watson et al. [WAF86] looked for the critical sample rate necessary for observers to consider sampled images indistin-guishable from continuous moving images (i.e., when they appeared smooth). They found, for the simple moving lines tested, that this rate depended on the spatial and tempo-ral acuity of the observer and on the velocity and spatial-frequency content of the image. While these results could form a good theoretical basis for a motion metric, it is diffi-cult to see how we could directly derive them from the typ-ically complex parameters that animators of virtual charac-ters manipulate.
Research from the fields of psychology and neuroscience has shown that different sources of information, such as color and form, can contribute to the perception of motion. Jo-hansson [Joh73] showed that 12 moving light points, affixed
to the main joints of the body, suffice to create a rich per-ception of a moving human figure, within a very short on-set time (200msec). This stimulus was designed to separate biological motion information from other sources of infor-mation that are normally intermingled with the motion of a human, such as form or outline. These “point-light walkers” have since been used extensively to examine the sophisti-cated pattern analysis processes that the brain uses for bio-logical motion perception. Dittrich [Dit93] found that bet-ter and fasbet-ter human motion recognition occurred when the lights on the walker were displayed in the normal (upright) orientation, than when upside-down, indicating that higher level (or top-down) cognitive processes are being used for the familiar motion, whereas the unfamiliar (inverted) mo-tion is more likely to be seen as a collecmo-tion of randomly moving dots. Despite people’s relative insensitivity to miss-ing or inaccuratespatialdata for walking stimuli, they are not so forgiving of missing or distortedtemporaldata. For example, Mather et al. [MRW92] found that inserting blank frames for>=48msec between displayed frames of a walk-ing human (i.e., a pose update rate of about 20pps in our terminology) significantly reduced people’s ability to recog-nize the direction of motion.
Computer Animation researchers have also investigated the limits of user sensitivity to animated human motion and have developed perceptual metrics for improving human an-imation quality [HOT98,OHJ00,RP03,HRvdP04,WB04,
MSCO06]. Despite these promising results, automatic
mea-surement of the visual fidelity of human motion is still not possible for most practical applications such as motion com-pression or optimization. Arikan [Ari06] recently reported the inadequacy of existing measures of visual fidelity for compressed human motion, RMS error proving particularly unsuitable. While trying to reduce the dimensionality of the search space of human motions for optimization purposes, Safonova et al. [SHP04] used the average squared error be-tween the angles of a full-dimensional motion and its k-dimensional representation as a measure of motion quality. They computed this metric for a number of varying human behaviors (e.g., walking, running, jumping, boxing, etc.) and plotted the error values for increasing motion dimensions (one curve for each behavior). They manually annotated each curve by indicating the dimensions at which the mo-tion a) exhibited visual artifacts, b) looked similar to, or c) was indistinguishable from the full-dimensional motion. While these measures were approximate and not based on psychophysical evaluation, they did indicate that the type of behavior depicted did have an effect on the average errorand
on the level at which the motion started to look acceptable.
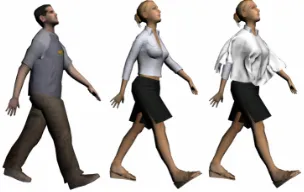
Figure 2: Character 1, character 2 and character 2 with deformable clothing.
a low number of poses (typically 10pps) are stored and dis-played, which can result in perceptibly jerky motion of the crowd members. Dobbyn et al. [DHOO05] use a hybrid ap-proach with impostors in the background and geometry in the foreground - popping artifacts based on rendering dif-ferences have been eliminated, but no evaluation of the ef-fects of switching between different SLODs has been car-ried out. Pettre et al. [PdHCM∗06] employ multiple SLODs, from 4pps for faraway characters to 25pps for characters at the front of a crowd. While this does improve the smooth-ness of many of the motions, the motion simplifications can sometimes be quite noticeable.
3. Baseline Experiment
Our first experiment was designed to identify baseline fac-tors that affected the perceived smoothness of animated
hu-man motion. We hypothesized: thatcharacter typewould
not affect smoothness perception, as we had observed that the motion of characters with different colors and shapes ap-peared to be equally smooth; that thetype of character cloth-ingwould have an effect, i.e., that those wearing deformable clothing would need more pose updates than linear blend skinned characters, as the subtle deformations would other-wise not be seen clearly; thatmotion typewould make a dif-ference, where more “energetic” or “active” motions would need more updates (partially motivated by the observations of Safonova et al. mentioned above).
As predicted, we found that character type did not affect up-date rate in our experiments. Surprisingly, deformable cloth-ing did not have an effect. However, motion type did have a significant effect, with motions moving further across the screen needing more updates than other motions. The exper-imental method and analysis are described in the following sections.
Method
Fourteen participants (11M, 3F) aged between 18 and 40 took part in the experiment and received a book voucher as a reward. The experiment trials were run on a high speci-fication workstation (Dell precision PWS670 with 3.5GHz Xeon CPU, 3GB of RAM, and an X850 Radeon graphics card) with a Dell UltraSharp 2405FPW 24-inch widescreen Liquid Crystal Display (LCD) monitor, with 16ms black to white response time. This monitor was reported to be good
at displaying games, even fast moving games such as Mi-crosoft’s Freelancer.†‡
Alternatively, we could have used a Cathode Ray Tube (CRT) monitor, but because CRT’s are becoming obsolete in desktop computer systems and televisions, we felt that our results would be of more relevance when carried out on a typical high-end gamer’s monitor instead. Input was pro-vided using an adjacent laptop keyboard.
As a test to ensure that the monitor was consistently produc-ing the correct pose per second rates, we captured a video while displaying the experiment stimuli using a high speed camera§ that could capture 60 frames per second. We were then able to playback the screen capture per frame and check that the poses were being updated at the correct rate (in our movies, pps was always equal to fps). We were able to test this accurately for all pose update rates up to 60pps, and found that the monitor was in fact displaying the movies cor-rectly.
We used the method of constant stimuli to determine thresh-olds, where the stimulus level was thepose update rate, dis-played at 15 different levels, ranging from 4pps to the high-est possible rate achievable on our monitor, which was 63pps (having a response rate of 16ms) . The experiment was di-vided into two randomized blocks, each with a two-way de-sign, in order to avoid confusing participants with too many different conditions. The goal in both blocks was to find the threshold among the 15 update rates at which the partici-pants found the different animations smooth, for each of the conditions.
In Block 1 the conditions werecharacter type(a male ‘char-acter 1’ and a female ‘char‘char-acter 2’ shown in Figure2) and
motion type (motion captured kungfu kick, jumping jack, walking and jogging). Movies, each two seconds long, were generated in 3D Studio Max for each character type (2) per-forming their assigned motions (4) at each of the different stimulus levels (15), each with 3 repetitions of each condi-tion, resulting in a total of 360 stimuli. In Block 2 the first condition wascharacter cloth type(i.e., character 2 as de-picted in Block 1 with simple skinned clothing, and char-acter 2 with physically simulated deformable clothing), and the second condition was againmotion type(kungfu kick, jumping jack and walk - jogging was omitted). Two hundred and seventy movies were created as above: 2 x 3 x 15 x 3. Before the experiment began, participants were shown an an-imation at 4pps and one at 63pps of a different male charac-ter performing a boxing animation and were told that these were examples of jerky and smooth animations. To avoid learning and ordering effects, we randomly chose the order in which each participant did Block 1 or Block 2 and pre-sented each of them with a different randomized playlist.
Figure 3:Mean 50% threshold values for different anima-tion types. Error bars show the standard error of the mean.
The participant pressed the left or right mouse button on the laptop to indicate “smooth” or “jerky” for each movie and we randomly interchanged their meanings per participant to avoid left-right bias.
We chose this design over a discrimination/matching task since we wanted to avoid the situation where participants might attend to a single feature and base judgements on that. Also, we were more interested in how participants catego-rize smooth and jerky animations rather than their ability to discriminate - we did not want to provide a reference for the “ideally smooth” case, rather we wanted participants to use their own reference. Later, in our SLOD experiment we ex-plore the situation where 2 different pose update rates could be displayed alongside one another.
Analysis
For each condition, we wished to find the thresholds within the 15 update rates at which participants found the different motions smooth. The 50% threshold is a typical value re-ported in psychophysics. In this experiment, this would cor-respond to the update rate at which participants were equally likely to rate a motion as ‘smooth’ or ‘jerky’. The mean num-ber of ‘smooth’ responses at each pose update rate was cal-culated for each participant for each condition. These values were then plotted, and psychometric curves were fitted to them.
A two factor ANalysis Of VAriance (ANOVA) showed that there was no main effect of character type or character cloth-ing type. However, there was a main effect of motion type in both blocks. This shows that the number of updates needed for smooth animations was the same regardless of whether the character was male or female, or whether the character was wearing deformable clothing or not. However, there was a significant effect of motion type (F3,96=8.7,P≈0), indi-cating that the different motion types needed different pose update rates to produce smooth animations. In Figure3it can be seen that the jog motion had the highest mean 50% thresh-old value, indicating that it needed the most number of up-dates in order for participants to find the animation smooth. The walk motion had the second highest mean 50% thresh-old value, while the jumping jack and kick motions had the lowest. This indicates that participants found the jumping
jack and kung fu kick motion smoother with fewer updates than the walk or jog.
We felt that the distance that the character moved across the screen must have been a factor, as the walk and jog motion moved much more across the screen than the other two mo-tions. Furthermore, the amount of activity in the motion clip seemed to have an effect. Therefore we designed our next set of experiments to focus on these two factors in particular.
4. Movement Experiment
The second experiment examined more formally the effect of different motion types and their interactions. We hypoth-esized: that there would be a main effect oflinear velocity; i.e., that a character moving faster across the screen would need more updates; that increasedmotion complexity(i.e., more energetic bodily movements) would necessitate more poses to look smooth; and that motions with a highcycle rate(i.e., cyclical speed of limbs) would also require more updates. We found that all of our hypotheses were accepted with statistical significance (>95%). Furthermore, we found
an interaction effect between linear velocity and cycle rate, where for animations with high cycle rates, linear velocity had no effect, whereas for animations with low and medium cycle rates, fewer updates were needed for lower linear ve-locities.
Method
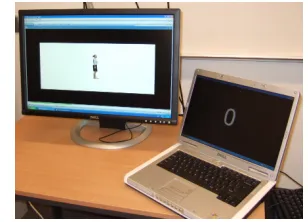
Thirty one participants took part in this experiment (13F, 18M), aged between 12 and 38. All participants were fa-miliar with computer games or had a background in com-puter science and had normal or corrected to normal vision. As before, participants viewed the experiments on a 24-inch monitor and user input was provided by an adjacent laptop (Figure4). Participants received a book voucher for their ef-forts.
Figure 4:System Setup for Movement Experiment.
[image:4.595.339.493.477.588.2]find the threshold among the 10 update rates at which the participants found the different animations smooth, for each of the conditions.
Two motion complexities were chosen:Normal walk with
arms by the side, andComplex walk, the same walk motion with added activity in the arms, torso and head, each moving in time with the legs of the walk cycle.
Three different cycle rates were chosen:Lo(1.5 cycles/sec),
Med(2.72 cycles/sec) andHi(3.75 cycles/sec). These were generated in 3D Studio Max using the footstepmodifier, which allows the distance between steps to be altered, creat-ing walk motions of different cycle lengths - any arm, torso and head movements were also altered to match the cycle of the legs.
Four different linear velocities were chosen:V0(walking on the spot),V1(walking 1/3rd of the distance across the screen, i.e., 7.75screen centimetres/sec),V2(walking 4/6ths of the distance across the screen, 15.5cm/sec) andV3(walking the
full distance across the screen, 23cm/sec). We calculated the distance travelled across the screen per second, for each of the linear velocities, and converted this into km/hr, by com-paring the length of the character on screen to an average human height. It was found that V1 was approximately the typical speed of a normal walker, 4km/hr, V2 was higher 9km/hr and V3 was 13km/hr which was similar to the speed of an olympic race walker. Such linear velocities of charac-ters across the screen are achieved, for example, if walking characters are viewed from a camera moving rapidly through a scene.
We split the 4 linear velocities into four separate experiment blocks, as we felt that viewing all linear velocities together would result in a long and tiring experiment with no break, and might confuse the participant as the character would be-gin the animation at different areas on the screen. In order to generate movies of the same length (2 seconds), using the normal and complex walks at the three different cycle rates, at the four different linear velocities, we chose to animate the character on the spot, but to move the camera viewing the character by 3 different amounts, resulting in the char-acter moving at velocities V1, V2 and V3 across the screen. Two-second movies were generated for each of the walks, at each cycle rate, at each linear velocity, for the 10 different update rates, each with 3 repetitions. A white background was used in order to provide good contrast and we did not use a ground plane (and therefore did not project shadows) as we did not need perspective, and did not want any dis-tracting factors that could distort our results.
In Block 1 we tested the effect of the normal and complex walk at each of the cycle rates, with the character walking on the spot (V0). The goal was to find 50% threshold values from the range of 10 update rates, for each of the condi-tions. One hundred and eighty movies were viewed in this experiment: 2 walk animations (normal and complex)* 3 cy-cle rates (Lo, Med, Hi) * 10 update rates * 3 repetitions. The movies were randomly placed in a playlist, with a
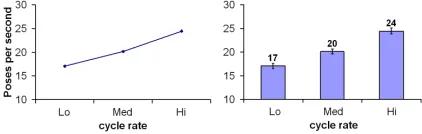
two-Figure 5:(l) Cycle rate main effect. (r) Mean 50% threshold values for cycle rate. Error bars show the standard error of the mean.
second blank video in between. Blocks 2, 3 and 4 were the same as Block 1, except that the distance travelled across the screen by the character was V1, V2 and V3 respectively throughout the block.
Before the experiment, participants were shown examples of ‘smooth’ and ‘jerky’ animations of a different character, on the spot and travelling at V3, and were told to focus on the smoothness of the character’s animation itself when making their judgements.
Participants viewed all four blocks (each 12 minutes), with a one minute break in between each block. We randomly ordered Blocks 1 to 4 for each participant, to avoid any fatigue or learning effects, and presented them with a ran-domly ordered playlist. As before, they were asked to indi-cate whether the animation looked “smooth” or “jerky” at each trial, and we randomly chose the left or right buttons on the laptop mouse as input per participant.
Analysis
As in the baseline experiment, we fitted psychometric curves to participants’ data for each of the conditions, and were thus able to calculate their 50% threshold values. We could not fit meaningful psychometric curves to the data for four of the participants, which indicated that they were inconsistent in their decisions on smoothness throughout the entire study. Four further participants had large amounts of inconsistent data which was evident from the large standard deviation values of their psychometric curves. Therefore, we removed the data for all 8 participants (4M, 4F) in order to be able to perform a full 3-way ANOVA on the data.
There were three different factors (motion complexity, cy-cle rate and linear velocity), therefore a three factor ANOVA with repeated measures was performed on all of the data. We found a main effect of motion complexity (F1,22=28,P< 0.00003), where the average 50% threshold value for the
normal walk was 19pps and the average for the complex walk was 22pps, indicating that the walk with added bod-ily movement needed more updates than the normal walk. As there were only two variables, no post-hoc analysis was necessary.
[image:5.595.313.524.82.149.2]Figure 6: (l) Linear Velocity main effect. (r) Mean 50% threshold values for Linear Velocity. Error bars show the standard error of the mean.
among means. We found that 50% threshold values for all three velocities were statistically significant from each other, (with P<0.003 in all cases).
Finally, there was a main effect of linear velocity (F3,66= 7,P<0.0004), indicating that different update rates were
needed for the four velocities - V0 to V3 (Figure6). A post-hoc analysis showed us that there was no statistically signifi-cant difference between V0 and V1 or V2 and V3. However, there was statistical difference between V0 and V2 and V3 and between V1 and V2 and V3, which indicated that it was not the level of cycle rate that seemed to have an effect, but rather the presence of high linear velocity or low linear ve-locity.
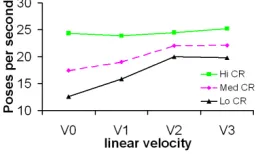
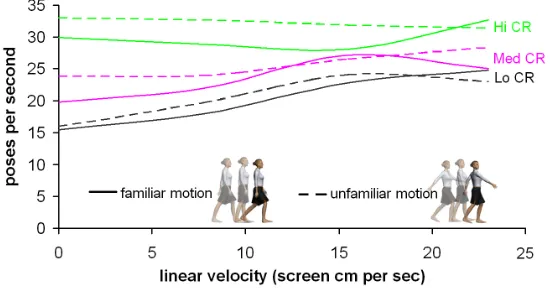
Figure 7:Interaction effect between Linear Velocity and Cy-cle Rate (CR).
Interestingly, we also found an interaction effect between linear velocity and cycle rate (Figure7). It can be seen that for the high cycle rate, the linear velocity had almost no effect, whereas it had an effect for low and medium cycle rate. This implies that for animations with high cycle rates, a high update rate is needed regardless of the linear velocity, whereas for animations with low and medium cycle rates, it is possible to get away with fewer updates for lower linear velocities. There were no other interaction effects.
In Figure8(l)and(r)we have plotted mean 50% threshold values. It can clearly be seen from these graphs that there is a difference between the thresholds for each cycle rate, and that the effect of camera decreases with increasing cycle rate.
[image:6.595.316.526.84.166.2]Another interesting result was the main effect of motion complexity. As there was also a main effect of cycle rate, it was clear that the walk with added motion complexity needed more updates than the normal walk, but not more than either of the motions at the next cycle rate up, (e.g., the walk with added motion complexity at low cycle rate needed
Figure 8:(l) 50% threshold values for normal walk. (r) 50% threshold values for complex walk. Error bars show the stan-dard error of the mean. CR=Cycle Rate.
fewer updates than the normal walk at medium cycle rate). In order to explain this effect, we thought that perhaps the angular velocity of the main moving joints at the different cycle rates could have been a factor. For this to have been the case, the angular velocity of the arms at the low cycle rate should have been lower than the angular velocity of the legs in the medium cycle rate, but in fact it was actually twice that of the legs (and higher than the medium cycle legs), so we rejected this explanation. We then hypothesized that the effect of complex motion may have had something to do with extra motion being displayed on the screen, or the familiar-ity of the motion, as the complex motion was an unfamiliar motion.
In order to address this issue, we repeated Block 1 (with linear velocity at V0 for the entire experiment) on eleven participants (2F, 9M), but with the screen rotated by 180◦
(inspired by similar experiments on point-light walkers, as discussed in Section2and in Dittrich [Dit93]). Surprisingly, we observed that the 50% threshold values were similar to those for the right side up character. We found that, as before, there was a main effect of cycle rate (P≈0). However, this
time there was no effect of motion complexity. This might indicate that when displayed the right way up, participants used their basic perception of motion when determining the smoothness at different cycle rates, but used a higher cogni-tive level with knowledge of walkers to separate out familiar from unfamiliar motions. This resulted in added sensitivity to unfamiliar motions. When placed upside-down, all mo-tions were unfamiliar and so we resorted to our basic per-ception of smoothness for both cycle rate and complexity of motion, which resulted in no added sensitivity to complex motions.
5. Simulation Level of Detail (SLOD)
[image:6.595.115.244.360.437.2]5.1. SLOD Experiments
For memory critical systems such as real-time crowds using impostors, the fewer poses required to make an animation appear smooth the better. We have provided thresholds of acceptability for different characters, depending on their cy-cle rate, complexity and the amount of camera motion in the scene. However, we have not yet established whether differ-ent pose updates would be acceptable if displayed together in one scene as our previous experiments showed one image at a time. Therefore, in this experiment, we consider simula-tion level of detail by examining the effect of its implemen-tation on perceived motion smoothness. We give participants a discrimination task, in which they can view two pose up-date rates simultaneously and make their decisions based on a comparison of the two.
SLOD Experiment 1
Seventeen participants (3F, 14M) took part, all with normal or corrected to normal vision. All were either computer sci-ence or engineering students or had an interest in computer games. The experimental setup was the same as in the previ-ous experiments. This time participants were asked at every trial “are all of the characters moving smoothly?” and used the laptop mouse to input the answer ‘yes’ or ‘no’.
We used the same character as in the previous experiments (character 2), animated with the normal walk at the medium cycle rate and travelling at V1. This time, the character walked at V1 across the screen and the camera remained stationary, in order to produce a more natural looking sce-nario. Each movie displayed one character in the front and a group of characters in the back (all characters used the same model). The characters in the background were updated at 5 different rates, ranging from 5 to 30pps, and this was the stimulus level - again, using the method of constant stimuli, we wished to determine the thresholds among the 5 update rates at which all characters appeared smooth, for each set of conditions. A ground plane, white with far spaced black vertical lines, was shown in this experiment in order for par-ticipants to be able to judge the relative distance between the background and foreground characters. This provided tance and perspective cues without causing too much dis-traction (see color plate Figure 1).
This experiment had a 3-way design. The first condition was walk type: in step(i.e., all characters started at the same pose, and moved like an army) orout of step(i.e., all char-acters started at different poses which represented a more natural setting for a crowd of pedestrians.); the second condi-tion was background group size:small(1 character),medium
(6 characters) orlarge(12 characters); and the third condi-tion was foreground character update rate:update1(30pps, which from our previous experiment we know to be the threshold at which 99% of participants perceived the mo-tion presented in this experiment to be smooth) orupdate2
(20pps, the threshold with a 75% probability of being per-ceived smooth). There were 90 two-second movies
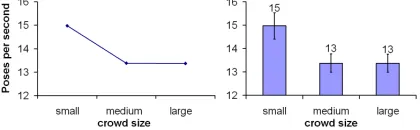
gener-Figure 9:(l) Crowd size main effect. (r) Mean 50% threshold values for Crowd Size.
ated in total: 3 crowd sizes * 2 walk conditions * 5 back-ground update rates * 3 repetitions. Random playlists were generated from these movies for each participant.
SLOD Experiment 2
We also wished to examine how a more natural scenario, such as that found in games, would affect our results. There-fore, we compared the ‘out of step’ large group from SLOD Experiment 1 to a new ‘out of step’ large crowd where all characters were different and appeared in a more complex background scene (see color plate Figure 2), depicting a blue sky and two cars parked on a pavement behind the charac-ters. The ground plane in this experiment was a tiled gravel plane, which still provided distance cues, but in a more real-world setting. We hypothesized that the more natural crowd would mask the differences between the update rates more than the controlled crowd, due to the distracting factors. Fourteen participants (11M, 3F) took part in this experiment, and the method was the same as in SLOD Experiment 1.
Analysis
As before, we found 50% threshold values for each partici-pant, for each condition. A 3-factor ANOVA was then per-formed on all of the data in SLOD Experiment 1 in order to determine the main effects and interactions.
There was a main effect of group size (F2,32=4,P<0.03). As before, we used Newman-Keuls tests to perform post-hoc analysis and found that the small crowd was signifi-cantly different from the medium and large crowds, but there was no statistical difference between the medium and large crowd. This implies that it is the presence or absence of mul-tiple background characters that has the effect and not the actual crowd size (Figure9).
Surprisingly, there was no main effect of foreground charac-ter update rate, i.e., participants were equally likely to per-ceive all characters to be smooth at a particular update rate, irrespective of whether the front character was updated at 30 or 20pps. There was also no main effect of walk type, which shows that participants were equally likely to find all characters smooth for a given update rate, regardless of the synchronicity of their motions (Figure10). There was one interaction effect between crowd size and walk type (F2,32=4,P<0.03). On further investigation we found that the main effect found for group size only held for in step characters, but not for out of step characters.
[image:7.595.314.524.84.149.2]Figure 10:Interaction effect between crowd size and walk type.
was performed on the data as we had two different condi-tions - update rate of foreground character (20 and 30pps) and crowd setting (natural and experiment setting). We found that there was no significant effect of foreground char-acter update rate as before, but also found that surprisingly there was no significant effect of scene complexity.
5.2. Sorting Experiment
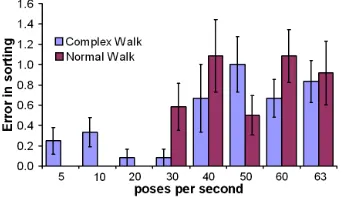
We found in our movement experiment that for participants to find a motion smooth 80% of the time, no more than 35pps were needed (Figure12), even for the most complex motion that we depicted in our study. However, while 35pps may be sufficient for smooth animations, it may not be the upper limit for highly realistic animations. Therefore, in this short experiment, we attempted to determine whether 35pps is the smoothest possible (at least for the scenarios we are depict-ing) or whether people would find higher pose rates even smoother. Therefore, we tested people’s ability to directly compare a number of different pose update rates and cor-rectly sort them from most jerky to most smooth. We used a similar approach to [MSCO06], where we placed 8 dif-ferent movies on the screen and asked participants to move them around until they were in the correct order of increas-ing smoothness. Twelve participants (3F, 9M) took part in this experiment, all with normal or corrected to normal vi-sion.
We placed 8 movies of one of the motions randomly on the screen, each playing in a loop and using one of 8 differ-ent update rates ranging from 5 to 63pps. In order to ensure that the monitor was actually displaying these rates correctly on the screen, we again recorded the screen using a 60fps high speed camera. On playing back the recording frame by frame, we could see that all of the movies up to 60pps were displaying correctly, and there were no frames dropped. The experiment was divided into two blocks, where the first block showed all of the 8 different update rates on the screen using the normal walk from the Movement Experiment at a medium cycle rate. The second block was similar except that the complex walk with a high cycle rate was used. The nor-mal walk was typical of the speed of a pedestrian, whereas the complex walk was considered our worst case scenario. We recorded the sequence in which the twelve participants ordered the different movies and compared them to the cor-rect sequence. To analyze these results we assigned a penalty of x for each of the movies that were not placed in the
cor-Figure 11:Interaction effect between walk type and pose update rate.
rect order, with x corresponding to the number of places that the movie deviated from its correct placing in our ceived stiffness scale. A two-factor ANOVA was then per-formed over the full dataset. It was found that there was no significant effect of walk type, with participants find-ing the complex walk just as difficult to sort as the normal walk. There was a significant main effect of pose update rate (F1,7=6.11,P≈0). Post hoc analysis showed that partic-ipants found rates 5-20 equally easy to sort, whereas they found rates 40-63 equally difficult to sort, and the order-ing errors of rates 5-20 were statistically significantly differ-ent to rates 40-63 (all statistical differences withP<0.04).
Pose update rate 30 was somewhere in-between, being nei-ther significantly different from the 5-20 nor 40, 50 and 63. It was found to be statistically significantly different from 60pps however (P<0.04), implying that participants found
it easier to place 30pps in the correct position than 60pps. The fact that participants found rates 40-63 equally diffi-cult to sort suggests that they had trouble in seeing the dif-ferences between them, and therefore found all four to be equally smooth. There was also a significant interaction ef-fect (F1,7=2.8,P<0.02) (Figure11). This implies that par-ticipants’ errors in sorting differed for normal and complex walks at certain pose update rates.
In order to test if a CRT monitor would have produced sim-ilar results, we repeated the second block on 12 naive par-ticipants using a 21-inch CRT monitor instead of the LCD, but using the same workstation. We found that participants found the top rates (40pps and above) just as difficult to sort on the CRT as the LCD. When we compared the results sta-tistically we found that monitor type did not have an signifi-cant effect.
6. Conclusions and Future Work
We have presented the first perceptual analysis of the factors that affect the choice of pose update rate for smooth ani-mation of virtual characters. We have discovered interesting results that can provide helpful guidance to developers in or-der to choose optimal update rates for the characters in their applications.
[image:8.595.335.506.90.189.2]Figure 12:(l) Thresholds for 80% probability of acceptance for normal walk. (r) Thresholds for 80% probability of ac-ceptance for complex walk. Error bars show the standard error of the mean. CR=Cycle Rate.
Figure 13:Average probability of acceptance curves for Cy-cle Rate.
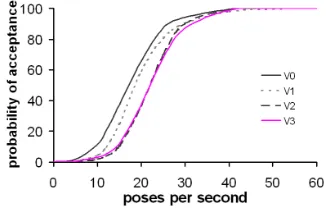
Figure 14: Average probability of acceptance curves for Linear Velocity.
the time). We felt that these values could be of practical use to developers since the thresholds at this level were reason-able for real-time performance. Color plate Figure 3 depicts these values in a more useful way for developers to choose the correct update rates for their particular animations. In order to better view the behavior of the participants, we plotted average psychometric probability curves (Figures13
and14) derived from all of the data, using the average of all participants’ 50% threshold values (µ) and standard devia-tions (σ) in Equation1:
f(θ;µ,σ) = 1 2πµe
−((θ−µ)2σ22) (1)
Whereθis a parameter that ranges from 0 to 100% prob-ability of acceptance. These graphs show the different pose update rates necessary for participants to judge a motion as
smooth for a range of different acceptability levels (i.e., from 0 to 100%). It can be seen that the curves become linear at 40pps, which implies that 40pps is the rate at which par-ticipants judged all of the motions used in the movement experiments to be smooth 100% of the time. Our sorting ex-periment validated that a threshold of approximately 40pps was considered to be the point at which animations began looking really smooth, since participants found it difficult to see the difference in smoothness for levels above 40pps. These results will perhaps be of most use (and immedi-ately applicable) for real-time character simulation, partic-ularly when the characters have cyclical motions. In a pre-processing step, each motion could be labeled with an opti-mal update rate, based on the cyclical update rate and com-plexity of the motion. At run-time, this rate for all characters could change priority when the camera is moving fast, to ac-count for the added jerkiness which occurs with fast camera motion.
In order for our SLOD experiment results to be of use to developers, we analyzed the 80% probability of acceptance values, estimated from participants’ psychometric curves. We found that 16pps was considered sufficient for all back-ground characters that we tested (at 80% probability of ac-ceptance there was no significant main effect of crowd size, walk type, or foreground character update rate). This re-sult could be of great benefit to LOD crowd systems in particular. At present, in hybrid geometry/impostor crowds (e.g., [DHOO05]), 10pps are used for both foreground and background characters due to the memory consumption of impostors. However, this rate results in jerky looking anima-tion. Using 30pps for the geometry and 10pps for the im-postors resulted in noticeable differences, and using 30pps for the impostors is too costly in terms of memory. If, as our results suggest, it is possible to display geometry at 30pps and impostors at 16pps without observers noticing the differ-ence, this will result in the ability to store double the num-ber of characters in memory than would be possible if the impostors were being displayed at 30pps.
We plugged this value of 16pps for background characters into a simple geometry/impostor crowd scenario and found the differences in SLOD to be imperceptible (as shown in the supplemental video). Although the differences were imper-ceptible in the example we tested, all of the characters were walking on the spot and so switching between update rates as the characters moved from foreground to background was not present. In the future, we would like to extend our study to include an analysis of the effect of the switch. Also, it would be interesting to extend the SLOD experiments in or-der to test if lower pose update rates could be used for char-acters in the distance, and to investigate if an extremely low pose update rate (e.g., 2 poses per second) would ever be sufficient.
Limitations
[image:9.595.97.260.382.486.2]step for mocap databases). However, the baseline experiment motions were not cyclical, but we can see that the thresh-old levels that they produced were in the same range as for the cyclical motions. It would be interesting to find an ap-propriate alternative to the cycle rate factor for non-cyclical motions. A promising direction for future work would be to implement a pre-processing step for automatic annotation of motions in a motion capture database with optimal update rates.
Although we picked an LCD monitor that was recognized as good for gaming, we still saw some minor ghosting when we played back the frames of animation after being captured on our 60fps video camera. This ghosting could have added a slight motion blur effect to the animations which would mean that the thresholds might differ on this monitor to a CRT monitor or DLP projector. When we tested our sorting experiment on a CRT we found no effect of monitor type, which indicates that our results should hold for CRTs. How-ever, a more thorough investigation of the effect of monitor type would be of benefit.
For the majority of the experiments, characters were viewed from the side profile. This view was chosen as we wanted to change the maximum number of pixels per pose (i.e., a ’worst case’ scenario). The effect of view angle is something that we would like to investigate further.
Motion blur is also a factor that we did not consider in these experiments. It would be interesting to analyze the effect of motion blur on our perception of smoothness, and whether the thresholds could be significantly reduced when motion blur is added.
Acknowledgements
We would like to thank the reviewers for their helpful com-ments. This work was supported by Science Foundation Ire-land.
References
[Ari06] ARIKANO.: Compression of motion capture
data-bases.ACM Transactions on Graphics 25, 3 (2006), 890– 897.
[CH97] CARLSON D. A., HODGINS J. K.: Simulation
levels of detail for real-time animation. InProceedings of the conference on Graphics interface ’97(1997), pp. 1–8.
[DHOO05] DOBBYN S., HAMILL J., O’CONOR K.,
O’SULLIVANC.: Geopostors: a real-time geometry / im-postor crowd rendering system. InSI3D ’05: Proceedings of the 2005 symposium on Interactive 3D graphics and games(2005), pp. 95–102.
[Dit93] DITTRICHW.: Action categories and the
percep-tion of biological mopercep-tion.Perception 22, 1 (1993), 15–22.
[HOT98] HODGINSJ., O’BRIEN J., TUMBLINJ.:
Per-ception of human motion with different geometric mod-els. IEEE Transactions on Visualization and Computer Graphics 4, 4 (1998), 307–316.
[HRvdP04] HARRISON J., RENSINK R. A., VAN DE
PANNEM.: Obscuring length changes during animated
motion. ACM Transactions on Graphics 23, 3 (2004),
569–573.
[Joh73] JOHANSSONG.: Visual perception of biological
motion and a model for its analysis. Perception and Psy-chophysics 14, 2 (1973), 201–211.
[Lan54] LANDISC.: Determinants of the critical flicker-fusion threshold. Physiological Reviews 34(1954), 259– 286.
[MRW92] MATHERG., RADFORDK., WESTS.:
Low-level visual processing of biological motion. In Proceed-ings of the Royal Society of London, Series B (1992), vol. 249, pp. 149–155.
[MSCO06] MCDONNELLR., S.DOBBYN, COLLINSS.,
O’SULLIVANC.: Perceptual evaluation of LOD cloth-ing for virtual humans. InProceedings of the 2006 ACM SIGGRAPH/Eurographics Symposium on Computer Ani-mation(2006), pp. 117–126.
[OHJ00] OESKERM., HECHTH., JUNGB.:
Psychologi-cal evidence for unconscious processing of detail in real-time animation of multiple characters. Journal of Visual-ization and Computer Animation 11, 2 (2000), 105–112.
[PdHCM∗06] PETTRE J., DE HERAS CIECHOMSKI P.,
MAÏM J., YERSIN B., LAUMOND J.-P., THALMANN
D.: Real-time navigating crowds: Scalable simulation
and rendering. Computer Animation and Virtual World
(CAVW) Journal - CASA 2006 special issue 17 (2006), 445–455.
[Rog83] ROGOWITZB. E.: The human visual system: A
guide for the display technologist. InSociety for Informa-tion Display(1983), vol. 24/3, pp. 235–252.
[RP03] REITSMAP., POLLARDN.: Perceptual metrics for character animation: Sensitivity to errors in ballistic mo-tion. ACM Transactions on Graphics 22, 3 (2003), 537– 542.
[SHP04] SAFONOVA A., HODGINS J. K., POLLARD
N. S.: Synthesizing physically realistic human motion in low-dimensional, behavior-specific spaces. ACM Trans-actions on Graphics 23, 3 (2004), 514–521.
[WAF86] WATSON A., AHUMADA A., FARRELL J.:
Window of visibility: a psychophysical theory of fidelity in time-sampled visual motion displays. Journal of the Optical Society of America A 3, 3 (1986), 300–307.
[WB04] WANGJ., BODENHEIMER B.: Computing the
duration of motion transitions: an empirical approach. In
Figure 1:Crowd in experiment setup.
Figure 2:Crowd in game setting used in SLOD experiment 2. Characters have different form and color from one another and background is not white.
[image:11.595.162.437.453.597.2]