International Journal of Emerging Technology and Advanced Engineering
Website: www.ijetae.com (ISSN 2250-2459, ISO 9001:2008 Certified Journal, Volume 6, Issue 5, May 2016)
329
A Meta-Heuristic Approach for Optimization of Different
Parameter of a Solar Air Heater with Artificial Roughness
Anup Kumar
1, Apurba Layek
21,2Department of Mechanical Engineering, National Institute of Technology Durgapur, West Bengal, India
Abstract— Teaching–Learning-Based Optimization (TLBO) is a modern and optimist meta-heuristic method which referred in this paper for optimizing of design and operating parameters for solar air heater. Thermal performance is accomplished for different set of values of Relative roughness pitch, Relative roughness height, Relative groove position, chamfered angle and Reynolds number by using Teaching Learning base optimization algorithm. The iteration results obtained from this algorithm are scrutinized with experimental results and found to be satisfactory as far as flexibility, convergence rate and computational effort.
Keywords—TLBO, Solar air heater, artificially roughness, Thermal Performance.
I. INTRODUCTION
Energy is an essential need for human being and also influences the economic development. The precise sources of conventional fuels made attention of researchers to renewable energies in recent years. Out of non-conventional resources, solar energy is free of cost abundantly available on earth in the form of radiation. Solar collectors are widely used for utilization of solar energy for various applications. Solar air heaters are easy to design and no complex mechanism is involved in it and also it is economical [4].
The solar air heaters are having low thermal efficiency due to two reasons: i) low thermal capacity of air and ii) a low heat transfer co-efficient between the absorber plate and air flow through duct. [2].
Thermal performance may be increased by two ways: i) increase the area of absorbing surface by using fins. ii) create the turbulence on the heat transferring surfaces [2]. For this reason, solar collector surfaces are either roughened or corrugated to increase the thermal performance.
Various optimization techniques which are either stochastic or deterministic in nature required for optimization of the parameter‘s value effecting thermal performance of solar air heater [3].
Various researchers initiated using different soft computing technique such as genetic algorithm (GA), particle swarm optimization (PSO) etc. Kalogirou, S.A [5] has applied a combination of artificial neural-networks (ANNs) and genetic algorithms (GAs) implemented to optimize a flat plate solar collectors system with maximize its life cycle savings on an industrial heating process system. Kalogirou,S.A [6] had used ANN to estimate the performance parameters of flat plate solar collectors and obtained results are compared with actual experimental values. Varun and Siddhartha [7] used GA and PSO [9] technique for optimization for thermal performance of solar air heater with flat absorber plate. Varun et al.[8] applied stochastic iterative perturbation technique to examine the optimal thermal performance of flat plate solar air heater. TLBO algorithm achieve less computational time and degree in multi objective problem [10]
In this current work, an attempt has been carried out to exploit the TLBO technique to obtain the optimal thermal performance of a solar air heater with artificial roughness parameters. The operating parameters used in this study includes relative roughness pitch(P/e),relative roughness height(e/Dh) ,relative groove position (g/P), chamfer angle
and Reynolds number are calculated by the proposed technique and finally, the thermal efficiency is estimated.
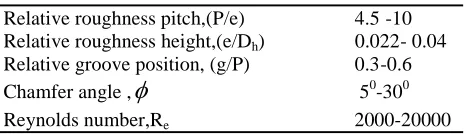
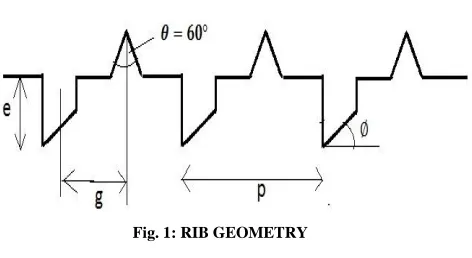
[image:1.612.330.562.613.680.2]A. Roughness Geometry and Range of Parameters The general geometry of the chamfered rib-groove roughness [15] on absorber plate is shown in fig.1. The parameters are been expressed in the form of the following dimensionless roughness parameters [15-18] and their range are given in table 1
Table 1: Range of parameter
Relative roughness pitch,(P/e) 4.5 -10 Relative roughness height,(e/Dh) 0.022- 0.04
International Journal of Emerging Technology and Advanced Engineering
Website: www.ijetae.com (ISSN 2250-2459, ISO 9001:2008 Certified Journal, Volume 6, Issue 5, May 2016)
[image:2.612.333.543.111.270.2]330
Fig. 1: RIB GEOMETRY
II. TLBOMETHOLOGY
Teaching–learning-based optimization is nature-inspired algorithm proposed by Rao [11] which is based on the impact on learners output by a teacher in a class. In this algorithm, a group of learners are considered as population and different learning subjects are considered as different design parameters and a learner‘s result is consider as analogous to the ‗fitness‘ value for the optimization problem. The teacher is the best result for the entire population [9].
The working of TLBO algorithm is classified into two parts, ‗Teacher phase‘ and ‗Learner phase‘. Let assume two different teachers, T1 and T2, are teaching a subject of same
content to the same merit level learners in two different classes. Fig 2 shows marks distribution obtained by the learners of two different classes evaluated by the respective teachers. A curve 1 and 2 represents the marks obtained by the learners taught by teacher T1 and T2 respectively. Marks
obtained are assumed to be normal distributions. Normal distribution is defined as:
1
2 2
exp / 2 2f X x
(1)
Where 2is the variance, is the mean and x is any
value of which normal distribution function is required. It is observed from 3Fig 2 that curve-2 represents better results than curve-1 and so it concludes that teacher T2 is
better than teacher T1 in terms of teaching. The main
difference between both the results is their mean (M1 & M2
are respective mean for curve-1 and curve-2).This shows that a good teacher acquire a better mean for the results of the learners. Learners also learn from interaction between themselves, which also helps in their results [11-14].
Fig 2: Distribution of marks obtained by learners taught by two different teachers[10]
Fig 3 shows Probability density with marks obtained for learners in a class having mean MA and MB for curve-A and
curve-B respectively. Teacher is assumed to be most knowledgeable person in the society, so the teacher is the best learner, and this is shown by TA in Fig 3. Learners
which increase the knowledge level of the entire class and help learners to get better marks. So, a teacher will try to increase the mean of the class according to his or her capability. In Fig 3, teacher TA will make his or her effort
to move mean MA towards their own level, thereby
increasing the learner‘s level to a new mean MB. Teacher
TA will try to put maximum effort into teaching, but
students will gain knowledge according to the teaching method adopted by the teacher and the quality of students present in the class, [11-14]. The qualities of the students are examined from the mean value of the population. Teacher TA puts efforts in so as to increase the quality of
the students from MA to MB, the students require a new
teacher, i.e. in this case the new teacher is TB. Hence, there
is new curve-B with new teacher TB. The teacher tries to
expand knowledge among the method which uses a population of solutions to proceed to the global solution [11].
A. Teacher Phase
As shown in Figure 3, a good teacher influence mean of a class leads increment from MA to MB. A good teacher
tries to bring his or her learners up to his or her level in terms of knowledge. But in reality this is not possible and a teacher can only improve the mean of a class up to some extent depending on the capability of the class. This
[image:2.612.58.294.152.281.2]International Journal of Emerging Technology and Advanced Engineering
Website: www.ijetae.com (ISSN 2250-2459, ISO 9001:2008 Certified Journal, Volume 6, Issue 5, May 2016)
[image:3.612.65.264.130.285.2]331
Fig 3: Model for obtained marks distribution for a group of learners[10]
Let Mi be the mean and Ti be the teacher at any iteration
i. Ti will try to move mean Mi towards its own level, so
now the new mean will be Ti designated as Mnew. The
solution is modernized according to the difference between the existing and the new mean given by [11]-[14].
_M i new F i
Difference eanr M T M (2)
where TF is a teaching factor that decides the value of
the mean to be changed, and ri is a random number in the
range (0, 1).
The value of TF can be either 1 or 2 which is heuristic
step in nature and randomly decided with equal probability [11]-[14].
1 0,1 2 1 F
T round rand (3)
This difference modifies the existing solution according to the following expression:
, , _Mean
new i old i i
X X Difference (4)
B. Learner Phase
Learners enhance their knowledge by two different ways: firstly, from the teacher input and secondary, through interaction between themselves. A learner interacts with other learners randomly with the help of formal communications, group discussions, presentations, etc. If the other learner is more knowledge than him or her, then learner learns something[11]-[14].
For i=1; and initial population size (Pn)
Randomly select another learner Xj such that ij
If f Xi f Xj
, , (X X )
new i old i i i j
X X r (5)
Else
, , (X X )
new i old i i j i
X X r
(6)
Accept Xnew if it gives a better function value.
III. PROBLEM FORMULATION
The objective function for thermal performance of solar air heater with chamfered rib groove roughness on absorber plate can be proposed as:
Maximize: o o i o
T T
F U
S
(7)
The different relations used for calculating overall loss coefficient (U0), heat removal factor at outlet (F0) and
temperature rise are computed by equations:
1 1 0.264 0.46 0.21 2 2 1 2 2 12.75 cos (T 1 1 1 p gp g s
p g p g
o
p g
g
w g g a g a
g
T T
T T L
T T T
U
t
h T T T T
k (8) b i
U K t (9)
c i bL W L K U
LWt
(10)
o t b e
U U U U (11)
/ c
Gm A (12)
International Journal of Emerging Technology and Advanced Engineering
Website: www.ijetae.com (ISSN 2250-2459, ISO 9001:2008 Certified Journal, Volume 6, Issue 5, May 2016)
332
0.52 1.24 1.72 0.92 1.212
2
2
0.00225(e/ D) (P/ e)
(g/ P)
exp 0.46 ln
exp 0.74 ln g/ P
exp 0.22 ln
e
u
R
N P e
(14) 1 c c o h F h U (15) 1 1 exp p o o o p
Gc U F
F
U Gc
(16)
o(Tp T )ao i c
p S U
T T A
mc
(17)
The constraints of the problem are defined in Table 1.
A. Propsed TLBO Alogoritm
The performance of a solar air heater with chamfered rib-grooved can be determined on the basis of detailed consideration of heat transfer phenomena as ASHRAE Standards [1] the correlations for the coefficient of heat transfer developed by Layek [15]-[18].
Skeleton of an optimizing algorithm based on TLBO
Step 1: Initialize:
Step 2: Initialize number of students (population), termination criterion.
Step 3: Calculate the mean of each design variable
Step 4: Identify the best solution (teacher) Step 5: Modify solution based on best solution Xnew=Xold + r (Xteacher - (TF)Mean)
Step 6: Is new solution better than existing?
If, yes then, Select any two solutions randomly Xi
and Xj
Step 7: check that Xi better than Xj
Yes then, Xnew=Xold+ r (Xi-Xj)
No then, Xnew=Xold+ r (Xi-Xj)
Step 8: Is new solution better than existing? Check, Is termination criteria satisfied?
Step 9: If No, then, again calculate the mean of each design variable.
[image:4.612.49.288.113.374.2] [image:4.612.319.566.230.487.2]If yes, then obtained final value of solution
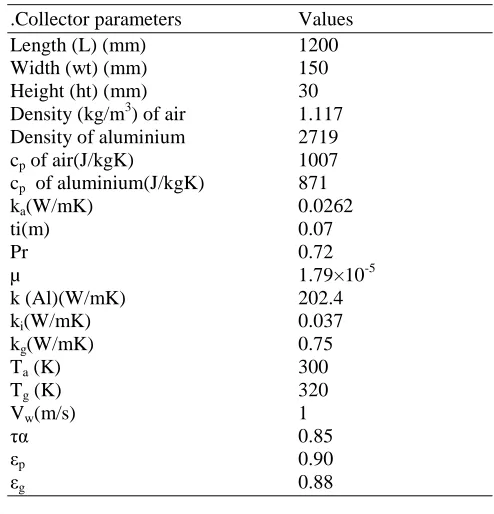
Table 2:
Typical values of system parameters
.Collector parameters Values
Length (L) (mm) 1200
Width (wt) (mm) 150
Height (ht) (mm) 30
Density (kg/m3) of air 1.117
Density of aluminium 2719
cp of air(J/kgK) 1007
cp of aluminium(J/kgK) 871
ka(W/mK) 0.0262
ti(m) 0.07
Pr 0.72
µ 1.79×10⁻⁵
k (Al)(W/mK) 202.4
ki(W/mK) 0.037
kg(W/mK) 0.75
Ta (K) 300
Tg (K) 320
Vw(m/s) 1
τα 0.85
εp 0.90
εg 0.88
IV. RESULTS AND DISCUSSION
In this work, the simulation is carried in MATLAB for different cases which are following:
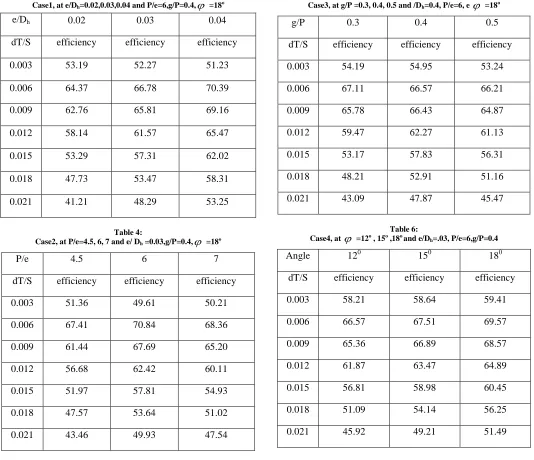
The TLBO iterations are shown in table no: 3, 4, 5, 6 for different respective case and the graph is been plotted.
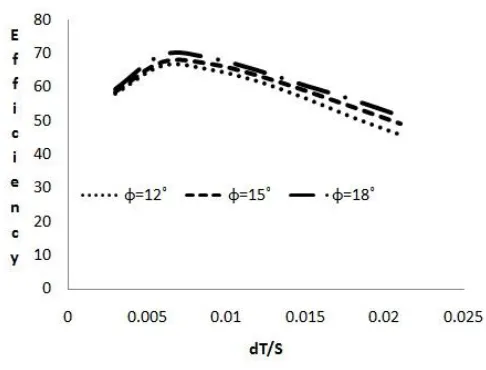
These graph showed in fig 4, fig 5, fig 6, and fig 7, helped to determine the optimum values of roughness parameters on the basis of thermal efficiency and function of temperature rise parameter.
The results from the proposed TLBO algorithm are also tested against experimental data [17]-[18] for assuring its authenticity and robustness.
When the algorithm was executed, it was found that the values of thermal efficiency obtained from this algorithm are in good harmony with experimental thermal efficiency (
)., W, ,
,
,
,
, Pr, ,
, k ,
,
,
,
, ,
,
,
e p p i a
w a p g
L
S R
c
k
m v
T T t
International Journal of Emerging Technology and Advanced Engineering
Website: www.ijetae.com (ISSN 2250-2459, ISO 9001:2008 Certified Journal, Volume 6, Issue 5, May 2016)
[image:5.612.40.574.143.603.2]333
Table 3:
Case1, at e/Dh=0.02,0.03,0.04 and P/e=6,g/P=0.4,
=18oe/Dh 0.02 0.03 0.04
dT/S efficiency efficiency efficiency
0.003 53.19 52.27 51.23
0.006 64.37 66.78 70.39
0.009 62.76 65.81 69.16
0.012 58.14 61.57 65.47
0.015 53.29 57.31 62.02
0.018 47.73 53.47 58.31
0.021 41.21 48.29 53.25
Table 4:
Case2, at P/e=4.5, 6, 7 and e/ Dh =0.03,g/P=0.4,
=18oP/e 4.5 6 7
dT/S efficiency efficiency efficiency
0.003 51.36 49.61 50.21
0.006 67.41 70.84 68.36
0.009 61.44 67.69 65.20
0.012 56.68 62.42 60.11
0.015 51.97 57.81 54.93
0.018 47.57 53.64 51.02
0.021 43.46 49.93 47.54
Table 5:
Case3, at g/P =0.3, 0.4, 0.5 and /Dh=0.4, P/e=6, e
=18og/P 0.3 0.4 0.5
dT/S efficiency efficiency efficiency
0.003 54.19 54.95 53.24
0.006 67.11 66.57 66.21
0.009 65.78 66.43 64.87
0.012 59.47 62.27 61.13
0.015 53.17 57.83 56.31
0.018 48.21 52.91 51.16
0.021 43.09 47.87 45.47
Table 6: Case4, at
=12o , 15o ,18o and e/Dh=.03, P/e=6,g/P=0.4
Angle 120 150 180
dT/S efficiency efficiency efficiency
0.003 58.21 58.64 59.41
0.006 66.57 67.51 69.57
0.009 65.36 66.89 68.57
0.012 61.87 63.47 64.89
0.015 56.81 58.98 60.45
0.018 51.09 54.14 56.25
International Journal of Emerging Technology and Advanced Engineering
Website: www.ijetae.com (ISSN 2250-2459, ISO 9001:2008 Certified Journal, Volume 6, Issue 5, May 2016)
[image:6.612.57.295.129.306.2]334
Fig.4: Effect of relative roughness height on efficiency
[image:6.612.332.575.131.316.2]Fig5: Effect of relative roughness pitch on efficiency
Fig 6: Effect of relative groove position on efficiency
Fig 7: Effect of chamfer angle on efficiency
This proves that the proposed algorithm gives a clear idea regarding operating parameters and domain of optimum set of solar air heater with artificial roughness.
V. CONCLUSIONS
1) The TLBO algorithm was successfully proposed for finding the optimal set of design and operating parameters at which thermal performance of solar air heater with artificial roughness could be maximum.
2)The maximum thermal efficiency based upon this algorithm was comes out to be 70.39% at optimal values at P/e=6,e/Dh =0.04,g/P=0.4,and
=180 .3)The algorithm assists the researcher to pursuit their design and operating variables for attainment of optimum value.
4)The different set of parameters implied to validate the algorithm with experimental results and shows good harmony results.
Nomenclature
Ap Area of absorber plate (m2) Ac Cross-sectional area of duct (m2) Dh Hydraulic diameter (m)
Fo Heat removal factor referred to outlet temperature (dimensionless) G Mass velocity (Kg/sm2)
h convective heat transfer coefficient(W/m2K) Vw Wind velocity (m/sec)
hw wind convection coefficient(W/m2K) S Solar radiation (W/m2)
m mass flow rate of air(Kg/sec) N number of glass cover Pr Prandtl number Re Reynolds number
[image:6.612.48.559.165.705.2]International Journal of Emerging Technology and Advanced Engineering
Website: www.ijetae.com (ISSN 2250-2459, ISO 9001:2008 Certified Journal, Volume 6, Issue 5, May 2016)
335
To outlet temperature of air (K)Tp Temperature of absorber plate (K) Uo overall heat loss coefficient (W/m2K) Ka Thermal conductivity of air (W/mK)
Ki Thermal conductivity of insulating material (W/mK) Ki Thermal conductivity of glass (W/mK)
Greek Alphabet
p
c Specific heat of air (J/kgK)
p
Emissivity of plate (dimensions)
g
Emissivity of glass (dimension)
i
Thickness of insulating material (m)
Transmittance-absorptance(dimensionless) Tilt Angle/ratio of orifice diameter to pipe diameter Thermal efficiencyREFERENCES
[1] ASHRAE Standards, ―Methods of testing to determine the thermal performance of solar collectors‖, New York, 93-77.
[2] Lewis M.J., 1975, ―Optimizing the thermo hydraulic performance of rough surfaces‖, International Journal Heat Mass Transfer, Vol18, pp.1243–1248.
[3] Duffie J.A, and Beckman WA., 1980, ―Solar engineering of thermal processes‖ New York: Wiley.
[4] Kalogirou S.A.,2004, ―Optimization of solar systems using artificial neural-networks and genetic algorithms‖, Applied Energy, pp.77-83. [5] Kalogirou S., A., 2006, ―Prediction of flat-plate collector
performance parameters using artificial neural networks‖, Solar Energy, pp.80-85.
[6] Varun and Siddhartha, 2010, ―Thermal performance optimization of a flat plate solar air heater using genetic algorithm‖, Applied Energy, pp.87-93.
[7] Varun, Sharma N., Bhat I.K., and Grover D., 2011,―Optimization of a smooth flat plate solar air heater using stochastic iterative perturbation technique‖, Solar Energy, pp.85-94.
[8] Varun, and Siddhartha, 2012, ―A particle swarm optimization algorithm for optimization of thermal performance of a smooth flat plate solar air heater‖ Applied Energy, pp.406-413.
[9] Repinsek M. C., Liu S.H., and Mernik L., 2012, ―A note on teaching–learning-based optimization algorithm‖, Inf. Sci.,pp 79–93. [10] Zou. F., Wang.L., Hei. X., Chen.D., and Wang.B.,2013, ―Multi-objective optimization using teaching-learning-based optimization algorithm, Engineering,Applications of Artificial Intelligence,‖ vol 26, pp.1291-1300
[11] Rao R.V.,Savsani V.J.,Vakharia D.P.,2011, ―Teaching–learning-based optimization: a novel method for constrained mechanical design optimization problems‖, Computer aided Design. vol 43, pp. 303–315.
[12] Rao R.V.,Savsani V.J.,Vakharia D.P.,2012, ―Teaching–learning-based optimization: an optimization method for continuous non-linear large scale problems‖, Inf. Sci.18, pp.1–15.
[13] Rao R.V., Patel V., 2012, ―An elitist teaching–learning-based optimization algorithm for solving complex constrained optimization problems‖, Int. J. Ind. Eng. Computer aided design, vol 3, pp.535– 560.
[14] Rao R.V.,Savsani V.J.,Vakharia D.P.,2011, ―Teaching–learning-based optimization: A novel method for constrained mechanical design optimization problems,‖ Computer-Aided Design, vol 43, 2011,pp.303-315.
[15] Layek A., Saini.J.S., Solanki S.C.,2007, ―Second law optimization of a solar air heater having chamfered rib–groove roughness on absorber plate‖, Renewable energy,pp.-1967-1980.
[16] Layek A., Saini.J.S., Solanki S.C.,2007, ―Heat transfer and friction characteristics for artificially roughened ducts with compound turbulators‖, International Journal of Heat and Mass transfer, pp.- 4845-4854.
[17] Layek A., Saini.J.S., Solanki S.C.,2008, ―Effect of chamfering on heat transfer and friction characteristics of solar air heater having absorber plate roughened with compound turbulators‖,Renewable energy,pp.-1290-1298.
![Fig 3: Model for obtained marks distribution for a group of learners[10]](https://thumb-us.123doks.com/thumbv2/123dok_us/8692335.877456/3.612.65.264.130.285/fig-model-obtained-marks-distribution-group-learners.webp)