C u r r e n t c o n di tio n a n d fu t u r e
d i r e c ti o n s fo r l e a n c o n s t r u c ti o n
in h i g h w a y s p r oj e c t s : a s m a ll
a n d m e d i u m-siz e d e n t e r p r i s e s
( S M E s) p e r s p e c tiv e
Tez el, A, Kos k el a , LJ a n d Aziz, Z U H
h t t p :// dx. d oi.o r g / 1 0 . 1 0 1 6 /j.ijp r o m a n . 2 0 1 7 . 1 0 . 0 0 4
T i t l e C u r r e n t c o n di tio n a n d fu t u r e d i r e c ti o n s fo r l e a n
c o n s t r u c ti o n in h i g h w a y s p r oj e c t s : a s m all a n d m e d i u m-siz e d e n t e r p r i s e s ( S M E s) p e r s p e c tiv e
A u t h o r s Tez el, A, Ko s k el a , LJ a n d Aziz, Z U H
Typ e Ar ticl e
U RL T hi s v e r si o n is a v ail a bl e a t :
h t t p :// u sir. s alfo r d . a c . u k /i d/ e p ri n t/ 4 4 4 0 9 /
P u b l i s h e d D a t e 2 0 1 7
U S IR is a d i gi t al c oll e c ti o n of t h e r e s e a r c h o u t p u t of t h e U n iv e r si ty of S alfo r d . W h e r e c o p y ri g h t p e r m i t s , f ull t e x t m a t e r i al h el d i n t h e r e p o si t o r y is m a d e f r e ely a v ail a bl e o nli n e a n d c a n b e r e a d , d o w nl o a d e d a n d c o pi e d fo r n o
n-c o m m e r n-ci al p r iv a t e s t u d y o r r e s e a r n-c h p u r p o s e s . Pl e a s e n-c h e n-c k t h e m a n u s n-c ri p t fo r a n y f u r t h e r c o p y ri g h t r e s t r i c ti o n s .
F o r m o r e i nfo r m a t io n , in cl u di n g o u r p olicy a n d s u b m i s sio n p r o c e d u r e , p l e a s e
1. Introduction
The construction industry has long been criticised for being inefficient, wasteful, a
high-risk/low-profit industry and “backward” in general when compared to some other major
industries (London and Kenley, 2001; Teo and Loosemore, 2001; Woudhuysen and Abley,
2004; Assaf and Al-Hejji, 2006; Smyth, 2010). Many of those criticisms can be traced to the
industry characteristics such as supply chain fragmentation (Vrijhoef and Koskela, 2000;
Dubois and Gadde, 2002; Baiden et al., 2006), construction companies’ high sensitiveness to
market conditions (Lo et al., 2007; Regat et al., 2010), lack of an industry-level strategic vision
(Green et al., 2005; Love et al.,2005), low-entry barriers to the industry coupled with
competitive tendering mechanisms and small profit margins (Rooke et al., 2004; Dikmen et al.,
2010), and short-term and temporary organisational configurations (Pauget and Wald, 2013;
Behera et al., 2015). Also, project management literature has displayed many examples of time
overruns (Hwang et al., 2014; Arashpour et al., 2016), cost overruns (Nasirzadeh et al., 2014;
Olawale and Sun, 2015), low productivity (Fulford and Standing, 2014), safety issues
(Nieto-Morote and Ruz-Vila, 2011; Wang and Yuan, 2011; Demirkesen and Arditi, 2015), and quality
problems (Zeng et al., 2007; Arashpour et al., 2017) in construction projects.
In the early 1990s, to improve the performance of the industry, some researchers advocated
developing a production management perspective in construction project management
practices through learning from the Japanese manufacturing industry (Koskela, 1992; Ballard
and Howell, 1998; Tommelein, 1998; Gao and Low, 2014; Tommelein, 2015), which had
attained a global competitive edge after Second World War by adopting certain production
management techniques and principles explained under the term Lean Production System
(LPS) (Womack et al., 1990; Fujimoto, 1999; Shah and Ward, 2007; Jasti and Kodali, 2015).
industry and construction project delivery mechanisms were accumulated and called Lean
Construction (LC) (Howell, 1999; Ballard and Howell, 2003; Tommelein, 2015).
In the UK, LC came under the spotlight with the Egan report, ‘Rethinking Construction’,
which was produced in 1998 to address concerns raised by clients engaging services of
construction companies (Egan, 1998). The aim of the report was to stimulate a change in the
culture, style and management of the industry (Forbes and Ahmed, 2011). However, after the
report, the dissemination of LC across the UK could not be realised as intended (Mossman,
2009; Sarhan and Fox, 2013). Around late 2000s, following grave criticisms for their project
management performances, large public construction clients in the country experienced serious
budget cuts and performance improvement targets by the government, which induced them to
initiate efforts associated with instilling LC capabilities into their supply chains (Ansel et al.,
2007; Chloe and Sue, 2012; Drysdale, 2013; Fullalove, 2013).
One of those large, civil projects clients is Highways England (HE), the organisation
responsible for delivering, operating, maintaining and improving England’s motorways and
major roads. In 2016, HE announced a strategic plan to attain 250 million GB £ in savings in
highways projects through LC between 2015 and 2020 (HE, 2016). This supply-chain level
and strategic LC implementation initiative led by a powerful public client (HE) created a rare
case for LC, which had not been implemented in the country’s construction industry as
intended. A major target in HE’s LC strategy is to disseminate LC across Small-Medium Sized
Enterprises (SMEs), companies operating with annual turnover not more than 50 million GB £
and with employees not more than 250 (DfBIS, 2012; EC, 2015). Despite constituting the
largest group in construction supply chains (Morton and Ross, 2008), the exploration of LC in
SMEs has been limited (Dainty et al., 2001; Barros Neto and Alves, 2007; Alves et al., 2009;
Alves et al., 2012). The issue has been mainly discussed from the innovation and supply chain
process, and to a lesser extent, the commercial side of LC implementations at specific projects
or specific construction organisations. Beyond generic remarks, the lack of in-depth,
sector-specific investigations (i.e. highways, rail, building, energy etc.) of LC in SMEs, covering
supply chain characteristics in project governance, project procurement, training and process
management is salient in the literature.
The research presented in this paper aims to explore two research questions;
(1) what are the current supply chain conditions defining how LC, a relatively new
phenomenon for civil project management, is being implemented (current condition) and,
(2) how LC can be further promoted (future direction) in the highways supply chain from
an SMEs perspective.
The research was sponsored by and conducted in cooperation with HE to inform future LC
strategies in civil projects. Also, the findings are deemed contributing to the current
understanding of LC in construction SMEs. In the rest of the paper, following a literature
review on LC and construction SMEs, and an explanation of the highways project delivery
context in the supply chain, the analysis and discussion of an explorative mixed-method study,
involving 20 face-to-face interviews with highways managers and a comprehensive
questionnaire survey with 110 responses on LC in highways SMEs, are presented.
2. Research background
2.1. Lean Construction and SMEs
LC presents a practice oriented research and development in construction management and
construction projects, which are seen as temporary production systems, with an adaption of the
LPS to the end-to-end design and construction process (Garnett et al., 1998; Howell, 1999;
like fragmented supply chains, strong focus on individual projects narrowing perspectives on
general supply development, relationships between actors influenced by a culture of conflict,
superficial supply chain integration practices, low-profit margins, frequent time and space
conflicts in on-site production, low output productivity and quality, noncompliance between
product design and on-site production, insufficient process and operations management
perspective in on-site production, poor safety records, working in silos, and a slow-take up of
innovation and change (Koskela, 1992; Shirazi et al., 1996; Vrijhoef and Koskela, 2000; Dainty
et al., 2002; Dubois and Gadde, 2002; Green and May, 2005; Assaf and Al-Hejji, 2006;
Segerstedt and Olofsson, 2010; Eadie et al., 2013; Behera et al., 2015; Tommelein, 2015;
Howell et al., 2017) can be mitigated through learnings from the LPS.
The origins of the LPS are traced back to the innovations on the shop-floors of Japanese
manufacturers, particularly at Toyota Motor Corporation, between the 1930s and the 1970s,
which were first conceived as improvement opportunities inspired by the mass automotive
manufacturing in the US (Monden, 1983; Shingo, 1986; Ohno, 1988; Fujimoto, 1999).
Following Japan’s successful post-war recovery and emergence as a global economic power,
Japanese manufacturing techniques have been benchmarked by Western manufacturers since
the 1970s (Drucker, 1971; Sugimori et al., 1977). Although the diffusion of the LPS had started
in discrete manufacturing industries in the West in the 1980s, the publication of a business
book, “The machine that changed the world” by Womack et al. (1990), fuelled a debate in both
the practitioner and academic communities concerning the applicability of the Lean approach
outside discrete, repetitive industries (Lyons et al., 2013). The start of discussions on the
applicability of the LPS in the construction industry concurred with this broader diffusion
period of Lean in other industries in the early 1990s. A recent market report by McGraw-Hill
(2013) documented the positive effect of LC in attaining higher construction project
knowledge and a limited understanding of LC by the industry. Similarly, after an in-depth study
of ten building projects in the United States and Canada, Cheng (2016) concluded that
Integrated Project Delivery (IPD), a relational contracting and partnering strategy, sets the
terms and provides the motivation for collaboration and the process based LC techniques
provide the means for construction teams to optimise their performance and achieve project
goals, further highlighting the need to approach Lean in construction with a process and a
supply chain management/ project governance perspective.
The basic principles of the LPS are frequently defined as (Lewis, 2000; Liker, 2004; Bhasin
and Burcher, 2006; Dennis, 2016):
(1) continuously focusing on elimination of the process wastes (i.e. motion, delay,
conveyance, correction, over- processing, inventory, over-production and knowledge) and
lead-time compression,
(2) increasing production stability through Visual Management, 5S and Total Productive
Maintenance (TPM),
(3) strandardising work through work design, cycle and takt time planning, layout and
equipment design and standard operating sheets,
(4) just-in-time (JIT) production with continuous material and component flow, pull
production with kanban cards and production levelling,
(5) batch size reduction,
(6) quality control at source with the jidoka principles and poka-yoke mistake proofing tools,
(7) ability to rapidly reconfigure production process and products through techniques like
Single Minute Exchange of Dies (SMED),
(8) multi-functional work teams grouped in production cells,
(9) continuous improvement through kaizen circle activities, and
However, many LPS accounts reiterating those principal characteristics were criticised for
explaining the LPS paradigm in an isolated fashion without taking strategic supply chain
parameters and marketplace requirements such as demand characteristics or stock holding
de-coupling points into account for the suitability of the LPS (Naylor et al., 1999; Christopher and
Towill, 2000; Christopher et al., 2006). Mason-Jones et al. (2000), Olhager (2003), Bruce et
al. (2004) and Agarwal et al. (2006) identified the distinguishing attributes of Lean supply, the
system of purchasing and supply chain management required to best underpin the LPS, in
which typical product is commodities, demand is predictable, product variety is low, product
life-cycle is long, customer driver is cost, profit margins are low and dominant costs are
physical costs. In Lean supply, beyond partnership, the entire flow from raw materials to
consumer is considered as an integrated whole in which the interfaces between stages are seen
as artificial, resources, information and know-how are often shared by creating a network of
suppliers to build a common understanding and learning (cross-enterprise collaboration), a
common management culture are built across the supply chain, and the effects of costs
associated with less than perfect execution of a sub-process are not limited to the location of
the execution (Lamming, 1996; MacDuffie and Helper, 1997; Vitasek et al., 2005; Myerson,
2012; Jasti and Kurra, 2017).
In the construction industry, according to Green and May (2005), LC deployments can be
categorised into three levels with increasing degree of sophistication; (1) process based LC
deployment efforts to reduce waste, variability, information deficiencies and to support
production and process flow and stability through some specific LC principles and techniques,
(2) arrangements to eliminate adversarial relations and to increase integration in construction
supply chains, and (3) a strategic change in the overall project governance toward partnering.
Similarly, the Lean Construction Institute (LCI) (2017) defines LC implementation in
(operating systems), (2) Integrated Project Delivery (IPD) strategies (commercial) and (3)
transformational change (organisational), mostly concerned with strategic decisions.
Currently, most of the discussions on LC deployments are around the process based
deployments as per Green and May’s (2005) and the LCI’s (2017) definitions. The main LC
principles at this level are (1) elimination of the process wastes (Terry and Smith, 2011;
Koskela et al., 2013), (2) effective management of the value stream (Garnett et al., 1998), (3)
maintaining a continuous and reliable flow of the production and process elements (Koskela et
al., 2002), (4) pull-based project planning and control (Ballard, 2000), (5) just-in-time delivery
of materials and components (Pheng and Chuan, 2001), and (6) instilling a continuous
improvement culture (Lapinski et al., 2006). Those underpinnings inspired by the LPS
principles led to the adoption of some operational techniques and practices in LC like the
collaborative and pull-based construction production planning and control framework – the
Last Planner System (Ballard and Howell, 1998; Priven and Sacks, 2016; Viana et al., 2016),
takt-planning and work structuring (Tsao et al., 2004), Visual Management (Tezel and Aziz,
2017), the 5S (Stehn and Höök, 2008), pull production control using kanban cards (Arbulu et
al., 2003; Khalfan et al., 2008; Ko and Kuo, 2015), quality at source and andon light boards
(Kemmer et al., 2006), Single Minute Exchange of Dies (SMED) (Filho et al., 2005),
poka-yoke mistake proofing systems (Tommelein, 2008), cell production units (Mariz et al., 2013),
Value Stream Mapping (Yu et al., 2009), Target Value Design (Zimina et al., 2012) and
Continuous Improvement Cells (Miron et al., 2016). The Last Planner System is almost the
only method specifically developed for the construction industry. There is evidence that many
Lean techniques developed in the manufacturing context under the LPS work well in the
construction context with some adaptation.
To commercially underpin the LC techniques and to liken the construction project
has been suggested (Matthews and Howell, 2005; Kent and Becerik-Gerber, 2010; Lahdenperä,
2012), which practically corresponds to the commercial leg in LC deployments as per Green
and May’s (2005) and the LCI’s (2017) definitions. In IPD, main construction project
supplying organisations act as an integrated unit through inter-contracts among each other
based on proportional profit/risk sharing as a compensation and incentive mechanism while
delivering a turnkey or design-build type construction project (American Institute of
Architects, 2007; Kent and Becerik-Gerber, 2010; Lahdenperä, 2012; Mesa et al., 2016).
However, IPD is subject to various barriers in the industry such as the unwillingness of the
industry to change its traditional supply and procurement methods (cultural), issues associated
with selecting compensation and incentive structures commensurate to the unique
characteristics of project suppliers (financial), liability and insurance issues (legal), and
ownership, liability and interoperability concerns in the integrated use of technology to achieve
collaboration (technological) (Kent and Becerik-Gerber, 2010; Ghassemi and Becerik-Gerber,
2011; Rached et al., 2014). The degree of IPD diffusion in construction remains still low, with
IPD mostly being adopted in the procurement of complex, fast-track construction projects
(NBS, 2015; Mesa et al., 2016).
Many of the criticisms for the current LC implementation discussions are based on the
assertion that they largely overlook some macro factors like the industry’s business and
economic context, market and supply dynamics, industry culture and its overall governance
(Green 1999; Barros Neto and Alves 2007; Alves et al. 2012; Wandahl, 2014; Cano et al.,
2015). Shortly, the amount of strategic and supply chain focused LC implementation
discussions have remained relatively narrow when compared to the discussions focusing
mostly on the production process, and to some extent, the procurement side of LC
implementations, which are more concerned with specific project cases and their conditions
while conducting a LC deployment research, beyond some specific LC techniques or mantras,
it was deemed necessary to take the less-investigated overall industry and sector context, and
project governance structure into account, particularly when the object of study is a supply
chain, not some particular construction organisations or projects.
The following macro factors regarding LC deployments in construction were identified;
(1) Project governance and supply chain management: fragmentation, sub-contracting and
lack of top management support (Johansen and Walter, 2007; Mossman, 2009; Sarhan and Fox,
2013; Zanotti et al., 2017),
(2) Project delivery systems: commercial, design, procurement and contractual issues
(Rooke et al., 2007; Sarhan and Fox, 2013; Cano et al., 2015; Pasquire et al., 2015a),
(3) Training issues: culture and human attitudes, lack of LC knowledge/ understanding and
educational issues (Alarcon et al., 2005; Jørgensen and Emmitt, 2008; Sarhan and Fox, 2013;
Cano et al., 2015; Pasquire et al., 2015b) and
(4) Process: lack of process and customer focus (Alarcon et al., 2005; Leong and Tilley,
2008; Wandahl, 2014; Sarhan and Fox, 2013; Zanotti et al., 2017).
As for LC deployments at SMEs, unlike the manufacturing industry (Achanga et al., 2006,
Panizzolo et al., 2012; Zhou, 2016; Antosz and Stadnicka, 2017), research investigating Lean
in SMEs in the construction industry has remained scarce. However, the importance of SMEs
in construction is increasing, particularly in developed economies, where many large
contractors prefer not to retain permanent staff and outsource construction activities to smaller
companies, acting more like project management or project integrating organisations
(Morledge and Smith, 2013; Farmer, 2016). The increasing presence of SMEs renders it
imperative to better understand issues around Lean deployment and SMEs. Some of the general
arguments around LC at construction SMEs have been that (1) SMEs are more prone to
(Alves et al., 2009; Poirier et al., 2015), (2) the common lack of trust between SMEs and their
larger clients as a hindering factor for partnering for LC (Briscoe et al. 2001; Björnfot and
Torjussen, 2012), (3) competent LC deployments should integrate SMEs into the process,
reducing the transaction costs of all parties; not only large contractors’ (Miller et al., 2002;
Mills et al., 2012), (4) a general lack of belief that there are mutual benefits in supply chain
integration practices and other business improvement initiatives like LC (Holt et al., 2000;
Dainty et al., 2001; Upstill-Goddard et al., 2016), and (5) the need for large clients’ active
support in terms of know-how and resources to develop capabilities in innovative approaches
in SMEs (Ferng and Price, 2005; Alves et al., 2009; Mills et al., 2012; Gledson and Phoenix,
2017).
2.2. Project management and Lean Construction in the highways sector
In England’s highways sector, since 2009, LC as a strategy has actively been championed
by HE, the main client of the supply chain, who is able to influence the strategic directions
(e.g. LC deployment) of its service providers (Ansel et al., 2007; Drysdale, 2013; HE, 2016).
HE first promoted LC through engagement and contractual configurations with some
large-sized main contractors (Tier 1s) and some specialised sub-contractors operating in key delivery
areas like soil works, paving/surfacing or traffic management (large Tier 2s) (Chloe and Sue,
2012; Drysdale, 2013; Fullalove, 2013). Those large Tier 2s are almost on par with Tier 1s in
terms of their annual turnovers and employee numbers.
HE is using prime contracting with Tier 1s as its main project delivery method (Fernie et
al., 2001; Gosling, 2015). In that contractual configuration, a small number of Tier 1s form
long-term partnerships with HE and large Tier 2s for the delivery of a series of projects. HE
commonly imposes a cap contract price, from which deviations in the form of price overruns
operational cost savings and to encourage the deployment of LC at the same time. Alongside
this, HE is contractually imposing the use of some LC techniques like the Last Planner System
(known as Collaborative Planning in the UK) (Daniel et al., 2017) or Visual Management
(Tezel and Aziz, 2017) in its contracts with Tier 1s. Also, Tier 1s and large Tier 2s are
monitored by HE for their LC maturity (Nesensohn et al., 2015). This active LC agenda drew
consultants into the supply chain. Those consultants work collaboratively with Tier 1s and
large Tier 2s on their LC efforts and offer LC trainings.
In this equation, SMEs are employed by Tier 1s, often for short terms on the minimum price
basis with fixed-priced contracts (Waara and Bröchner, 2006). Additionally, because of the
current project delivery system, SMEs are rarely in direct contact with HE for their LC or other
process improvement efforts, which are mostly shaped and directed by their Tier 1 clients. Due
to the nature of work, SMEs have to execute their on-site operations in short working windows
in coordination with other SME, large Tier 2 and Tier 1 organisations to avoid extended traffic
disruptions. SMEs constitute the largest group in the supply chain (Morton and Ross, 2008)
and given this context, one of the strategic targets of HE for LC is to effectively disseminate
LC across the whole highways supply chain, primarily including SMEs (Abbot and Aziz, 2015;
Tezel et al., 2017).
Given the findings from the literature review, the research is justified as follows:
As explained in Section 2.1, although LC becomes a strategic priority in the UK’s
civil sector, LC implementation discussions are mostly on process and LC
techniques, and to a lesser extent, on commercial arrangements, with lesser attention
to macro project management factors,
The existing LC discussions are mostly on specific companies or projects with lesser
Also, little has been identified as to LC implementations at construction SMEs,
whose importance is increasing in the construction industry,
Moreover, client-led, large-scale LC implementation efforts in construction supply
chains are relatively recent phenomena. Given the scarcity of empirical research on
LC at SMEs and sector-specific (e.g. civil, building, energy etc.) analyses, the
cooperation with a powerful public client, HE, which promotes and directs the LC
initiative in its supply chain, presents an opportunity to better understand the current
LC condition and future LC direction (necessities) for SMEs in civil projects for
both academic and practical reasons.
As different supply chain roles may have different perceptions and opinions as to the current
condition and future directions for LC at SMEs (Dainty et al., 2002; Huin, 2004; Khalfan and
McDermott, 2006; Cheng et al., 2010; Turner et al., 2010; Marcelino-Sádaba et al., 2014), to
increase the validity and generalisability of the research, and to further explore those different
perceptions and opinions, the current condition and future direction statements were
investigated over two hypotheses:
Hypothesis 1:
H0: The distribution of current LC condition agreement for SMEs is the same across
the three types of companies (SMEs, Large Tier 2s and Tier 1s) in the highways
supply chain.
H1: The distribution of current LC condition agreement for SMEs is not the same
across the three types of companies in the highways supply chain.
Hypothesis 2:
H0: The distribution of future LC direction agreement for SMEs is the same across
the three types of companies (SMEs, Large Tier 2s and Tier 1s) in the highways
H1: The distribution of future LC direction agreement for SMEs is not the same
across the three types of companies in the highways supply chain.
For the validity and generalisability, the null hypotheses (H0) are expected to be retained
(H0 is not rejected) in general at a certain confidence level. However, the difference in opinions
or where the distributions for the current condition and future direction statements significantly
differ (H0 is rejected) may present interesting insights into the varying approaches to the LC at
SMEs issue by the main supply chain roles.
3. Methodology
With the fundamental aims of identifying the current condition parameters and the future
direction for LC implementation factors at highways SMEs, a mixed-method study of
exploratory nature, involving interviews and a survey questionnaire, was designed.
3.1. Interviews
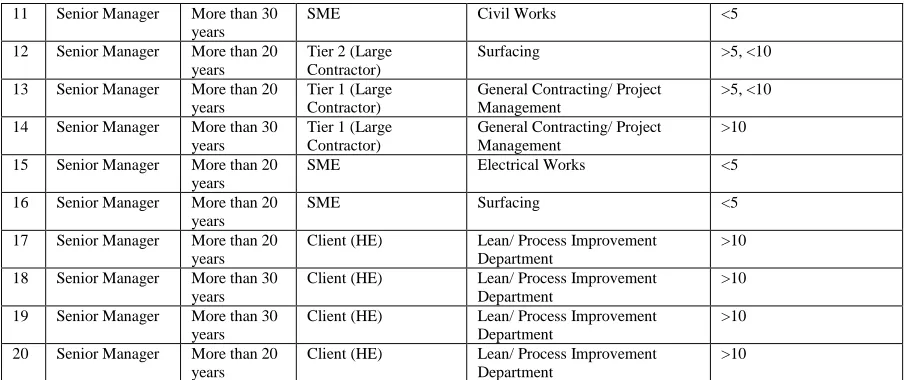
Following a literature review on LC and SMEs, 20 senior managers (4 from HE, 5 from
Tier 1s, 4 from large Tier 2s, 7 from SMEs) form England’s highways construction supply
chain were interviewed face-to-face for circa 45 – 60 minutes between December 2015-May
2016 (see details of the interviews in Table 1). The interviews were semi-structured and
open-ended. The primary advantages of open-ended interviews are that that they can provide more
detailed information on a subject matter than survey studies and their potential to reveal
rich-insights for exploratory research (Rapley, 2001; Berg, 2004). The interviewees were identified
in collaboration with HE under a purposive sampling strategy from managers actively engaging
with the LC implementation in highways projects. The involvement of HE was deemed
effective both in reaching and accessing the interviewees, as well as securing an interview time
quite schedules. Particular attention was given to interviewing managers from all the supply
chain roles, from the client (HE) to SMEs, in order to capture a more complete picture of the
issue, which is as an important aspect for interview reliability (Miles and Huberman, 1994;
Shao and Müller, 2011). Also, to further increase interview reliability and validity, the
interview protocol was reviewed by peers and supervisors, and the data and the analysis were
linked to the existing literature as much as possible (Miles and Huberman, 1994; Shao and
Müller, 2011). A shortlist of possible interviewees was produced first. Each interviewee on the shortlist was contacted initially to explain the aims and objectives of the research.
Subsequently, 15 days later, a reminder was sent.
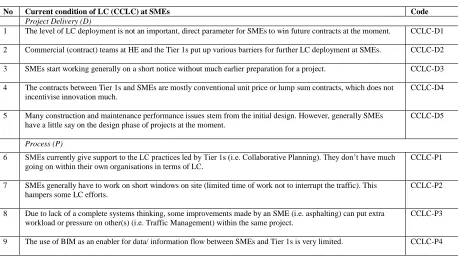
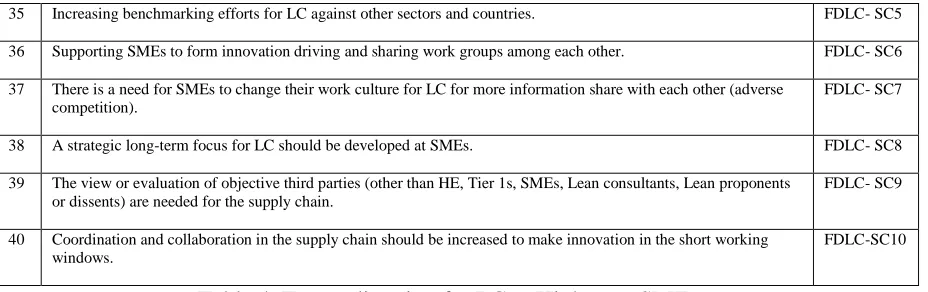
Two open-ended questions were asked during the interviews; the current condition of and
future directions of LC for SMEs. The responses were voice-recorded, transcribed and grouped
into 31 current condition and 40 future direction statements. The 31 current condition
statements were further grouped into 5 project delivery, 8 process, 3 training, 8 project
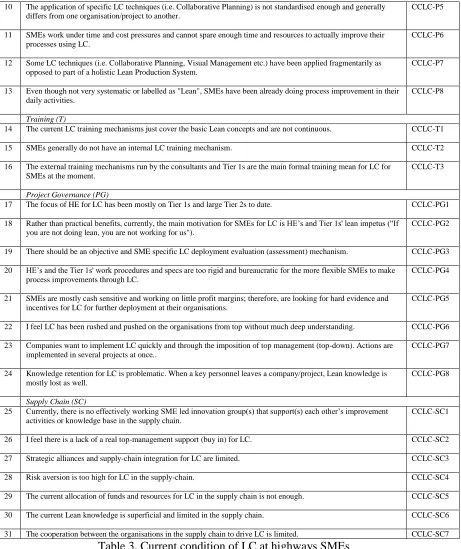
governance and 7 supply chain management related statements. The 40 future direction
statements were further grouped into 7 project delivery, 7 process, 8 training, 8 project
governance and 10 supply chain management related statements.
No Interviewee management role
Experience in the sector
Organisation’s role in the supply chain
Main operational area Lean construction background (years)
1 Senior Manager More than 20 years
SME Civil Works <5 2 Senior Manager More than 20
years
SME Civil Works <5 3 Senior Manager More than 20
years
SME Telecommunication Works <5 4 Senior Manager More than 30
years
SME Telecommunication Works <5 5 Senior Manager More than 30
years
Tier 2 (Large Contractor)
Aggregate/ Surfacing >5, <10 6 Senior Manager More than 20
years
Tier 2 (Large Contractor)
Aggregate/ Surfacing >5, <10 7 Senior Manager More than 20
years
Tier 1 (Large Contractor)
General Contracting/ Project Management
>5, <10 8 Senior Manager More than 30
years
Tier 1 (Large Contractor)
General Contracting/ Project Management
>5, <10 9 Senior Manager More than 20
years
Tier 1 (Large Contractor)
General Contracting/ Project Management
>10 10 Senior Manager More than 30
years
Tier 2 (Large Contractor)
11 Senior Manager More than 30 years
SME Civil Works <5 12 Senior Manager More than 20
years
Tier 2 (Large Contractor)
Surfacing >5, <10 13 Senior Manager More than 20
years
Tier 1 (Large Contractor)
General Contracting/ Project Management
>5, <10 14 Senior Manager More than 30
years
Tier 1 (Large Contractor)
General Contracting/ Project Management
>10 15 Senior Manager More than 20
years
SME Electrical Works <5 16 Senior Manager More than 20
years
SME Surfacing <5 17 Senior Manager More than 20
years
Client (HE) Lean/ Process Improvement Department
>10 18 Senior Manager More than 30
years
Client (HE) Lean/ Process Improvement Department
>10 19 Senior Manager More than 30
years
Client (HE) Lean/ Process Improvement Department
>10 20 Senior Manager More than 20
years
Client (HE) Lean/ Process Improvement Department
[image:16.595.72.525.71.261.2]>10
Table 1. Profile of the interviewees.
3.2. Survey questionnaire
To validate, rank and perform further analyses on the statements, a questionnaire survey
was designed due to its ability to cover large number of respondents, its cost effectiveness and
for a higher generalisability of results (Arditi and Gunaydin, 1997; Oyedele, 2013). Concerns
associated with validity and operationalisation of the statements (how concepts/ statements are
represented and measured) were mitigated by using a pilot survey and statistical Cronbach's
alpha reliability test (Johnson and Duberley, 2000; Geoghegan nad Dulewicz, 2008; Oyedele,
2013). The questionnaire includes the 31 current condition and 40 future directions statements
on a Likert-type scale of 1 to 5, where 1 represents ‘strongly disagree’ and 5 represents
‘strongly agree’ for the current condition statements and 1 represents ‘not important’ and 5
represents ‘very important’ for the future direction statements.
After the first draft of the questionnaire, a pilot study was conducted with the aim of testing
the level of ease at which respondents would be able to complete the questionnaire. The pilot
study examined the clarity of the language, the appropriateness and the logic of the questions,
the layout, the degree of depth, the ease of navigation and user friendliness of the whole
other statements beyond the ones in the final questionnaire. The pilot study involved 12 senior
managers (with the highways sector experience more than 20 years) from 4 Tier 1 companies,
4 large Tier 2 companies and 4 SMEs. Although no additional statements were required to
include in the final list, the companies recommended re-wording some of the questions. These
suggestions were implemented in the design of the final questionnaire.
HE’s database was used to pinpoint relevant managers to send the questionnaire to, who are
familiar with both the context in which SMEs operate and the current LC efforts in the
highways supply chain. This kind of purposive sampling strategies in survey studies can be
necessary to obtain relevant results when investigating innovative, emerging or niche
phenomena (Adams, 1997; Tongco, 2007; Winch et al., 2012). The questionnaire was sent
electronically. Of the outgoing 289 surveys, 110 responses were collected between June –
October 2016 with 38% response rate, which is acceptable in academic studies (Baruch, 1999;
Barlett et al., 2001). Among the respondents, 49 managers are from Tier 1s (45% of the
respondents), 43 managers are from SMEs (40% of the respondents), 13 managers are from
large Tier 2s (11% of the respondents) and 5 managers are from consultants (4% of the
respondents). 67 of the respondents are senior managers (61% of the respondents), 35 of the
respondents are middle managers (32% of the respondents) and 8 managers are junior
managers (7% of the respondents) (see details of the respondents in Table 2). It is not surprising
that many of the respondents are from large Tier 1s as the LC imitative in the supply chain was
first initiated by Tier 1 companies. The questionnaire was analysed using the SPSS (Statistical
Package for the Social Sciences) software. The research process can be seen in Figure 1
Supply chain role Years of experience
Management role 0 - 10 years 10- 20 years 20 - 30 years more than 30 years Grand Total
Consultant 1 2 2 5
Middle Manager 1 1 2
Tier 1 12 19 8 10 49
Junior Manager 8 8
Middle Manager 3 15 3 2 23 Senior Manager 1 4 5 8 18 Large Tier 2 7 1 3 2 13
Middle Manager 6 1 7
Senior Manager 1 3 2 6
SME 3 17 17 6 43
Middle Manager 2 1 3
[image:18.595.98.497.71.251.2]Senior Manager 3 15 16 6 40 Grand Total 23 39 28 20 110
Table 2. Profile of the survey respondents.
Figure 1. The research process.
4. Analysis of data
4.1 Interview results
First, the initial transcription and coding of the 20 voice-recorded interviews were
completed. Following this, the screening of the transcriptions for topic relevance of the
large-data set of more than 100000 words was executed, as despite giving rich insights, open-ended
[image:18.595.167.430.294.546.2]2003). With the relevant data in hand, the response patterns of the interviewees were
investigated by grouping similar responses (Miles and Huberman, 1994) under 5 main group
headings (e.g. project delivery, process, training, project governance and supply chain)
identified from the macro-factors in Lean implementations and SMEs as outlined in Section
2.1 from the investigations of Alarcon et al. (2005), Johansen and Walter (2007), Rooke et al.
(2007), Jørgensen and Emmitt (2008), Leong and Tilley (2008), Mossman (2009), Sarhan and
Fox (2013), Wandahl (2014), Cano et al. (2015), Pasquire et al. (2015a) and Pasquire et al.
(2015b). This kind of theory grounding forms one of the fundamental approaches in qualitative
data analysis (Dillon and Taylor, 2015). The interview analysis comprises of two subsequent
steps;(1) the transcribed sentences were reviewed and grouped by those 5 main group headings,
(2) similar statements initially grouped under similar group headings were identified, analysed
and grouped once more under one representing statement to narrow down the size of the
findings. Those second statements were used in the pilot survey study for further relevance and
clarity check. In the end, the responses were summarised into 31 current condition and 40
future direction statements under 5 main headings to be used in the survey questıonnaire (see
Table 3 and Table 4).
Regarding the current condition, the interviewed SME managers were found mainly
complaining about the lack of SME focus and direct support and collaboration culture for LC
in the supply chain. The SME managers also underlined the high potential of SME
organisations in achieving innovation and improvement at the process level. The managers
provided some suggestions for future directions. The interviewees from large Tier 1s and Tier
2s agreed on the condition that the LC focus had been on their organisations in the supply
chain. They, however, expressed their desire for SMEs to take more risks and initiative for LC
within their organisations. The interviewees from larger organisations also validated that they
service providers by mostly the conventional way (low-price) and on temporary basis. The
interviewees from the client organisation admitted that the LC focus had been on large
organisations and expressed their desire to diffuse LC into SMEs. The managers also discussed
some practical barriers and future plans as to further LC diffusion across SMEs in the supply
chain.
The interview findings agreed well with the generic LC implementation factors identified
in Section 2.1 and those factors were used as the basis for the interview grouping in this study.
However, the interview findings also reflect and elaborate on some specific conditions of the
highways supply chain as explained in Section 2.2, which gave the study a sector-level focus
too. To facilitate the analysis and the reporting, each statement was assigned a code. All the
codes for the current condition statements start with CCLC, whereas all the codes for the future
direction statements start with FDLC. Then following a hyphen, the initials of the group name
the statement belongs to and the statement’s number in the group are written (e.g. CCLC-D1 –
the first project delivery related statement of the current condition statements) (see Table 3 and
Table 4).
No Current condition of LC (CCLC) at SMEs Code
Project Delivery (D)
1 The level of LC deployment is not an important, direct parameter for SMEs to win future contracts at the moment. CCLC-D1 2 Commercial (contract) teams at HE and the Tier 1s put up various barriers for further LC deployment at SMEs. CCLC-D2 3 SMEs start working generally on a short notice without much earlier preparation for a project. CCLC-D3 4 The contracts between Tier 1s and SMEs are mostly conventional unit price or lump sum contracts, which does not
incentivise innovation much.
CCLC-D4 5 Many construction and maintenance performance issues stem from the initial design. However, generally SMEs
have a little say on the design phase of projects at the moment.
CCLC-D5
Process (P)
6 SMEs currently give support to the LC practices led by Tier 1s (i.e. Collaborative Planning). They don’t have much going on within their own organisations in terms of LC.
CCLC-P1 7 SMEs generally have to work on short windows on site (limited time of work not to interrupt the traffic). This
hampers some LC efforts.
CCLC-P2 8 Due to lack of a complete systems thinking, some improvements made by an SME (i.e. asphalting) can put extra
workload or pressure on other(s) (i.e. Traffic Management) within the same project.
[image:20.595.75.533.501.761.2]10 The application of specific LC techniques (i.e. Collaborative Planning) is not standardised enough and generally differs from one organisation/project to another.
CCLC-P5 11 SMEs work under time and cost pressures and cannot spare enough time and resources to actually improve their
processes using LC.
CCLC-P6 12 Some LC techniques (i.e. Collaborative Planning, Visual Management etc.) have been applied fragmentarily as
opposed to part of a holistic Lean Production System.
CCLC-P7 13 Even though not very systematic or labelled as "Lean", SMEs have been already doing process improvement in their
daily activities.
CCLC-P8
Training (T)
14 The current LC training mechanisms just cover the basic Lean concepts and are not continuous. CCLC-T1 15 SMEs generally do not have an internal LC training mechanism. CCLC-T2 16 The external training mechanisms run by the consultants and Tier 1s are the main formal training mean for LC for
SMEs at the moment.
CCLC-T3
Project Governance (PG)
17 The focus of HE for LC has been mostly on Tier 1s and large Tier 2s to date. CCLC-PG1 18 Rather than practical benefits, currently, the main motivation for SMEs for LC is HE’s and Tier 1s' lean impetus ("If
you are not doing lean, you are not working for us").
CCLC-PG2 19 There should be an objective and SME specific LC deployment evaluation (assessment) mechanism. CCLC-PG3 20 HE’s and the Tier 1s' work procedures and specs are too rigid and bureaucratic for the more flexible SMEs to make
process improvements through LC.
CCLC-PG4 21 SMEs are mostly cash sensitive and working on little profit margins; therefore, are looking for hard evidence and
incentives for LC for further deployment at their organisations.
CCLC-PG5 22 I feel LC has been rushed and pushed on the organisations from top without much deep understanding. CCLC-PG6 23 Companies want to implement LC quickly and through the imposition of top management (top-down). Actions are
implemented in several projects at once..
CCLC-PG7 24 Knowledge retention for LC is problematic. When a key personnel leaves a company/project, Lean knowledge is
mostly lost as well.
CCLC-PG8
Supply Chain (SC)
25 Currently, there is no effectively working SME led innovation group(s) that support(s) each other’s improvement activities or knowledge base in the supply chain.
[image:21.595.74.535.71.620.2]CCLC-SC1 26 I feel there is a lack of a real top-management support (buy in) for LC. CCLC-SC2 27 Strategic alliances and supply-chain integration for LC are limited. CCLC-SC3 28 Risk aversion is too high for LC in the supply-chain. CCLC-SC4 29 The current allocation of funds and resources for LC in the supply chain is not enough. CCLC-SC5 30 The current Lean knowledge is superficial and limited in the supply chain. CCLC-SC6 31 The cooperation between the organisations in the supply chain to drive LC is limited. CCLC-SC7
Table 3. Current condition of LC at highways SMEs
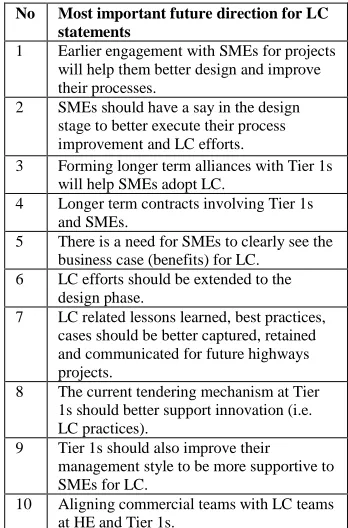
No Future direction for LC (FDLC) at SMEs Code
Project Delivery (D)
1 Forming longer term alliances with Tier 1s will help SMEs adopt LC. FDLC-D1 2 Earlier engagement with SMEs for projects will help them better design and improve their processes. FDLC-D2 3 SMEs should have a say in the design stage to better execute their process improvement and LC efforts. FDLC-D3 4 The current conventional unit price or lump sum contracts between Tier1s and SMEs should be replaced with more
risk/benefit sharing contractual mechanisms for better incentivisation for LC at SMEs.
5 Aligning commercial teams with LC teams at HE and Tier 1s. FDLC-D5 6 Longer term contracts involving Tier 1s and SMEs. FDLC-D6 7 The current tendering mechanism at Tier 1s should better support innovation (i.e. LC practices). FDLC-D7
Process (P)
8 Improving systems thinking in which different SMEs support each other’s' Lean improvement efforts in a project. FDLC-P1 9 Lean techniques should be extended to the maintenance/ operations phase after construction. FDLC-P2 10 There is a need to improve the use of BIM at SMEs to support a better information flow. FDLC-P3 11 LC efforts should be extended to the design phase. FDLC-P4 12 There is a need for an increased standardisation in the execution of specific Lean techniques (i.e. Collaborative
Planning or Visual Management) in the supply chain.
FDLC-P5 13 Value based decisions and prioritising innovations are necessary to implement some Lean techniques in short
working windows.
FDLC-P6 14 As opposed to top-down, bottom-up practices for LC stemming from the workforce should be given more
importance.
FDLC-P7
Training (T)
15 Training for LC, getting consultants on board and employing dedicated LC managers are costly for SMEs. Tier1s and HE should provide more support in those matters.
FDLC-T1 16 SMEs should develop on their in-house training for LC. FDLC-T2 17 SMEs should better understand the Lean terms like value, waste and flow. FDLC-T3 18 HE’s "Lean Tracker" (an online database where LC records are kept and shred openly with the supply chain) could
be improved to be more user-friendly and better promoted for SMEs to digest and learn from successful LC implementations in the supply chain.
FDLC-T4
19 The current LC training mechanisms should be extended to cover more advanced LC topics for SMEs and be more frequent (continuous).
FDLC-T5 20 Going beyond the LC tools, training SMEs and the supply chain for the strategic deployment of LC. FDLC-T6 21 We need to raise the awareness on how different LC techniques are linked to each other and work as a complete
system.
FDLC-T7 22 Joint training mechanisms for LC for SMEs and Tier 1s led by HE. FDLC-T8
Project Governance (PG)
23 Instead of going through Tier 1s (large contractors), SMEs would benefit from more direct contact/ engagement with HE for their LC efforts.
FDLC-PG1 24 There is a need for SMEs to improve their current skills and expertise on LC. FDLC-PG2 25 There is a need for SMEs to clearly see the business case (benefits) for LC. FDLC-PG3 26 The number of innovative, successful pilot LC implementation projects should be increased for SMEs. FDLC-PG4 27 HE should get more SME managers on board at their LC dissemination events. FDLC-PG5 28 HE should expand the capacity of its LC department. FDLC-PG6 29 Tier 1s should also improve their management style to be more supportive to SMEs for LC. FDLC-PG7 30 Extended modularisation and standardisation (off-site) in the design phase to support LC efforts. FDLC-PG8
Supply Chain (SC)
31 More academic collaboration and research/implementation focusing on LC and SMEs. FDLC-SC1 32 LC related lessons learned, best practices, cases should be better captured, retained and communicated for future
highways projects.
35 Increasing benchmarking efforts for LC against other sectors and countries. FDLC- SC5 36 Supporting SMEs to form innovation driving and sharing work groups among each other. FDLC- SC6 37 There is a need for SMEs to change their work culture for LC for more information share with each other (adverse
competition).
FDLC- SC7 38 A strategic long-term focus for LC should be developed at SMEs. FDLC- SC8 39 The view or evaluation of objective third parties (other than HE, Tier 1s, SMEs, Lean consultants, Lean proponents
or dissents) are needed for the supply chain.
FDLC- SC9 40 Coordination and collaboration in the supply chain should be increased to make innovation in the short working
windows.
[image:23.595.74.538.71.217.2]FDLC-SC10
Table 4. Future direction for LC at Highways SMEs
4.2 Questionnaire results
4.2.1 Reliability and non-parametric tests
A Cronbach's alpha coefficient of reliability should be calculated when using Likert scale
in a questionnaire to determine the internal consistency of the questionnaire (Field, 2005;
Nunnally and Bernstein, 2007; Oyele, 2013). The aim here is to confirm whether the criteria
and their associated Likert scale are actually measuring the construct they were intended to
measure. Since Cronbach's alpha coefficient is usually between 0 and 1; as a rule of thumb,
George and Mallery (2003) suggest that a value of 0.7 or more is acceptable. The overall
Cronbach's alpha coefficients for the CCLC questions and for the FDLC questions were
calculated as 0.904 and 0.921 respectively, demonstrating a good reliability and internal
consistency of majority of the questions.
To confirm that all the criteria are actually contributing to this internal consistency, the
second columns of Table 5 and Table 6 labelled “Cronbach's alpha if item deleted” are further
examined. According to Field (2005), if a question is not contributing to the overall reliability
and therefore not a good measure of the construct, its associated Cronbach's alpha coefficient
would be higher than the overall coefficient (0.904 for CCLC and 0.921 for FDLC). This higher
improve (Field, 2005). Only CCLC-P8 was calculated as a poor construct as shown in bold in
Table 5.
After checking reliability of the questionnaire, it was essential for this study to examine
whether the CCLC and FDLC parameters were perceived similarly or differently by the
respondents’ supply chain roles (i.e. Tier 1s, Large Tier 2s and SMEs). Consultant
organisations were excluded from the analysis due to their very small respondent number.
Since the data were not drawn from a particular probability distribution, normal distribution
is not assumed and there are three distinct groups, the non-parametric test of Kruskal–Wallis
were used on the three supply chain role groups. The null hypothesis (H0) is that there are no
differences in the perception of the respondents among the groups with regards to their supply
chain roles. At 95% confidence interval, when the Kruskal-Wallis significance values shown
in Table 5 and Table 6 are smaller than 0.05, the null hypothesis is rejected, meaning there is
a statistically significant difference in the perception of the corresponding question by the
different supply chain roles. The null hypotheses investigated in Table 5 and Table 6 under
the Kruskal-Wallis column are as follows:
H0: The distribution of current LC condition agreement is the same across the three types of
companies (SMEs, Large Tier 2s and Tier 1s) (Table 5),
H0: The distribution of future LC direction agreement is the same across the three types of
companies (SMEs, Large Tier 2s and Tier 1s) (Table 6)
The result shows that the respondents were in general agreement in terms of their perception
of all the CCLC questions, with the exception of four current conditions (D3, P8, PG8 and
SC5). With 11 disagreements as to the importance of the future directions (D1, P2, P3, P4, P7,
T1, T4, PG6, PG8, SC3 and SC10), there seems to be a greater discord in the FDLC questions.
Median values generally better represent central tendency than mean values for Likert-scale
questions (Field, 2005; Coakes and Steed, 2009). Therefore, median values for each CCLC and
FDLC questions were calculated (see Table 5 and Table 6). The dominant median score in both
types of questions is 4, which indicates ‘Agree’ for the CCLC questions and ‘Important’ for
the FDLC questions. From the central tendency of the data, it can be inferred in general that
the respondents found the current condition statements mostly accurate and the identified future
directions for LC at SMEs mostly important. The central tendency of the data validates the
interview findings.
4.2.3 Current condition and future direction indices
In order to be to rank the findings, to understand the degree of agreement on the current
condition (CCLC) and the degree of importance for each future direction statement (FDLC), a
current LC condition (CCI) and a future direction index (FDI) in % were calculated. Similar
indices were used by different researchers for similar purposes (Chan and Kumaraswamy,
2002; Spillane et al., 2011; Oyedele, 2013):
(CCI) = (∑Ni=1CCLCi
𝑁𝑆 ) × 100% (1)
(FDI) = (∑Ni=1FDLCi
𝑁𝑆 ) × 100% (2)
where CCLCi and FDLCi are the ratings given by (ith) respondent ranging from 1 to 5; i= 1,
2, 3...N; N is the total number of respondents for that particular statement, which is 110; and
S is the highest possible agreement rating, which is 5. The ranks within the groups and the
overall ranks for each CCLC and FDLC statement were identified (see Table 5 and Table 6).
0.07 and skewness = -0.38) indicate the current condition statements were mostly agreed by
the respondents with the scores concentrating around the mean. The descriptive statistics of the
FDI scores (mean=76, standard deviation = 7.4, kurtosis = -0.68 and skewness = -0.25) indicate
that although the distribution is flatter than CCI (negative kurtosis), the future direction
statements were also mostly found important by the respondents (negative skewness –
clustering around the higher end).
Current LC condition
Reliabilitya
Central
tendency Kruskal-Wallis test
Current LC condition index (CCI) and rankings Cronbach's
alpha if item
deleted Median Chi-square Sig.b H
0c CCI (%) Ranking within the group Overall ranking Delivery
CCLC-D5 .902 4 1.242 .537 Not Rejected 86.4 1 1 CCLC-D4 .901 4 1.996 .369 Not Rejected 79.0 2 7 CCLC-D3 .898 4 7.380 .025 Rejected 77.9 3 10 CCLC-D2 .900 4 3.370 .185 Not Rejected 77.3 4 13 CCLC-D1 .900 4 4.192 .123 Not Rejected 74.0 5 19
Process
CCLC-P8d
.905 4 14.153 .001 Rejected 81.6 1 3 CCLC-P4 .902 4 4.228 .121 Not Rejected 80.5 2 5 CCLC-P2 .900 4 2.651 .266 Not Rejected 80.0 3 6 CCLC-P7 .898 4 .102 .950 Not Rejected 78.7 4 8 CCLC-P5 .901 4 .850 .654 Not Rejected 77.1 5 14 CCLC-P1 .902 4 .176 .916 Not Rejected 73.1 6 22 CCLC-P3 .900 4 1.222 .543 Not Rejected 72.8 7 23 CCLC-P6 .899 4 2.896 .235 Not Rejected 67.8 8 28
Training
CCLC-T2 .898 4 .884 .643 Not Rejected 81.0 1 4 CCLC-T3 .904 4 3.658 .161 Not Rejected 77.4 2 12 CCLC-T1 .903 3 .083 .959 Not Rejected 68.7 3 26
Project Governance
CCLC-PG1 .902 4 1.491 .475 Not Rejected 85.3 1 2 CCLC-PG4 .902 4 .048 .977 Not Rejected 78.4 2 9 CCLC-PG5 .900 4 1.021 .600 Not Rejected 76.6 3 15 CCLC-PG3 .902 4 .092 .955 Not Rejected 73.8 4 20 CCLC-PG2 .899 4 1.191 .551 Not Rejected 73.3 5 21 CCLC-PG8 .900 4 6.192 .045 Rejected 72.2 6 24 CCLC-PG7 .903 3 5.960 .051 Not Rejected 68.4 7 27 CCLC-PG6 .900 3 1.559 .459 Not Rejected 62.4 8 31
Supply Chain
CCLC-SC1 .899 4 5.016 .081 Not Rejected 77.7 1 11 CCLC-SC7 .901 4 4.887 .087 Not Rejected 76.0 2 16 CCLC-SC5 .903 4 11.130 .004 Rejected 75.7 3 17 CCLC-SC6 .902 4 1.883 .390 Not Rejected 75.2 4 18 CCLC-SC3 .899 4 .445 .800 Not Rejected 71.8 5 25 CCLC-SC4 .898 3 .382 .826 Not Rejected 66.2 6 29 CCLC-SC2 .902 3 4.815 .090 Not Rejected 63.8 7 30
a Overall Cronbach’s alpha = 0.904
c H
0: The distribution of current LC condition agreement is the same across the three types of companies (SMEs, Large Tier 2s and Tier 1s) d The statement’s associated Cronbach's alpha coefficient is higher than the overall coefficient. Hence, not a good construct.
Table 5. Current LC condition at SMEs and associated statistical analysis
Future LC direction
Reliabilitya
Central
tendency Kruskal-Wallis test
Future LC direction index (FDI) and rankings Cronbach's
alpha if item
deleted Median
Chi-square Sig.b H
0c FDI (%) Ranking within the group Overall ranking Delivery
FDLC-D2 .919 5 .035 .983 Not Rejected 90.2 1 1 FDLC-D3 .918 5 4.117 .128 Not Rejected 87.6 2 2 FDLC-D1 .920 4 8.736 .013 Rejected 86.4 3 3 FDLC-D6 .920 4 1.073 .585 Not Rejected 85.8 4 4 FDLC-D7 .918 4 .738 .691 Not Rejected 82.7 5 8 FDLC-D5 .919 4 5.185 .075 Not Rejected 81.3 6 10 FDLC-D4 .919 4 2.206 .332 Not Rejected 66.0 7 36
Process
FDLC-P4 .919 4 8.811 .012 Rejected 85.1 1 6 FDLC-P7 .918 4 18.021 .000 Rejected 78.9 2 17 FDLC-P6 .918 4 4.390 .111 Not Rejected 78.5 3 18 FDLC-P1 .918 4 4.228 .121 Not Rejected 73.6 4 26 FDLC-P5 .919 4 .919 .631 Not Rejected 73.5 5 27 FDLC-P2 .919 4 27.584 .000 Rejected 70.0 6 32 FDLC-P3 .918 4 15.674 .000 Rejected 69.3 7 33
Training
FDLC-T1 .920 4 7.702 .021 Rejected 80.2 1 13 FDLC-T7 .919 4 1.119 .571 Not Rejected 77.7 2 19 FDLC-T8 .919 4 .632 .729 Not Rejected 77.5 3 20 FDLC-T3 .918 4 3.983 .136 Not Rejected 75.3 4 25 FDLC-T4 .920 4 9.315 .009 Rejected 72.5 5 28 FDLC-T6 .917 3.5 4.743 .093 Not Rejected 70.6 6 29 FDLC-T5 .918 3 .187 .911 Not Rejected 68.7 7 34 FDLC-T2 .920 4 .279 .870 Not Rejected 66.9 8 35
Project Governance
FDLC-PG3 .920 4 .202 .904 Not Rejected 85.5 1 5 FDLC-PG7 .918 4 .020 .990 Not Rejected 81.6 2 9 FDLC-PG2 .919 4 1.549 .461 Not Rejected 81.0 3 11 FDLC-PG4 .919 4 4.872 .088 Not Rejected 79.6 4 15 FDLC-PG5 .917 4 2.353 .308 Not Rejected 79.3 5 16 FDLC-PG1 .920 4 4.486 .106 Not Rejected 76.2 6 22 FDLC-PG8 .919 4 12.607 .002 Rejected 76.0 7 23 FDLC-PG6 .918 3 10.764 .005 Rejected 64.0 8 38
Supply Chain
FDLC-SC2 .919 4 1.631 .443 Not Rejected 84.2 1 7 FDLC-SC10 .919 4 9.214 .010 Rejected 80.8 2 12 FDLC-SC4 .919 4 3.503 .173 Not Rejected 79.8 3 14 FDLC-SC8 .918 4 .347 .841 Not Rejected 77.3 4 21 FDLC-SC6 .918 4 .530 .767 Not Rejected 75.6 5 24 FDLC-SC7 .918 4 1.641 .440 Not Rejected 70.4 6 30 FDLC-SC3 .920 4 9.088 .011 Rejected 70.2 7 31 FDLC-SC5 .917 3 2.517 .284 Not Rejected 64.7 8 37 FDLC-SC9 .919 3 5.929 .052 Not Rejected 62.7 9 39 FDLC-SC1 .919 3 2.415 .299 Not Rejected 60.9 10 40
a Overall Cronbach’s alpha = 0.921
b Significant at 95% confidence interval= 0.05 c H
0: The distribution of future LC direction agreement is the same across the three types of companies (SMEs, Large Tier 2s and Tier 1s)
4.2.4 Correlation analysis
To investigate the level of correlation between the future direction (FDLC) statements, a
Spearman’s rho correlation matrix was calculated (see Table 7), as homoscedasticity, linearity
and normal distribution of the data were not assumed (Field, 2005; Coakes and Steed, 2009).
In the matrix, the cells highlighted in black indicate a high correlation (Spearman’s correlation
coefficient > 0.5) (i.e. between T5 and T6 and SC7 and SC8)and the cells highlighted in grey
indicate a moderate correlation (0.3 < Spearman’s correlation coefficient < 0.5). Many of the
correlations were found significant at 95% (*) and 99% (**) confidence (two-tailed). The
correlation analysis was performed to identify what future direction items should be treated
and considered in connection with what other future direction items for further LC diffusion