International Journal of Emerging Technology and Advanced Engineering
Website: www.ijetae.com (ISSN 2250-2459,ISO 9001:2008 Certified Journal, Volume 4, Issue 6, June 2014)
287
Optimization of Number of Blade in High Pressure Compressor
Mohsinali batti
1, Vimal Patel
21Research scholar, 2Assistant Professor, S. V. National institute of Technology, Surat, Gujarat, India
Abtract-- This article deals with the conceptual approach to optimize stage and power of a highly loaded compressor Design. Thousands of solution investigation then presents rotation speed and number of stages diagram which deal with efficiency. Investigate Different modules there parameter are different for achieve maximum efficiency and finally select best module. Also investigate this module based on experimental analysis using Axstream software for find number of blade in stators and rotors. As a last section investigate parameter which is effected by number of blades rotational speed and number of stages and present result of this optimization process.
Keywords—high pressure compressor design, number of blade optimisation, compressor design in AxSTREAM, high loaded gas turbine design
I. INTRODUCTION
World’s increasing demands in energy, as well as transportation market growth emerges gas turbine manufacturers to be proactive. They have to design machines, that satisfies today’s requirements of highest efficiency (i.e. minimal fuel consumption), ability to operate in some certain range of conditions, weight restrictions, which are critical for transport applications. To be as much competitive as possible, design cycle shortening and intensifying is necessarily too.
Axstream software used in this paper to solve number of blade let’s give little bit explanation about Axstream. This software specially designs for turbo machinery. Axstream need boundary condition for design any turbo machinery the and this software capable for flow path design, blades design, casing design, duct design, nozzle design, guide vane design also CFD and FEM analysis.
For compressor design need to some higher knowledge. The most important design parameters are number of stage, rotation speed and number of blade. In real condition it’s very difficult to select number of stage, number of blade and rotational speed. This paper present experiment for number of blade design with help of Axstream and select as best as possible and stream line calculation with help of Axtream. It was proposed to perform optimization on parameterized geometrical 3D models of blade rows or stages utilizing the design of numerical experiment (DoE) technique.
Sometime less data available for design then difficult to select the other required data. For example number of blade in first stage rotor is also depending upon number of blade in rotor that is the region need to write this paper. This paper also deals with selection of number of blade with help of experimental result. Take high range of number of blade for stator and rotor then after optimizations parameter and also analyses effect on other parameter.
II. NOMENCLATURE
eff_tt_= total to total efficiency N = power
H = heat loss
AC = axial compressor Gout = outlet mass flow rate Ps = static pressure
eff_pt_ = polytrophic efficiency c= absolute velocity
w= relative velocity u= blade velocity A=flow angle B=blade angle
K1=blade inlet metal angle K2=blade outlet metal angle Z= number of blade
III. BOUNDARY CONDITION
In real condition some parameter easily available like inlet pressure inlet temperature but some parameter find after calculation that need to preliminary designs. Initially preliminary design specification and conceptual lay out used for Preliminary. Preliminary design specification includes,
i. Inlet and outlet boundary conditions like inlet pressure, temperature, pressure ratio etc.
International Journal of Emerging Technology and Advanced Engineering
Website: www.ijetae.com (ISSN 2250-2459,ISO 9001:2008 Certified Journal, Volume 4, Issue 6, June 2014)
288
[image:2.612.49.290.158.358.2]For present analysis following boundary conditions are used, assuming working fluid as ideal gas.
Table 1: Boundary condition
Sr. No. Input parameter Value
1 Inlet pressure 101.3 KPa
2 Inlet temperature 15 C
3 Outlet pressure 400 KPa
4 Mass flow rate 24.9kg/s
5 IGV inlet 70deg
6 Rotational speed -
The present condition less data available some data missing like rotational speed and number of stages. Fist calculate thousands of modules and find missing data.
IV. DESIGN PROCESS
The present condition less data available some data missing like rotational speed and number of stages. Fist calculates thousands of modules and find missing data. For those modules the range of rotational speed selected in between 6000 to 40000 rpm.
V. DESIGN
Preliminary design starts from specification of technical requirement and setting up design task and compressor conceptual layout that includes Inlet and outlet boundary conditions (inlet pressure, temperature, pressure raise ratio etc.). Conceptual design and sizing layout i.e. quantity of modules (group of stages) inside compressor, number of stages in each group, meridional and axial sizes limitations, work coefficient. The designer has to decide what kind of geometrical parameters should be used as design constraints i.e. specific diameter and its ranges or exact value and blade heights or angles based on requirements or assumptions.
First assume rotational speed between 6000-40000 rpm and calculates 2000 modules with same boundary condition but only rotational speed variable. That module represents in diagram every dot point is one modules and each module have different efficiency. Best module has 91% efficiency and that module rotational speed 11400 rpm.
[image:2.612.345.567.279.383.2]Figure 1: rotational speed and efficiency diagram
Figure 2: number of stage and efficiency diagram
Now we assume the number of stage very high for given boundary condition. This value around 10 stages because more than ten stage no solution available. Show the fig which indicates relation sheep between number of stages and efficiency in this diagram also show that when number of stage increases then efficiency also increases but after some point it is decrease.
Show the fig in this diagram important observation is when increase outlet pressure the maximum efficient number of stage also increase In this diagram 6 number of stages achieve maximum efficiency before and after this stage the efficiency decreases. That we must be required to choose best number of stage for given outlet pressure.
To compare all the created designs and find from them one that matches our specific requirements, the designer should use the “design space explorer”option in Axstream software. It gives an opportunity to filter designs basing on some specific criteria. Let’s assume that from selected solutions we need to find the best design that corresponds to the next additional restrictions.
Filter data
Work coefficient<0.35
International Journal of Emerging Technology and Advanced Engineering
Website: www.ijetae.com (ISSN 2250-2459,ISO 9001:2008 Certified Journal, Volume 4, Issue 6, June 2014)
289
[image:3.612.51.281.291.403.2]As requirement we need to select number of stage after filter parameter. There are two important parameter are cost and space. Design high efficient compressor but cost and space big point stage increase then cost also increase. Wight and length are big issue because stage increase weight increase and length also increase. According to requirement select 4 stage compressor and filter with parameter with requirement. Now study about the number of blade with help of some experiment. Design flow path need to some data. Without number of blade there are difficult to understanding some parameter like that outlet pressure, Enthalpy, entropy, temperature, velocity. Now we assume number of blade between 20 to 50 for rotor and 30 to 60 for stator.
[image:3.612.324.567.353.613.2]Figure 3: number of blades stator and rotor vs. efficiency
Fig 4: number of blade stator and rotor vs. power
When two parameters relate with single parameter then we use box & behnken plan. Also this calculation based on stream line calculation. What is the region behind use of stream line calculation explain under. Accurately check the performance of designed compressor in design operation point. Optimize number of stage and lean to provide required level of parameters distribution span wise. Calculate compressor performances curves on varying boundary conditions. Apply existing stators rotation law or determine appropriate for new speed lines. Perform optimization in Design of Experiment module.
Further, it is required to minimize Losses for better design constrain. Same parameters are used for calculation of losses. Main loss is heat loss which creates by high loaded and higher pressure ratio compressor.
Now we can analyze best area available on graph. The efficiency value higher when number of blade on rotor high and lower value for stator number of blade on stator. The number of blade on rotor increases then efficiency increases but higher value of number of blade responsible for higher power requirement. That is the region to need optimization for number of stage. Rotor For higher value of twist factor which responsible for low stage efficiency that the region to required optimization for blade design.
Help of this graph you can understand how to power related with number of blade on rotor and number of blade on stator. Otherwise we select higher value of number of blade than required higher power for drive compressor. You select optimum value of number of blade than you get best design point.
Fig 5: Heat loss and number of blade
Fig 6: Power with efficiency and number of blade
[image:3.612.49.295.430.564.2]International Journal of Emerging Technology and Advanced Engineering
Website: www.ijetae.com (ISSN 2250-2459,ISO 9001:2008 Certified Journal, Volume 4, Issue 6, June 2014)
290
[image:4.612.322.566.98.250.2]Now we combine power and efficiency graph and select best area for design which efficiency higher and power requirement less.
Figure 7: Power required, efficiency and heat loss with reference to combination of number of blade stator and rotor
The power and efficiency both are over main requirement so need to select number of blade which satisfied both the power and efficiency so combine both parameters in single diagram. With help of this diagram clearly understand over best design area. Now also need to combine loss, power and efficiency in single diagram.
For better understanding of variation of power required and efficiency with reference to number of blade on stator, graph of power required to compressor, efficiency of compressor and heat loss in compressor are plotted in Fig simultaneously according to variation of number of blade stator of stage 1. Subsequent effect of rotor number of blade is shown in next fig. Calculations are done for selected parameters itself.
Finally cover all the important parameter in single diagram. Diagram present for understanding how to number of blade related with other important parameter. Now help of this diagram easily select best solution point where efficiency high losses very low and power requirement low.
[image:4.612.49.298.164.301.2]Figure 8: Effect of number of blade in rotor
Figure 9: Effect of number of blade in stator
The outlet pressure also important in compressor design show the diagram the in rotor the power and pressure inversely related for given number of blade. In stator also power and outlet pressure inversely related for particular number of blade. Design area is final best solution in this area power efficiency and losses are optimum value. From this area many pair available which is better for axial compressor number of blade and we get maximum performance.
This design only for first stage you can design for all the stage as same way. Now we select one pair which is satisfied over requirement.
The selected pair is 35 for rotor number of blade and 46 for stator number of blade .This pair applies on design and do flow path design. Now study what is the effect on flow path and calculate other parameter.
We only design first stage and get lots of improvement. Other stage design same way and get better result. Now we need to calculate number of stage effect on other parameter. Over main parameter are enthalpy, entropy and velocity triangular.
[image:4.612.323.571.512.682.2] [image:4.612.48.291.563.689.2]International Journal of Emerging Technology and Advanced Engineering
Website: www.ijetae.com (ISSN 2250-2459,ISO 9001:2008 Certified Journal, Volume 4, Issue 6, June 2014)
[image:5.612.43.300.147.459.2]291 Table 2
selected parameters using optimization method
[image:5.612.320.559.170.555.2]Investigation is further extended to study effect of designed blade on variation of enthalpy with reference to entropy for each stage. Figure 12 indicates variation of enthalpy with reference to entropy for each stages of blade. In fig.12 the dark line indicate over all enthalpy change during the process, blue line represent statator enthalpy and red line represent rotor enthalpy.
Table 3
parameter result after number of blades selections
For indepth analysis, velocity diagram for stator and rotor blades are studied for each stages. Figure 13 indicates absolute velocity, flow angle, blade angle and metal angle for both staror vane and rotor vane for each stages.
Figure 11[a]: First stage velocity diagram
Figure 11[b]: Second stage velocity diagram
Sr. no.
Section-stage
Aspect ratio
Rel.
pitch chord
Number of blade
1 Stator-1 1.009 0.769 51.607 39
2 Rotor-1 2.245 0.706 25.133 88
3 Stator-2 1.092 0.750 52.722 40
4 Rotor-2 2.618 0.700 26.273 87
5 Stator-3 1.408 0.751 54.061 40
6 Rotor-3 3.046 0.703 27.582 85
7 Stator-4 1.626 0.752 57.180 39
8 rotot-4 3.557 0.707 29.138 83
9 Stator-5 1.929 0.753 59.388 39
10 Rotor-5 4.112 0.704 31.412 81
parameter With twist
Pressure 279.6kpa
power 3259kw
eff_pt_ 0.83
eff_tt_ 0.80
[image:5.612.43.287.576.702.2]International Journal of Emerging Technology and Advanced Engineering
Website: www.ijetae.com (ISSN 2250-2459,ISO 9001:2008 Certified Journal, Volume 4, Issue 6, June 2014)
292 Figure 11[c]: Third stage velocity diagram
Figure 11[d]: Fourth stage velocity diagram
VI. CONCLUSION
Present investigation indicates after the thousands of solution comparison and optimize the number of blade and other parameter with help of this diagram understand effect of number of blade on power requirement, efficiency and heat loss of compressor. Following conclusions can be derived after analysis in Axstream software. This paper helpful for the optimization of number of blades and improve the compressor performance
REFERENCES
[1] A.V. Boiko, Yu.N.Govorushchenko, S.V. Yershov, A.V. Rusanov
and S.D. Severin. “Aerodynamic Computation and Optimal Projection of Turbomachine Flow Paths.” - Kharkov, NTU “KhPI” 2002. - 356 pp. (in Russian)
[2] Miller, M. J., Durschmidt, D. F., Medlock, A. and Sandel, W. A. “An Integrated Design System for Fans, Compressors, and Turbines: Part I: Overview”, Proceedings of Turbo Expo 2004. June 14-17, Vienna, Austria.
[3] Moroz L., Govorushchenko Y., Pagur P., 2006, A Uniform
Approach to Conceptual Design of Axial Turbine/Compressor Flow Path, Future of Gas Turbine Technology, 3rd International Conference, Brussels, Belgium
[4] Zienkiewicz O.C, and Taylor R.L. “The Finite Element Method”.
4-th ed., McGraw-Hill, London, UK, 1991.
[5] H. S. WANG, J. J. ZHONG and Z. Q. Wang, “Numerical
Investigation of Secondary Flows in a Compressor Cascade with positively leaned Blades,” Journal of Engineering for Thermal Energy & Power, Vol. 17,No.4, pp. 375-378, 2002
[6] Mund, F., A. Kalfas, R. Abhari. 2002. “Integration of Software into
a Multi-disciplinary Undergraduate Student Design Project”. Proc. of 2002 American Soc. for Engineering Education Annual Conf., ASEE, Montreal, Quebec.
[7] Turner, M., A. Merchant , D. Bruna. 2006. “A Turbomachinery
Design Tool for Teaching Design Concepts for Axial Flow Fans, Compressors, and Turbines”. Proc. of GT2006, ASME Turbo Expo 2006, Barcelona, Spain.
AUTHOR’S PROFILE
MOHSINALI BATTI Research Scholar,
Mechanical Engineering Department, S. V. National institute of Technology, Dumas road, Surat, Gujarat, India.
[email protected], Ph. No. +91-9904034499
address: at-Badarpur, ta-Vadnagar, dist-Mehsana Gujarat, india-384355
VIMAL PATEL Assistant Professor,
Mechanical Engineering Department, S. V. National institute of Technology, Dumas road, Surat, Gujarat, India.
[image:6.612.60.495.118.601.2] [image:6.612.51.285.134.455.2]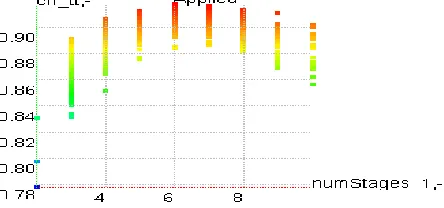


![Figure 11[a]: First stage velocity diagram](https://thumb-us.123doks.com/thumbv2/123dok_us/8713150.882440/5.612.320.559.170.555/figure-a-first-stage-velocity-diagram.webp)
![Figure 11[c]: Third stage velocity diagram](https://thumb-us.123doks.com/thumbv2/123dok_us/8713150.882440/6.612.51.285.134.455/figure-c-third-stage-velocity-diagram.webp)
