interactions between keratin intermediate
filaments
Akinshina, A, JambonPuillet, E, Warren, PB and Noro, MG
http://dx.doi.org/10.1186/20461682612
Title
Selfconsistent field theory for the interactions between keratin
intermediate filaments
Authors
Akinshina, A, JambonPuillet, E, Warren, PB and Noro, MG
Type
Article
URL
This version is available at: http://usir.salford.ac.uk/41432/
Published Date
2013
USIR is a digital collection of the research output of the University of Salford. Where copyright
permits, full text material held in the repository is made freely available online and can be read,
downloaded and copied for noncommercial private study or research purposes. Please check the
manuscript for any further copyright restrictions.
R E S E A R C H A R T I C L E
Open Access
Self-consistent field theory for the interactions
between keratin intermediate filaments
Anna Akinshina
1,2*, Etienne Jambon-Puillet
1,3, Patrick B Warren
1and Massimo G Noro
1*Abstract
Background: Keratins are important structural proteins found in skin, hair and nails. Keratin Intermediate Filaments are major components of corneocytes, nonviable horny cells of the Stratum Corneum, the outermost layer of skin. It is considered that interactions between unstructured domains of Keratin Intermediate Filaments are the key factor in maintaining the elasticity of the skin.
Results: We have developed a model for the interactions between keratin intermediate filaments based on self-consistent field theory. The intermediate filaments are represented by charged surfaces, and the disordered terminal domains of the keratins are represented by charged heteropolymers grafted to these surfaces. We estimate the system is close to a charge compensation point where the heteropolymer grafting density is matched to the surface charge density. Using a protein model with amino acid resolution for the terminal domains, we find that the terminal chains can mediate a weak attraction between the keratin surfaces. The origin of the attraction is a
combination of bridging and electrostatics. The attraction disappears when the system moves away from the charge compensation point, or when excess small ions and/or NMF-representing free amino acids are added.
Conclusions: These results are in concordance with experimental observations, and support the idea that the interaction between keratin filaments, and ultimately in part the elastic properties of the keratin-containing tissue, is controlled by a combination of the physico-chemical properties of the disordered terminal domains and the composition of the medium in the inter-filament region.
Keywords: Stratum corneum, Skin keratins, Intermediate filaments, Unstructured terminal domains, Bridging attraction
Background
The outermost layer of skin, the stratum corneum (SC), is often described as organised into a ‘bricks-and-mortar’ type structure, where the mortar represents the self-assembled lipid lamellae and the bricks refer to the protein-rich corneocytes [1-4]. Corneocytes are nonviable disk-shaped flat horny cells mainly composed of keratin proteins, organised in complex intermediate filament (IF) networks. Keratins, in turn, are important structural pro-teins which confer stiffness to many biological tissues such as skin, nails and hair. There are 54 functional human ker-atin genes, of which 28 are type I (acidic) kerker-atin genes and
*Correspondence: [email protected]; [email protected]
1Unilever R&D Port Sunlight, Quarry Road East, Bebington, Wirral, CH63 3JW, UK 2School of Chemical Engineering & Analytical Science, The University of Manchester, Oxford Road, Manchester, M13 9PL, UK
Full list of author information is available at the end of the article
26 are type II (neutral and basic) keratin genes. A new sys-tematic nomenclature and functional role of keratins was presented by Schweizeret al.[5], Mollet al.[6], and Gu and Coulombe [7].
Keratin monomers consist of central α-helical rod domains of similar substructure (≈ 310 amino acids) and two disordered (unstructured) glycine-rich N- and C-terminal domains of variable size. Two keratin polypep-tides associate in a parallel arrangement to form an ≈ 50 nm long coiled coil dimer, consisting of two different types of keratins: one acidic (type I) and one neutral-basic (type II). The most frequent keratin (K) dimer expressed in the SC and the upper epidermis is the K1/K10 pair [8-10]. The two coiled-coil heterodimers further self-assemble into tetramers by packing into an antiparallel half-staggered configuration. Tetramers, in turn, aggre-gate end-to-end forming protofilaments with a diameter around 2–3 nm. Two protofilaments make a protofibril
with diameter of order 4–5 nm; four of these assemble laterally to form the keratin IF with diameter of order 8– 10 nm [7,10-22]. Schematically, a keratin IF could be pic-tured as a long cylindrical object filled mainly byα-helical coiled coils domains, and decorated on the surface by dis-ordered N- and C-terminal domains extending into the surrounding solution. An illustration of the IF hierarchical organisation is depicted in Figure 1.
Inside the corneocytes IFs are surrounded by a com-plex mixture of water, ions, free amino acids and other low molecular weight water soluble non-ionic compounds; this mixture is sometimes referred to as the “Natural Moisturising Factor” (NMF). NMF plays an important role in skin moisturisation and in maintaining the physico-chemical properties of the skin, such as elasticity and per-meability [23-30]; and it results from proteolytic degra-dation of filaggrin, a histidine-rich protein [23-30]. A reduced amount of NMF correlates with dry, flaky and
itchy skin. Dry skin conditions may be a cosmetic prob-lem triggered by natural (seasonal) changes of SC physical properties [24,26], but they may escalate to severe inflam-matory skin disorders such as atopic dermatitis [26,28], xerosis [26,29] ichthyosis [28,30] and psoriasis [28,30].
[image:3.595.59.537.328.695.2]Jokura et al. [23] studied the effect of NMF on SC elasticity using NMR spectroscopy, rheology and electron microscopy. The authors observed that treating an excised SC sample with water releases NMF and leads to a ker-atin IF mobility reduction, and overall corneocyte rigid-ity. Electron micrograph evidence suggested that in the absence of NMF, keratin filaments tend to associated more tightly with each other. Further hydration of the sample does not improve the mobility of the fibers. However, the original IF mobility conditions were partially restored by application of amino acid solutions. The authors com-pared the effect of different types of amino acids on the restoration of the SC elastic properties: neutral or basic
amino acids, such as glycine or lysine, provided remark-able recovery of SC elasticity. In contrast, acidic amino acid, such as aspartic acid, was not as effective.
These findings suggested the hypothesis that loss of SC elasticity is due to increased intermolecular attractive forces between keratin filaments. In physiological con-ditions, NMF plays the important role to reduce these attractive forces, and to ensure SC elasticity. It is tempting to argue the protruding non-helical regions (unstructured N- and C- domains) mediate the interaction between the NMF-rich matrix and the IFs. In this work we present a modelling study of the interactions between keratin IFs suspended in different media: (i) a salt free solution mim-icking the NMF depleted system, and the effects of (ii) added salt and (iii) NMF-rich amino acid solution.
Method
Self-consistent field (SCF) approach
Interactions between two IFs formed by K1/K10 keratins were investigated using the lattice self-consistent field (SCF) method [31-37]. The helical cores of the two IF are modelled as planar surfaces at distanceDapart with disor-dered N and C terminal domains uniformly grafted onto them. The space between the IF surfaces is filled by water molecules, ions and/or free amino acids. The schematic model system is illustrated in Figure 1.
In the lattice SCF scheme the space between two sur-faces is divided into layersz=1, 2, 3,. . .,Dparallel to the walls, and each layer is further divided into lattice cells of equal size. Each lattice site is occupied by one of the monomeric species of the system (i.e. by protein residue, water molecule, ion, etc.), so the total volume fraction for all the species in each layer equals one,αφα(z) = 1, where the volume fractions φα(z) have the meaning of dimensionless concentration of species typeαat the dis-tancezfrom the surface. Obtaining the equilibrium con-centration profiles for all the system components,φα(z), is the primary target of the SCF calculations. The volume fraction distributions depend nonlinearly on the poten-tial of mean force,uα(z), acting on each speciesα in the
system. The potential for each component,uα(z), in turn,
depends on the volume fraction profiles, as well as on the short range (Flory-Huggins) and long-range (electro-static) interactions between all the species of the system. To find both quantities,φα(z)anduα(z), a set of nonlinear equations is constructed and solved self consistently by an iterative procedure. The volume fraction profiles obtained in this way minimise the free energy of the system [35].
The SCF method is widely used to study proper-ties of disordered proteins at interfaces. Earlier, the scheme was implemented to investigate adsorption of milk proteins,β-casein [38] andαS1-casein [39-42]. More recently the SCF approach was applied to protruding terminal domains of neurofilaments (NF) [43-47] and
to microtubule-associated 3RS tau protein, expressed in neurons of the central nervous system [48]. The detailed description of the method can be found in the original lit-erature. Here we apply the method to study unstructured terminal domains of skin keratin IF. We have considered and compared two models for terminal N and C domains, detailed next.
Amino acid (AA) model for terminal domains
The first model (AA) is based on the primary structure of N and C terminal domains for the keratins K1 and K10. The amino acid sequence of these domains is taken from the Human IF Database [49]. The terminal domains of K1 (N1 and C1) consist of 180 and 151 amino acids, respec-tively, and of K10 (N10 and C10) of 146 and 124 amino acids. All the amino acids in this model are divided into five groups according to their properties: ‘H’, hydropho-bic (Ala, Val, Leu, Ile, Met, Trp, Phe, Pro, Cys); ‘P’, polar (Ser, Thr, Tyr, Asn, Gln), ‘G’ (Gly); ‘+’, basic (Arg, Lys, His); and ‘−’, acidic (Glu, Asp). A similar approach for allocat-ing amino acids into groups is widely used in literature [38-48].
As can be seen from the amino acid sequence, N and C domains for K1 and K10 are glycine-rich (∼50%), where glycine is mostly accumulated in blocks of 3–6 residues separated by one or two H or P residues. Being aware that glycine is a peculiar amino acid, showing both polar and hydrophobic behaviour (depending on the length of the poly-glycine residue) [50-53], we reserve for glycine a separate classification group ‘G’.
The value ofpH for SC is varied depending on SC depth, location and environment and the reported values of SC
pH are in the order of 5–7 [54-56]. According topKα
val-ues, atpH =7 the amino acid residues Arg and Lys have chargeq = +1e, His hasq = +0.36e, and Glu and Asp have q = −1e. At pH = 5, Arg and Lys have charge ofq = +1e, His hasq = +0.98e, and Glu and Asp of
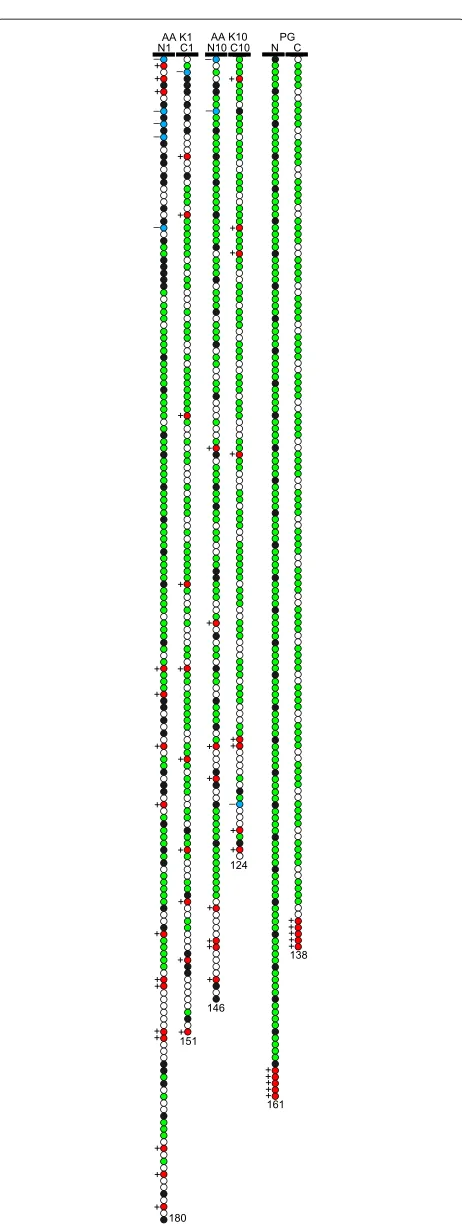
Figure 2Models of unstructured domains.Schematic illustration of the N and C unstructured terminal domains for the AA and PG models. Colour code: white - “P”; black - “H”; red - “+”; blue - “–”, green - “G”.
but we believe that under such conditions the electrostatic screening effect would dominate.
Polyglycine (PG) model for terminal domains
When examining the central parts of the residue sequence in the AA model in more detail, one can observe a repeat-ing pattern of polyglycine blocks separated by one or several H, P or, rarely, basic monomers. One can also notice that the acidic residues are mostly located at the beginning of the tails (near the helical IF part, represented by planar surface in our SCF model) while the basic ones are mostly situated at the end of the tails (far from the IF surface). In order to capture and emphasize the major spe-cific properties of the terminal domain structure we have designed a simplified “polyglycine” (PG) model for the N and C tails. The coarse PG model consists of repeating blocks of four G monomers and one H monomer (N tail) or four G and two P monomers (C tail) with additional five basic residues at the end of each tail. Thus, the structure of the N tail, NPG, is H1[G4H1]31(+)5and the structure of the C tail, CPG, is P1[G4P2]22(+)5. The lengths of the NPG and CPGfragments are chosen to be 161 and 138 residues, respectively: this is because these numbers are near the average of N1 and N10 tail lengths (180 and 146 residues) for NPGand, consequently, the average of C1 and C10 tail lengths (151 and 124 residues) for CPG. The NPGand CPG tail models are also illustrated in Figure 2.
Modelling parameters
The short-ranged Flory-Huggins interaction parameters χ between the different types of monomers applied for both tail models are the follows. The hydrophobic residues, H, strongly repel all the polar ones, so we set χ = 2kBTfor interactions of H with water and ions (Na, Cl), and χ = 1kBT for interactions of H with all the polar protein residues (P, +, −). The interactions of Na and Cl with water are attractive, χ = −1kBT to mimic the tendency of hydration for the ions. Concerning the last residue group, G, we setχ = 0.4kBT for interactions of G and H group andχ=0.6kBTfor those between G and all the others residues (water, P,+,−, ions). The remain-ing interactions are set to be athermal (χ = 0). All the monomer types considered have no affinity to the surface, χs=0.
decreases with length. Bykov and Asher [51] reported that oligoglycines longer than 5 residues are normally insolu-ble in water; and Ohnishiet al.[50] stated that solubility of polypeptide with glycine linker beyond 6 is reduced and polyglycine segments longer than 9 residues form insolu-ble aggregates. In the current model, glycine is present in both forms: as oligomers in the sequence of keratin termi-nal domains and as free amino acid in the NMF compo-sition. Taking into account dual hydrophobic-hydrophilic properties of glycine, we anticipate that the interactions of glycine with both hydrophobic and polar residues should neither be strongly repulsive nor attractive. Thus, we set the interactions with non-polar residues slightly attrac-tive (χ = 0.4kBT) and with all polar slightly repulsive (χ=0.6kBT). Alternatively, it would be possible to sepa-rate glycines into two groups: one for free glycine in NMF, and another one for glycine blocks in terminal domains, but that is beyond the scope of the current simplified model.
We have considered different values of dielectric per-mittivities, α, for different species components in our
calculations. A similar approach has been used by Leer-makerset al.for modelling projection domains of neuro-filaments [43-47]. The permittivity for water was set to α =80, for hydrophobic group H and IF surfaceα =2,
for all the polar and charged components (P, +, −, Na, Cl) α = 5, and for glycine (G) we set α = 4. The
local dielectric permittivity was calculated according to (z)=0ααφα(z), where0is the permittivity of vac-uum andφα(z)is the volume fraction of species typeαat distancez. The set of all parameters for both AA and PG models is given in Table 1.
The calculations were carried out using the lattice spac-ing of a0 = 0.4 nm. There are literature reports of lattice spacing ranging between values of 0.3 nm, used for modelling of caseins [38-42] and 0.6 nm applied for
calculations of terminal domains of NF [43-47] and 3RS tau protein [48]. In our model system the main compo-nents are amino acids and water molecules. The water molecule size is about 3.1 Å and that of amino acids ranges from 3.9 Å for Gly to 6.1 Å for Trp [58]. As glycine, the smallest amino acid, is the main component of the sequence of the K1/K10 terminal domains, we used the intermediate value ofa0 = 0.4 nm as lattice size in our calculations.
In this work we consider terminal domains uniformly grafted into two IF cores, which are represented by planar surfaces. The grafting density of the domains is calculated according to the fact that there are four terminal domains (two N and two C) per one dimer length ofL = 50 nm, and one IF core consists of 16 dimers (8 protofilaments), which gives in total 64 domains per dimer length. Tak-ing the IF core diameter of 2R = 7.8 nm [14] and the lattice size a0 = 0.4 nm, we obtain the grafting density
σ = 64a20/(2πLR) = 0.0083 (in units of a20). For the AA model, with the average charge per each tailqN =
qC = +8e(as the total charge of the four domains is
qNC = +32e), the charge density on the surface due to grafted chains would beσNC = +0.0664e. As for the PG model the charge density due to grafted chains would be, correspondingly,σNC= +0.0415e.
The calculation of the IF coiled-coil backbone charge is not so obvious due to lack of information about IF core organisation. Considering all the charged amino acids on the K1/K10α-helical parts, we have obtainedN+ = 45,
N− = 58 for K1 and N+ = 39, N− = 60 for K10, which gives the net charge of the K1/K10 dimerqdimer=
[image:6.595.59.541.556.696.2]−34e. We also take into account that 14 salt bridges do not change the total charge of the dimer. Carrying out the charge calculations for the IF core with dimer length of 50 nm, we consider, as previously, that IF back-bone comprises 16 dimers in its cross section. Thus, we
Table 1 Flory-Huggins parameters
χ W H P G + − Na Cl s q r
W – 0 80
H 2.0 – 0 2
P – 1.0 – 0 5
G 0.6 0.4 0.6 – 0 4
+ – 1.0 – 0.6 – +1 5
− – 1.0 – 0.6 – – −1 5
Na -1.0 2.0 – 0.6 – – – +1 5
Cl -1.0 2.0 – 0.6 – – – – −1 5
s – – – – – – – – – (*) 2
obtained the surface charge density (i.e.charge pera20) of σs = −0.071e. This result for the surface charge density is appeared to be quite close to the value of the surface charge density due to the grafted chains,σNC= +0.0664e (with opposite sign). As explained by literature reports [12,13,59,60] the IFs are apolar; we expect that the over-all charge of IF core, dangling terminal domains, and appropriate counterions should be balanced. Because the exact IFs organisation is unknown, we can not estimate how many of the accounted amino acids on the IF core are in their dissociated form. Keeping in mind that some parts of the protofilaments and, therefore, some of the charged amino acids could be hidden inside the IF core where is no water, we presume that the charge density of IF core could be lower then the calculated value of σs = −0.071e. Therefore, as a reference (starting) point for our calculations for the AA model we consider the surface charge density fully balanced with the charge den-sity of the grafted chains,σs = −0.0664e. As for the PG model, the balanced value of the charge density would be σs = −0.0415e. We also explore a range of the surface charge densities around these values for both AA and PG terminal models. Salt is represented by added Na and Cl ions and the concentration was varied from as low ascs= 10−5M (φs=3.8×10⁻⁷) tocs=0.1 M (φs=3.8×10⁻³), depending on the system.
All the calculations were performed using the SCF code SFBOXkindly provided by Frans Leermakers.
Results and discussion
Overview
Structural organization of the N and C terminal domains in one surface and interactions between the two IF sur-faces will be presented and discussed below. The results considered include volume fraction profiles, φ (z), of N and C terminals for both models, corresponding profiles of the basic residues,φ+(z), and free energy of interactions between the two IF surfaces with the attached terminal domains,V(D). We start with the case of balanced charge densities for the surface and chains,|σs| = σNC, at low ionic strength,cs = 10−5M. Then we consider the effect of added salt and discuss the options when the surface charge in absolute value is higher or lower than the charge on the grafted chains. At the end, in order to obtain bet-ter insights into the properties of each type of bet-terminal domains, we consider the interactions of the surfaces with only one type of the chains (N or C) grafted.
IF surfaces and tails at equal absolute charge: volume fraction profiles
The volume fraction profiles, φ (z), show the monomer density of the grafted N and C domains at distance z
from the surface. These distributions provide an estimate of how far the grafted chains extend from the surface
and what is the most probable location of any specified monomers. The volume fraction profiles for the whole N and C chains are given in Figure 3 while Figure 4 shows the distributions for only positively charged monomers of N and C domains,φ+(z). In order to obtain the spatial distri-bution for an unaffected N and C chains, the profiles were obtained at large surfaces separation, so that the grafted chains do not interact (this corresponds to the limit of an isolated IF in solution).
Distribution of N and C tails
In Figure 3(A) we present the volume fraction profiles for the PG model of N and C tails. The profiles for the two tails are quite different: the monomer distribution of the more hydrophobic N tails is more narrow compared with the profile for C tails, with most of the monomers located in the first 10 layers from the surface and the maximum density atz= 4a0. The extension of the N tails does not exceedz = 13a0. More polar C tails have lower density near the surface and more extended profiles. The max-imum density is slightly shifted away from the surface,
z = 6a0, and the profiles extend up toz = 20a0. With the simple block-copolymer model for terminal domains we obtained the two distinct populations of the chains: (i) more hydrophobic N tails are collapsed near the sur-face and (ii) more polar C tails are projected farther into the solution. However, we should notice that both types of chains are actually quite compact near the surface. With contour lengths of 161a0and 138a0the chains do not spread out more than 13a0 and 20a0 respectively. We attribute this behaviour not only to the hydropho-bic nature of both tails, major component of which is glycine, but also to the attraction of the positively charged end-monomers to the negatively charged surface, causing formation of loops.
C
D
[image:8.595.57.541.86.345.2]A
B
Figure 3Volume fraction profiles of the tails.Volume fraction profiles for(A)PG model,(B)AA model,(C)comparison of volume fraction for both N tails (N1+N10) and both C tails (C1 and C10) for the AA model with N and C tails of the PG model, and(D)volume fraction of all the tails for the AA and PG models.
be in compact conformation, reducing contacts with the polar solvent. Similar tail extension is observed also for N10 except that the maximum density value is lower than that for N1, because N10 chains are shorter and slightly less hydrophobic (17% of H monomers and 47% of G). The volume fraction profiles for C tails are slightly more extended than those for N tails. In particular, the distri-bution for C10 tail extends farthest, up to z = 20a0, and the monomer density near the surface is reduced. Even though C tails also consist of about 50% G residues,
Figure 4Volume fraction of the basic residues.Volume fraction of the basic residues on the N and C tails for the AA and PG models.
the fraction of non-polar H monomers is much smaller, 9% and 2% for C1 and C10, respectively. Being more polar than N tails, C tails extend a little farther into the solution.
[image:8.595.58.292.549.707.2]glycine-rich terminal domains of epithelial keratins com-prise flexible and compact glycine loops, where sequences of glycine make loops between the stacked non-polar residues. Even though SCF method does not allow obtain-ing such structural loops, it predicts compact conforma-tion of the terminal domains near the surface. Therefore, despite some discrepancies in individual profiles for N and C tails, in the two models, the combined profiles for all (N+C) tails are fully consistent with each other, see Figure 3(D). The simple glycine multi-block model for N and C terminal domains reasonably well reflects the density distributions of terminal domains for K1/K10 IF.
Distribution of the basic residues of the tails
The volume fraction profiles for N and C domains provide the information about spatial distribution of the chains as a whole, while the location of the ends of the chains can be obtained from the distribution of the positive residues,φ+(z). The basic residues in the PG model are located only at the end of the tails and in the AA models they are scattered along the chains with higher concen-tration near the ends. The volume fraction profiles for basic residues in N and C tails, φ+(z), are presented in Figure 4.
For the PG model the distributions of positively charged monomers for N and C tails are practically the same. The positive monomers for both tails are located near the sur-face, with maximum at the first layer followed by abrupt decrease in the monomer density with the distance from the surface. For the distancesz>5a0the fraction of basic monomers becomes very small. That result allows us to conclude that the basic residues, and, therefore, the end of the chains are located at the surfaces, so the tails form either loops back to the grafting surface or bridges with the opposite one.
As for the AA model, the distributions of positive residues for N and C tails differ both from those in the PG model and between each other. First, both distribu-tions for the AA model are wider, especially for the C tails, and second, the difference between theφ+(z) pro-files for N and C tails is more noticeable. For the N tails, φ+(z)is similar to that for the PG model, with the max-imum at the first layer and subsequent decrease of the density with distance. At distances z>10a0 very small fraction of basic monomers can be found. The total vol-ume fraction is higher than that for the PG model because the amount of the positively charged monomers is higher. In the PG model there are only 5 basic monomers in each tail, while for N1 and N10 the numbers of basic monomers are 15 and 8, respectively. Taking into account that the grafting density of N tails for the PG model is the same as the sum of the grafting densities for N1 and N10, the calculated total amount of the positive charges for both N tails in the AA model is more than twice higher
than that for the PG model. That results in about dou-ble the value of volume fraction of basic monomers for the AA model. Positively charged monomers for C tails distribute much wider and spreading gradually over∼17 layers from the surface. The maximal density is again in the first layer but its value is more than half than that for the N tails, even though the number of positive charges for the C tails is not much smaller, 9 and 8 for C1 and C10, respectively.
The density profiles for all the tails show that the max-imum density for the basic monomers is always at the first layer. The fact that the highest concentration of those residues is at the surface confirms our hypoth-esis that the charged monomers adsorb onto the sur-face, so the chains form loops and/or bridges between the surfaces. Broader volume fraction profiles of basic monomers for the AA model possibly result from the different distribution of the charged monomers along the chains. In the more detailed AA model, the basic monomers are not located exactly at the end of the chains, but somehow distributed along the whole length of the chains, with higher concentration at the ends. Thereby, the more uniformly distributed charges in the AA model give a thicker adsorbed layer while the clustered charges in the PG model adsorb flat on the surface, produc-ing a very thin layer, similar to that of highly charged polyelectrolytes.
IF surfaces and grafted tails at equal absolute charge: interaction potential profiles
The interactions between the two surfaces (IF cores) cov-ered by grafted N and C terminal domains can be evalu-ated by calculating free energy of interactions between the surfaces at each separationD. The free energy of interac-tionsA(D)is calculated from the partition function under conditions of restricted equilibrium, described by Evers
Low ionic strength
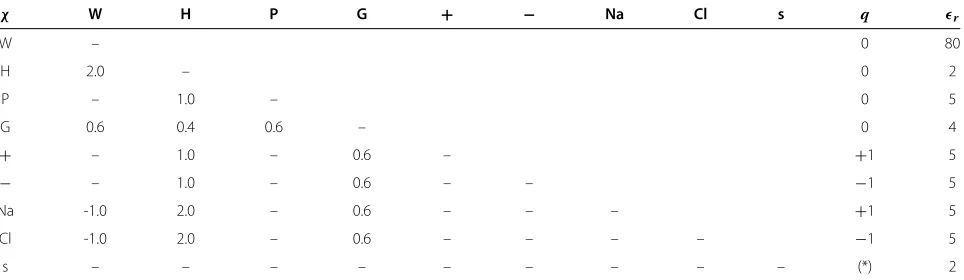
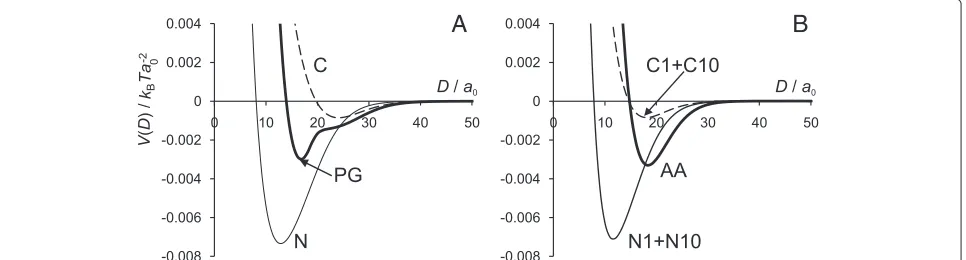
The interaction potential for surfaces with attached N and C terminals (for both models) in conditions of charge bal-ance between surface and chains,|σs| =σNC, is presented in Figures 5 and 6. There is no need for additional coun-terions to satisfy the charge neutrality condition. Ideally we would run the SCF calculation in the absence of added ions, but we are forced to introduce an extremely small concentration of added salt to maintain convergence. Still, the extremely low salt concentration case captures the experimental set up of two IF surfaces immersed in deionised water, where a small salt concentration cannot be avoided. Such is the case of the Jokura experiment [23] where the water extractable materials (NMF) from the SC sample were first released and then deionised water was added. Other extreme cases, where the surface charge is higher or lower than the charge on the terminal chains and addition of certain amount of salt (counterions) is required to obtain the charge neutrality, will be presented and discussed further below.
[image:10.595.58.291.526.683.2]Figure 5 compares the interaction potential for both AA and PG models at low salt content, cs = 10−5M. For both models the interaction potential has a well pro-nounced minimum at D = 17a0 (6.8 nm) for the PG model andD = 18a0 (7.2 nm) for the AA model, cor-responding to net attractive interactions in the system. It is interesting that the separations at which the attrac-tive minimum occurs (D ≈ 7 nm) are in agreement with the experimental values for the distance between the two IFs, D ≈ 8.2 nm [14]. The attraction between the sur-faces at separationsD ≈ 15–35a0 (whereV(D) < 0) occurs due to the well known polyelectrolyte bridging effect [34,37,63,64] and favorable electrostatic conditions (ionic strength). In the limit of low surface coverage, we believe that positively charged end-monomers are
Figure 5Interaction potential in conditions of charge balance. Interaction potentialV(D)for the AA and PG models at the equal absolute charges of surfaces and grafted chains and low salt concentration,cs=10−5M.
attracted to the opposite surface forming bridges across them. The possibility to be simultaneously attracted to more than one surface is more entropically favorable. The volume fraction profiles of the charged monomers dis-cussed above support this picture as the positively charged residues are mostly located near the surface, which indi-cates the possibility of formation either loops or bridges (if the surfaces are close enough). At larger surface sep-arations,D>35a0 the interaction potential approaches zero, indicating that the grafted chains do not interact. However, at short separations, D<15a0, the potential is positive due to strong steric repulsion between the chains.
We should draw attention to the fact that our sim-ple PG model for N and C tails, based on the repet-itive motif of glycine blocks, very well reproduces the result of the more complex AA model based on the amino acid sequence. Both characteristics of the system— the volume fraction profiles and the interaction poten-tial between the IF surfaces—are in a good agreement between the two models. We believe that the PG model can be slightly improved, for example, by introducing some H residues into the C tail model and/or by distribut-ing the charge less blockwise along the chain. Despite its simplicity, the PG model reflects well the properties of the N and C domains and, therefore, it probably can be used as a starting point for more refined (and computa-tional intensive) modeling techniques, such as MC, MD or DPD.
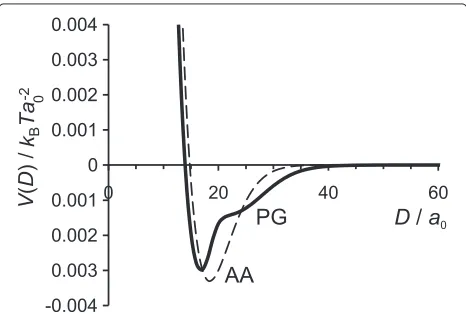
High ionic strength and NMF
A
B
Figure 6Interaction potential for various ionic strength.Interaction potentialV(D)for(A)PG model,(B)AA model for various ionic strength indicated on the graphs at surface-chains charge balance conditions|σs| =σNC. Dashed lines represent data for NMF instead of salt.
higher ionic strength (cs > 0.1 M) the repulsion between the surfaces becomes stronger and more short-ranged.
Calculations at varying levels of salt concentration were aimed at mimicking the Jokura experiments with normal (healthy) and reduced amounts of natural moisturizing factors (NMF) in SC. The amount of NMF is directly responsible for hydration level and elasticity of the skin [23-27]. NMF is made mostly of free amino acids derived from the enzymatic degradation of filaggrin, as well as organic and inorganic salts [23-30]. As charged amino acids and ions are important components of NMF, we have used high ionic strength as the first approximation. Increasing amounts of added salt tips the IFs interac-tion from attractive to repulsive. Experiments show that treatment with potassium lactate, could restore the SC hydration [24].
The next level of increasing complexity in our model was to account for the complex mixture of amino acids in the suspending matrix between the IFs. In order to cre-ate our coarse model of NMF we adopted the amino acid composition form Jacobson et al.[29] and then divided all amino acids into the same groups (H, P, G,+,−) used in the model for N and C tails. The water content was set to 30% as reported in the literature [23,27,65,66] and addition of neutraliser was necessary to ensure charge neutrality in the bulk. The detailed composition of this NMF + water model is given in Table 2.
The interaction potentials for two IF surfaces with grafted terminals immersed into NMF solution are pre-sented in Figure 6 by dashed lines. The graphs clearly illus-trate that the more complex NMF-water mixture leads to an even stronger repulsion. We have observed that the mixture of free amino acids has stronger effect on the interactions between IF surfaces than just adding salt to the solvent; the NMF not only provides a strong repul-sion between the approaching surfaces but also “pushes” the surfaces further away from each other. We believe the reason for such a strong repulsion between the surfaces
rests in the high amount of free charged species (ions and amino acids), but what makes this forces more long ranged is the presence of free neutral amino acids. Solu-tion of only neutral amino acids only slightly decreases the attraction between the surfaces and shifts of the attraction minimum to larger separations.
This result does not support the Jokuraet al.finding that neutral amino acids improve mobility of keratin fibers, as well as basic amino acids, but not acidic ones [23]. Our results showed that only charged species in solution can affect the attractive intermolecular forces between neg-atively charged IF cores with grafted positively charged terminal chains. We should also mention, that in our coarse-grained model we could not reveal the specific effect of basic amino acids, as the properties of positive and negative free amino acids are the same except of the charge and the charge neutrality is required in the bulk. In order to examine the effect of specific ions a more sophisticated model and/or method is required.
Surface charge higher or lower than the charge of the terminals
Previously we have described the case when charge on the surface is fully balanced by charge on the grafted chains
Table 2 Composition of NMF solution
H 13.7%
P 25.5%
G 10.5%
+ 8.4%
− 11.2%
(+)∗ 2.8%
Water 27.9%
Total 100.0%
∗
[image:11.595.304.540.608.725.2]only. As we already mention, some parts of the protofil-aments and, therefore, some of the charged amino acids could be hidden inside the IF core and do not contribute to the charge density. That assumption may leads to the situ-ation when the charges of the grafted tails and surface are not balanced. In order to account for such possibility, in this section we consider cases when the charge of the sur-face is higher or lower than the charge on the grafted tails. In order to obtain charge neutrality in under these condi-tions certain amount of counterions is needed. We do so by setting the concentration of saltcsin the bulk, which is in equilibrium with the gap between the decorated IF surfaces.
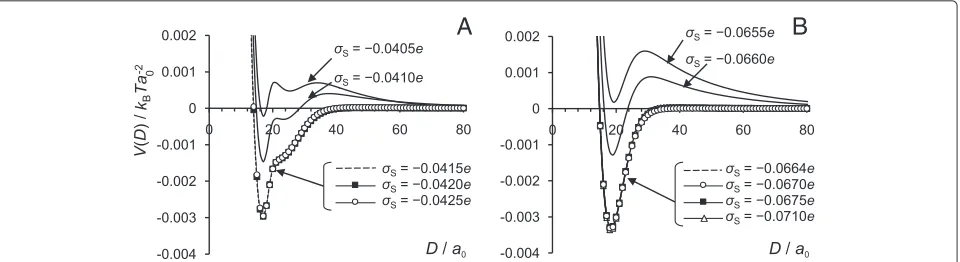
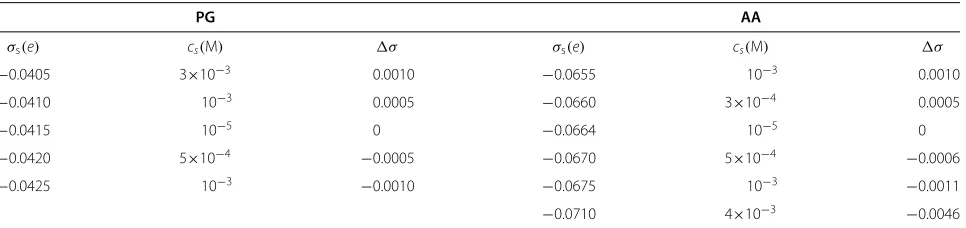
In Figure 7 we present the interaction potential,
V(D), for the surface charge densities ofσs= −0.0655e,
−0.0660e,−0.0664e,−0.0670e,−0.0675e, and−0.0710e
for AA model andσs = −0.0405e,−0.0410e,−0.0415e,
−0.0420e, and−0.0425e for the PG model. The charge on the grafted chains is kept constant at the values of σNC = 0.0664efor the AA model and σNC = 0.0415e for the PG model. Thus, for the AA model, surfaces with charge density |σs|<0.0664e are “undercharged” (in the specific sense that the surface charge density is smaller in absolute value than that needed to balance the charge on the grafted chains) and, correspondingly, with
|σs| > 0.0664ethey are “overcharged”. For the PG model the threshold values of surface charge density for under-charged and overunder-charged surfaces would be, respectively,
|σs|<0.0415eand|σs|>0.0415e.
For each surface charge we found the values of the salt concentration which provide charge balance. The surface charge densities with the balancing salt concentrations are given in Table 3.
In the cases of under- or overcharged surface at low salt concentrations, repulsive electrostatic forces dominate, so the bridging attraction between the covered surfaces could not be seen. At high ionic strength, the repulsion
decreases due to screening. When the surface is over-charged, i.e. when the charge on the surface is higher in absolute value than the charge of the chains, it is pos-sible to find balancing salt concentration, under which the interaction potential between the surfaces would be the same as for the case when the surface charge is fully balanced by the charge of the chains only. The graphs in Figure 7 show that at certain amount of added salt the interaction potential profiles for |σs| ≥0.0664e for the AA model and for |σs| ≥0.0415efor the PG model completely overlap. Table 3 also shows that the stronger the charge imbalance (difference between surface and chains charge), the higher the amount of salt is required to neutralize the charge in the system. However, when the surface is undercharged, the attractive part is reduced and the potential always displays long-ranged repulsion, which increases with increasing charge imbalance. This phenomenology is the consequence of charge screen-ing, as the following simplified model calculation shows. Consider a plane surface with a negative surface charge densityσs, surmounted by a charge cloud at charge den-sity σNC uniformly distributed over a thickness H. We solve the linearised Poisson-Boltzmann equation for this problem,
d2ϕ
dz2 −κ 2
sϕ=
−4πlBσNC/H (0<z<H)
0 (z>H) (1)
whereϕis the electrostatic potential (in units ofkBT/e),
κs is the inverse Debye screening length (κs2 = 8πlBcs), andlBis the Bjerrum length (lB ≈ 0.72 nm). The bound-ary conditions are dϕ/dz = −4πlB|σs| at the wall and
ϕ → 0 as z → ∞, and ϕ should be continuous at
z=Hwith a continuous first derivative. This problem can be solved analytically. The behaviour of the potential at
[image:12.595.61.541.564.695.2]A
B
Table 3 Values for surface charge density (σs) and the corresponding salt concentration (cs) required for charge
neutralization
PG AA
σs(e) cs(M) σ σs(e) cs(M) σ
−0.0405 3×10⁻³ 0.0010 −0.0655 10−3 0.0010
−0.0410 10−3 0.0005 −0.0660 3×10⁻⁴ 0.0005
−0.0415 10−5 0 −0.0664 10−5 0
−0.0420 5×10⁻⁴ −0.0005 −0.0670 5×10⁻⁴ −0.0006
−0.0425 10−3 −0.0010 −0.0675 10−3 −0.0011
−0.0710 4×10⁻³ −0.0046
The difference between the charge densities of the surface and grafted tails is denoted byσ.
distancesz > Hfrom the surface is the relevant piece of information,
ϕ= σNCsinh(κsH)− |σs|κsH
2Hcs ×
e−κsz (z>H). (2)
The prefactor indicates there is a special balance point where the potential vanishes completely forz > H. This point occurs when |σs|/σNC = sinh(κsH)/(κsH). The right hand side is an increasing function of κsH, and only approaches unity for κsH → 0. Thus we see the surface has to be overcharged in order to reach the bal-ance point and a higher degree of overcharging requires a larger value of κsH to compensate, corresponding to higher salt, exactly as found above. The reason for this is that forz≥Hthe surface charge density is screened by an factor∼e−κsH relative to the diffuse oppositely-charged
cloud.
The interactions between negatively charged surfaces covered by positively charged polyelectrolytes were inves-tigated experimentally [67,68] by Monte-Carlo simula-tions [68], and theoretically [69]. The results of these studies have shown that the attractive bridging can dom-inate only when the charges of the polymers and ions balance the charge of the surface. Claesson and Ninham [67] demonstrated that attractive forces between mica surfaces covered by adsorbed chitosan were observed only when electrostatic double layer disappeared, i.e. when surface charges are exactly balanced by the charge of adsorbed polysaccharide. When charge of chitosan, controlled via variation of solution pH, was higher or lower than the charge of the mica surfaces, the electro-static double layer repulsion forces dominate. Dahlgren
et al. [68] measured the force acting between two mica surfaces covered by MAPTAC polyelectrolyte and also carried out MC simulations for two surfaces cov-ered by oppositely charged polyelectrolytes. When PE adsorption was such that the surface charge was bal-anced by the polyelectrolyte, a strong attractive force was observed at short surface separations. Addition of salt to the MAPTAC solution facilitates the increased
adsorption of polyelectrolyte, that leads to a reduced attraction and the appearance of a repulsive double-layer force. The authors concluded that the attractive bridg-ing mechanism will only dominate when the polyelec-trolyte adsorption approximately neutralizes the surface charge density. Borukhovet al.[69] proposed a theoreti-cal approach to explain the behaviour of polyelectrolytes between charged surfaces. Their calculations show that at low ionic strength the attractive interactions between the surfaces take place when polymer adsorption bal-ances surface charge. At high ionic strength the surface charge is balanced both by polymers and ions and the stronger the polymer charge, the more salt is needed to achieve the charge neutrality. The authors also consid-ered values of adsorbed polymer higher or lower than the equilibrium adsorbed amount. When the adsorbed amount was lower than the equilibrium one, the attrac-tion was weaker. However, when the adsorbed amount was higher than the equilibrium one, the results show stronger attraction between the walls and also appearance of strong long-ranged repulsion, similar to those shown in Figure 7.
Role of each type of terminal domains
Why has Nature used two types of unstructured ter-minal domains of similar length scale for each keratin protein? Does each domain type has a specific func-tion and, if so, what is it? Is it necessary to capture the specific differences in a model? Different authors have taken different approaches. In modelling neurofilament projection domains [43-47], the much shorter globular N domains were not included in the study; only the C projection domains were considered. On the contrary, in 3RS tau protein research [48] the authors focused on the 196 amino acid long unstructured N domains. Thus, as the role of each domain in keratins is yet unknown, in order to generate insights, we decided to take advantage of fast computer models and examine the interactions mediated by each type of terminal domains separately.
Figure 8 shows the interaction potentials for the IF cores grafted only with N domains or only C domains. The graphs from Figure 8 summarize the results and compare them against the full model calculations. For the calcu-lation of only one type of domains, the grafting density of the chains was kept the same as before,σ = 0.00415; this is half the total grafting density for both chain types together (σ =0.0083). The charge on the surface was then adjusted to neutralize the charge from the chains,σs = −0.0332efor the AA model andσs = −0.02075efor the PG model.
When only N chains are present, the minimum becomes much deeper and is shifted closer to the surface. Even with the addition of 0.1M of salt this attraction mini-mum is still quite deep (data not shown). Apparently, the more hydrophobic N tails behave as a “glue”, holding together the two surfaces. In contrast, the C tails behave in the opposite way. The interaction potentials for a sim-ilar model including C-tails only result in much smaller attraction minimum, pushed away from the surface. The more polar C-tails contribute much less to the attraction between the IF surfaces.
It is tempting to propose that both N and C domains play important roles in the structure and interactions of skin keratin IFs. The more hydrophobic N chains bring about a strong attraction between the IF surfaces while the more polar C tails push the surfaces away from each other, so that the two types of domains work together to keep IFs at the optimal separation. Therefore, we believe that it is the combination of both types of the domains balances the interactions between the intermediate filaments.
Conclusions
We have applied the SCF approach to study interactions of the unstructured N and C terminal domains of skin ker-atin (K1/K10) Intermediate Filaments. Positively charged N and C domains were grafted onto negatively charged IF cores, represented by planar surfaces. We have considered two models for N and C tails, characterized by a differ-ent level of detail: the coarse block-copolymer PG model and the more detailed AA model, which is based on the amino acid sequence. In spite of the apparent simplicity of the PG model, it qualitatively captures most of the effects observed for the more complex AA model. We have pre-sented monomer density profiles for the N and C tails and, separately, profiles for their basic residues only. We have compared and discussed interaction potential profiles for IF surfaces with attached tails at various surface charge densities, ionic strengths, and for the solution of free amino acids representing NMF. We have also attempted to clarify the role of each type of terminal domains con-sidering N and C chains separately. Our main findings are summarized as follows.
(A) Volume fraction profiles for N and C domains show that the monomers of both types of the chains are mostly concentrated near the surface, so the chain extension does not exceedr≈20a0=8nm
(Figure 3). The basic residues of the terminal domains, which are located near the end of the chains, have the highest density at the (oppositely
[image:14.595.59.542.573.703.2]A
B
charged) surface (Figure 4). These results indicate that the chains form either loops or bridges with another surface. Such bridges lead to attractive interactions between the two IF surfaces at short separations. N tails are more hydrophobic and the profiles for N tails are more narrow compared to those for C tails and extend for no more than r≈15a0from the surface. The interaction potential
for surfaces covered by N domain type only reveals that the attractive interactions between the surfaces are stronger than those when both types of the domains considered together and appear at shorter separations (Figure 8). So we conclude that N tails work as the “glue” between IF surfaces. C tails are slightly more polar than N tails and extend slightly further into the solution (r≈20a0). The interactions
between surfaces with only C tails grafted show much weaker and more long-ranged attraction. So, we propose that C chains are “responsible” for keeping a certain distance between IF. Hence, each type of the terminal domains has its specific role and their combination retain IF at certain distance. (B) When the charge of the IF surface is neutralized by
the charge on the grafted chains and the ionic strength is low, IFs experience attractive force between each other at surface separations D≈15–35a0(6–14nm) due to bridging effect of
grafted terminal domains. This attraction becomes weaker and turns into repulsion with increase of ionic strength as a result of electrostatic screening. The repulsion become stronger and longer ranged when simple aqueous electrolyte solution between the IF surfaces is replaced by a complex “broth” of amino acids—a coarse grained representation of NMF in 30% water. However, we can not confirm experimental observations of Jokuraet al. [23] that neutral amino acids alone produce a similar effect. We have found that charged small species such as ions or charged amino acids are necessary components of NMF and their role is to decrease electrostatic forces between IF. The effect of salt when ions differ not only by their charge but also by size should be investigated using more complicated model for salt molecules or/and by other simulation methods.
(C) At low ionic strength the attraction between the IF surfaces can be obtained only when the charge on the surface is fully compensated by the charge on the chains and ions. That occurs only when the surface charge is equal or slightly higher than the charge of the grafted terminal domains. Therefore, we propose that: (i) negative charge of the IF helical part is equal in absolute value or slightly higher than the positive charge of the IF terminal domains; (ii) the function of
NMF is to prevent the attractive forces between protruding terminal domains and IF helical cores. When NMF are removed or their amount is highly reduced these attractive forces “glue” keratin Intermediate Filaments and reduce the elasticity of the corneocytes.
Abbreviations
NMF: Natural moisturizing factors; SC: Stratum corneum; K: Keratin; K1/K10: Keratin 1/Keratin 10; IF: Intermediate filament; SCF: Self-consistent field; AA: Amino acid model for unstructured domains; PG: Polyglycine model for unstructured domains.
Competing interests
The authors declare competing financial interests. PBW and MGN are staff scientists whose salaries are paid by Unilever. Unilever has paid the article processing charge. PBW and MGN declare they hold Unilever shares.
Authors’ contributions
AA and EJP performed the modelling. AA and PBW wrote the paper. MGN supervised the project and reviewed the paper. All authors read and approved the final manuscript.
Acknowledgements
The authors thank Chinmay Das, Peter Olmsted, Eugene Pashkovski, Jan Marzinek, and Frans Leermakers for useful discussions. Financial support from ERDF (grant B/680) and SoftComp (grant RV(02)-11/390) is gratefully acknowledged.
Author details
1Unilever R&D Port Sunlight, Quarry Road East, Bebington, Wirral, CH63 3JW, UK.2School of Chemical Engineering & Analytical Science, The University of Manchester, Oxford Road, Manchester, M13 9PL, UK.3Institut Curie Centre de Recherche, CNRS UMR 168 - UPMC, F-75231, Paris Cedex 05, France.
Received: 2 May 2013 Accepted: 22 August 2013 Published: 5 September 2013
References
1. Michaels AS, Chandrasekaran SK, Shaw JE:Drug permeation through
human skin: theory and in vitro experimental measurement.AlChE J
1975,21(5):985–996.
2. Elias PM:Epidermal barrier function: intercellular lamellar lipid
structures, origin, composition and metabolism.J Control Release
1991,15:199–208.
3. Sparr E, Wennerström H:Diffusion through a responding lamellar liquid crystal: a model of molecular transport across stratum corneum.Colloids Surf B: Biointerfaces2000,19:103–116.
4. Lee D, Ashcraft JN, Verploegen E, Pashkovski E, Weitz DA:Permeability of model stratum corneum lipid membrane measured using quartz
crystal microbalance.Langmuir2009,25(10):5762–5766.
5. Schweizer J, Bowden PE, Coulombe PA, Langbein L, Lane EB, Magin TM, Maltais L, Omary MB, Parry DAD, Rogers MA, Wright MW:New consensus
nomenclature for mammalian keratins.J Cell Biol2006,174:169–174.
6. Moll R, Divo M, Langbein L:The human keratins: biology and pathology.Histochem Cell Biol2008,129:703–733.
7. Gu L, Coulombe PA:Keratin function in skin epithelia: a broadening palette with surprising shades.Curr Opin Cell Biol2007,19:13–23. 8. Steinert PM:Analysis of the mechanism of assembly of mouse keratin
1/keratin 10 intermediate filaments in vitro suggests that intermediate filaments are built from multiple oligomeric units rather than a unique tetrameric building block.J Struct Biol1991,
107:175–188.
9. Paramio J, Jorcano J:Assembly dynamics of epidermal keratins K1 and K10 in transfected cells.Exp Cell Res1994,215:319–331.
10. Norlén L:Stratum corneum keratin structure, function and formation - a comprehensive review.Int J Cosmetic Sci2006,28:397–425. 11. Alberts B, Johnson A, Lewis J, Raff M, Roberts K, Walter P:Molecular Biology
12. Coulombe PA, Fuchs E:Elucidating the early stages of keratin filament assembly.J Cell Biol1990,111:153–169.
13. Fuchs E, Cleveland DW:A structural scaffolding of intermediate filaments in health and disease.Science1998,279:514–519. 14. Norlén L, Al-Amoudi A:Stratum corneum keratin structure, function,
and formation: the cubic rod-packing and membrane templating model.J Invest Dermatol2004,123:715–732.
15. Norlén L, Masich S, Goldie KN, Hoenger A:Structural analysis of vimentin and keratin intermediate filaments by cryo-electron
tomography.Exp Cell Res2007,313:2217–2227.
16. Norlén L:Exploring skin structure using cryo-electron microscopy
and tomography.Eur J Dermatol2008,18:279–284.
17. Schmuth M, Gruber R, Elias PM, Williams ML:Ichthyosis update: towards a function-driven model of pathogenesis of the disorders of cornification and the role of corneocyte proteins in these disorders.Adv Dermatol2007,23:231–256.
18. Johnson AW, Harley BAC:Mechanobiology of Cell-Cell and Cell-Matrix Interactions. New York: Springer; 2011.
19. Parry DAD, Steinert PM:Intermediate Filament Structure. New York: Springer-Verlag; 1995.
20. Herrmann H, Aebi U:Intermediate Filaments: Molecular structure, assembly mechanism, and integration into functionally distinct intracellular scaffolds.Annu Rev Biochem2004,73:749–789. 21. Aebi U, Fowler WE, Rew P, Sun TT:The fibrillar substructure of keratin
filaments unraveled.J Cell Biol1983,97:1131–1141.
22. Chernyatina AA, Nicoleta S, Aebi U, Herrmann H, Strelkov SV:Atomic
structure of the vimentin centralα-helical domain and its
implications for intermediate filament assembly.PNAS2012,
109:13620–13625.
23. Jokura Y, Ishikawa S, Tokuda H, Imokawa G:Molecular analysis of elastic properties of the stratum corneum by solid-state 13C-nuclear
magnetic resonance spectroscopy.J Invest Dermatol1995,
104:806–812.
24. Nakagawa N, Sakai S, Matsumoto M, Yamada K, Nagano M, Yuki T, Sumida Y, Uchiwa H:Relationship between NMF (lactate and potassium) content and the physical properties of the stratum corneum in healthy subjects.J Invest Dermatol2004,122:755–763.
25. Scott IR, Harding CR:Filaggrin breakdown to water binding compounds during development of the rat stratum corneum is
controlled by the water activity of the environment.Dev Biol1986,
115:84–92.
26. Harding CR:The stratum corneum: structure and function in health and disease.Dermatol Ther2004,17:6–15.
27. Rawlings AV, Harding CR:Moisturization and skin barrier function.
Dermatol Ther2004,17:43–48.
28. Takada S, Naito S, Sonoda J, Miyauchi Y:Noninvasive in vivo measurement of natural moisturizing factor content in stratum corneum of human skin by attenuated total reflection infrared spectroscopy.Appl Spectrosc2012,66:26–32.
29. Jacobson TM, Yüksel KU, Geesin JC, Gordon JS, Lane AT, Gracy RW:Effects of aging and xerosis on the amino acid composition of human skin.
J Invest Dermatol1990,95:296–300.
30. Rawlings AV, Scott IR, Harding CR, Bowser PA:Stratum corneum moisturization at the molecular level.J Invest Dermatol1994,
103:731–741.
31. Fleer GJ, Cohen Stuart MA, Scheutjens JMHM, Cosgrove T, Vincent B: Polymers at Interfaces. New York: Springer; 1993.
32. Israels R, Scheutjens JMHM, Fleer GJ:Adsorption of ionic block-copolymers - self-consistent-field analysis and scaling
predictions.Macromol1993,26:5405–5413.
33. Israels R, Leermakers FAM, Fleer GJ:On the theory of grafted weak
polyacids.Macromol1994,27:3087–3093.
34. Böhmer MR, Evers OA, Scheutjens JMHM:Weak polyelectrolytes
between 2 surfaces - adsorption and stabilization.Macromol1990,
23:2288–2301.
35. Evers OA, Scheutjens JMHM, Fleer GJ:Statistical thermodynamics of block copolymer adsorption. 1. Formulation of the model and
results for the adsorbed layer structure.Macromol1990,
23:5221–5233.
36. Evers OA, Scheutjens JMHM, Fleer GJ:Statistical thermodynamics of block copolymer adsorption. Part 2. - Effect of chain composition on
the adsorbed amount and layer thickness.J Chem Soc Faraday Trans
1990,86:1333–1340.
37. Evers OA, Scheutjens JMHM, Fleer GJ:Statistical thermodynamics of block copolymer adsorption. 3. Interaction between adsorbed
layers of block copolymers.Macromol1991,24:5558–5566.
38. Leermakers FAM, Atkinson PJ, Dickinson E, Horne DS:
Self-consistent-field modeling of adsorbedβ-casein: effects of pH
and ionic strength on surface coverage and density profile.J Coll Int Sci1996,178:681–693.
39. Dickinson E, Horne DS, Pinfield VJ, Leermakers FAM:Self-consistent-field modelling of casein adsorption - comparison of results for αS1-casein andβ-casein.J Chem Soc Faraday Trans1997,93:425–432. 40. Dickinson E, Pinfield VJ, Horne DS, Leermakers FAM:Self-consistent-field
modelling of adsorbed casein: interaction between two
protein-coated surfaces.J Chem Soc Faraday Trans1997,93:1785–1790.
41. Ettelaie R, Akinshina A, Dickinson E:Mixed protein-polysaccharide interfacial layers: a self consistent field calculation study.Faraday Discuss2008,139:161–178.
42. Akinshina A, Ettelaie R, Dickinson E, Smyth G:Interactions between
adsorbed layers ofαS1-casein with covalently bound side chains: a
self-consistent field study.Biomacromolecules2008,9:3188–3200. 43. Zhulina EB, Leermakers FAM:A self-consistent field analysis of the
neurofilament brush with amino-acid resolution.Biophys J2007,
93:1421–1430.
44. Zhulina EB, Leermakers FAM:Effect of the ionic strength and pH on
the equilibrium structure of a neurofilament brush.Biophys J2007,
93:1452–1463.
45. Zhulina EB, Leermakers FAM:On the polyelectrolyte brush model of neurofilaments.Soft Matter2009,5:2836–2840.
46. Zhulina EB, Leermakers FAM:The polymer brush model of
neurofilament projections: effect of protein composition.Biophys J
2010,98:462–469.
47. Leermakers FAM, Zhulina EB:How the projection domains of NF-L and
α-internexin determine the conformations of NF-M and NF-H in
neurofilaments.Eur Biophys J2010,39:1323–1334.
48. Leermakers FAM, Jho YS, Zhulina EB:Modeling of the 3RS tau protein
with self-consistent field method and Monte Carlo simulation.Soft
Matter2010,6:5533–5540.
49. Human Intermediate Filament Database.[See http://www.interfil.
org/]
50. Ohnishi S, Kamikubo H, Onitsuka M, Kataoka M, Shortle D:
Conformational preference of polyglycine in solution to elongated
structure.J Am Chem Soc2006,128:16338–16344.
51. Bykov S, Asher S:Raman studies of solution polyglycine
conformations.J Phys Chem B2010,114:6636–6641.
52. Nozaki Y, Tanford C:The solubility of amino acids and two glycine peptides in aqueous ethanol and dioxane solutions - establishment of a hydrophobicity scale.J Biol Chem1971,246:2211–2217. 53. Lu J, Wang XJ, Yang X, Ching CB:Solubilities of glycine and its
oligopeptides in aqueous solutions.J Chem Eng Data2006,
51:1593–1596.
54. Hanson KM, Behne MJ, Barry NP, Mauro TM, Gratton E, Clegg RM:
Two-photon fluorescence lifetime imaging of the skin stratum
corneum pH gradient.Biophys J2002,83:1682–1690.
55. Parra JL, Paye M:EEMCO guidance for the in vivo assessment of skin surface pH.Skin Pharmacol Appl2003,16:188–202.
56. Åberg C, Wennerström H, Sparr E:Transport processes in responding lipid membranes: a possible mechanism for the pH gradient in the
stratum corneum.Langmuir2008,24:8061–8070.
57. Carta R:Solubilities of L-Cystine, L-Tyrosine, L-Leucine, and Glycine in their water solutions.J Chem Eng Data1999,44:563–567.
58. Amino Acid Repository.Jena Library of Biological Macromolecules. [See
http://www.imb-jena.de/IMAGE_AA.html]
59. Fuchs E, Weber K:Intermediate filaments: structure, dynamics,
function, and disease.Annu Rev Biochem1994,63:345–382.
61. Steinert PM, Mack JW, Korge BP, Gan SQ, Haynes SR, Steven AC:Glycine loops in proteins: their occurrence in certain intermediate filament chains, loricrins and single-stranded RNA binding proteins.Int J Biol Macromol1991,13:130–139.
62. Israelachvili JN:Intermolecular and Surface Forces. Burlington: Academic Press; 2011.
63. Scheutjens JMHM, Fleer GJ:Interaction between two adsorbed
polymer layers.Macromol1985,18:1882–1900.
64. Miklavic SJ, Woodward CE, Jönsson B, Åkesson T:The interaction of charged surfaces with grafted polyelectrolytes: a
Poisson-Boltzmann and Monte Carlo study.Macromol1990,
23(18):4149–4157.
65. Warner RR, Myers MC, Taylor DA:Electron probe analysis of human
skin: determination of the water concentration profile.J Invest
Dermatol1988,90:218–224.
66. Caspers PJ, Lucassen GW, Carter EA, Bruining HA, Puppels GJ:In vivo confocal Raman microspectroscopy of the skin: noninvasive
determination of molecular concentration profiles.J Invest Dermatol
2001,116:434–442.
67. Claesson P, Ninham B:pH-Dependent interactions between adsorbed
chitosan layers.Langmuir1992,8:1406–1412.
68. Dahlgren MAG, Waltermo Å, Blomberg E, Claesson PM, Sjöström L, Åkesson T, Jönsson B:Salt effects on the interaction between adsorbed cationic polyelectrolyte layers: theory and experiment.
J Phys Chem1993,97:11769–11775.
69. Borukhov I, Andelman D, Orland H:Effect of polyelectrolyte adsorption on intercolloidal forces.J Phys Chem B1999,103:5042–5057.
doi:10.1186/2046-1682-6-12
Cite this article as:Akinshinaet al.:Self-consistent field theory for the interactions between keratin intermediate filaments.BMC Biophysics2013 6:12.
Submit your next manuscript to BioMed Central and take full advantage of:
• Convenient online submission
• Thorough peer review
• No space constraints or color figure charges
• Immediate publication on acceptance
• Inclusion in PubMed, CAS, Scopus and Google Scholar
• Research which is freely available for redistribution