R E S E A R C H
Open Access
Characterizing and measuring bias in
sequence data
Michael G Ross
*, Carsten Russ, Maura Costello, Andrew Hollinger, Niall J Lennon, Ryan Hegarty, Chad Nusbaum
and David B Jaffe
Abstract
Background:DNA sequencing technologies deviate from the ideal uniform distribution of reads. These biases impair scientific and medical applications. Accordingly, we have developed computational methods for discovering, describing and measuring bias.
Results:We applied these methods to the Illumina, Ion Torrent, Pacific Biosciences and Complete Genomics sequencing platforms, using data from human and from a set of microbes with diverse base compositions. As in previous work, library construction conditions significantly influence sequencing bias. Pacific Biosciences coverage levels are the least biased, followed by Illumina, although all technologies exhibit error-rate biases in high- and low-GC regions and at long homopolymer runs. The GC-rich regions prone to low coverage include a number of human promoters, so we therefore catalog 1,000 that were exceptionally resistant to sequencing. Our results indicate that combining data from two technologies can reduce coverage bias if the biases in the component technologies are complementary and of similar magnitude. Analysis of Illumina data representing 120-fold coverage of a well-studied human sample reveals that 0.20% of the autosomal genome was covered at less than 10% of the genome-wide average. Excluding locations that were similar to known bias motifs or likely due to sample-reference variations left only 0.045% of the autosomal genome with unexplained poor coverage.
Conclusions:The assays presented in this paper provide a comprehensive view of sequencing bias, which can be used to drive laboratory improvements and to monitor production processes. Development guided by these assays should result in improved genome assemblies and better coverage of biologically important loci.
Background
Ideal whole-genome shotgun DNA sequencing would distribute reads uniformly across the genome and with-out sequence-dependent variations in quality. All existing sequencing technologies fall short of this ideal and exhi-bit various types and degrees of bias. Sequencing bias degrades genomic data applications, including genome assembly and variation discovery, which rely on genome-wide coverage. Undercovered regions might lead to a missed SNP in an important region or cause an assem-bler to produce shorter contigs. For example, Figure 1 plots the coverage of the transcription start site and first exon of human geneNCS1, which encodes a neurotrans-mitter regulator [1], in whole-genome shotgun sequen-cing (data set A2). Despite 198-fold mean coverage of the
genome, the first 72 bases of this exon are completely uncovered. This type of bias can reduce the effectiveness of biological and medical research. Recently published work on drug-resistant tuberculosis identified thousands of zero-coverage sites in an entire class of the bacterium’s genes, despite sequencing to an average depth of 134× [2]. Alleviating gaps or dips in coverage through addi-tional reads inflates sequencing costs, and may have lim-ited effectiveness. For these reasons, improving our knowledge of sequencing bias is essential to improving the utility of DNA sequencing data.
Our goal in this work was to develop a rigorous method for discovering and monitoring coverage and error biases, then to apply it to data from a wide range of sequencing platforms (Illumina HiSeq and MiSeq, Ion Torrent PGM, Pacific Biosciences RS, and the Complete Genomics sequencing service). This study complements previous work in the field [3-7].
* Correspondence: [email protected]
The Broad Institute, 7 Cambridge Center, Cambridge, MA 02142, USA
Bias manifests in multiple ways. Coverage bias is a deviation from the uniform distribution of reads across the genome. Similarly, error bias is a deviation from the expectation of uniform mismatch, insertion, and deletion rates in reads across the genome. This paper focuses pri-marily on coverage bias because it is the most damaging sequencing failure.
Sequencing technologies are vulnerable to multiple sources of bias. Methods based on bacterial cloning and Sanger-chemistry sequencing [8] were subject to many coverage-reducing biases, notably at GC extremes, palin-dromes, inverted repeats, and sequences toxic to the bacterial host [9-17]. Illumina sequencing [18] has been shown to lose coverage in regions of high or low GC [19-22], a phenomenon also seen in other‘ next-genera-tion’technologies [3,6]. PCR amplification during library construction is a known source of undercoverage of GC-extreme regions [20,21] and similar biases may also be introduced during bridge PCR for cluster amplification
on the Illumina flowcell [23]. Illumina strand-specific errors can lead to coverage biases by impairing aligner performance [24]. Ion Torrent [25], like 454 [26], utilizes a terminator-free chemistry that may limit its ability to accurately sequence long homopolymers [4,27,28], and may also be sensitive to coverage biases introduced by emulsion PCR in library construction. Complete Geno-mics [29] also uses amplification along with a complex library construction process. The Pacific Biosciences [30] process is amplification-free; therefore, one might expect it to exhibit lower levels of coverage bias than the other technologies.
In addition to sources in the wet lab, bias can be intro-duced by any of the computational steps in the sequencing pipeline. Signal-processing and base calling limitations could result in under-representation or increased error rates in some locations, as can inaccurate alignment. An inaccurate reference or sample-reference differences can cause coverage or accuracy variations that may be
160
0
20
40
60
80
100
120
140
NCS1
Exon 1
Intron 1
*
*=transcription start site
100 bases
C
[image:2.595.59.539.88.445.2]overage
Figure 1Diagram illustrating the low coverage ofNCS1exon 1 in 198× Illumina HiSeq shotgun data. The first 72 bases of the first exon of human geneNCS1, including the transcription start site, were uncovered in a 198× whole-genome shotgun data set (#A2). The displayed 2,000 base region is chromosome 9:132,933,910-132,935,910.NCS1encodes calcium-binding proteins that regulate neurotransmitter release [1]. Rosset al.Genome Biology2013,14:R51
http://genomebiology.com/2013/14/5/R51
misdiagnosed as sequencing bias. Therefore, detecting bias is only the first step and must be followed by more detailed experiments to assign responsibility to the library prepara-tion, sequencing, or computational stages.
We employ two methodologies for measuring bias. Per-base bias measurements, which rely on deep-coverage sequencing, are hypothesis-free and ideal for discovering new types of bias. Motif bias measurements, which require only shallow-coverage sequencing, are ideal for compari-sons across experimental conditions and for monitoring ongoing sequencing pipeline performance at known bias-prone sequence contexts and locations. Bias motif moni-toring plays a useful role by providing a critical metric in determining and ameliorating the sources of sequencing bias. Together these methodologies can be used to com-pare platforms, to measure the utility of combining data from multiple platforms, and to determine the extent to which coverage bias is described by the statistics of known motifs.
Results and discussion
Per-base bias
We begin by defining the bias statistics. The fundamen-tal statistic of coverage bias is‘relative coverage’, which is defined as:
coverage of a gieven reference base in a genome mean coverage of all reference bases .
The coverage of a given reference base is computed by counting the number of read bases mapped to it in an alignment (see Materials and methods). The mean cov-erage is computed by averaging this value across every base in the reference. Then the relative coverage for a particular base is computed as the ratio of these values. A relative coverage of 1 indicates that a particular base is covered at the expected average rate. A relative cover-age above 1 indicates higher than expected covercover-age and below 1 indicates lower than expected coverage.
Some reads cannot be mapped to a single locus, and the probability of ambiguous mapping increases as reads become shorter or less accurate. Ambiguous mapping is also more likely for reads that derive from repetitive or low complexity regions of the genome, including some regions with extreme GC content. To solve this problem, we rely on the aligner employing a policy of random assignment when there are multiple‘best’alignments. This provides the optimal measurement of coverage bias given the data: it is impossible to know whether specific loca-tions are evenly represented, but we can nonetheless expect to accurately assess the coverage of classes of bases as defined by some local sequence context (for example, involving GC content, and so on). All the alignment
algorithms used in this work (see Materials and methods) use this random-placement policy.
Bases having low relative coverage are of particular interest, provided that the low coverage is not an acci-dent of sample size. For example, at 20-fold mean cov-erage, some bases whose ‘true’ relative coverage is 1 (corresponding to an expectation of 20 overlapping reads), will occasionally have measured relative coverage of 0.5 (corresponding to an observation of 10 overlap-ping reads), as that measurement is only off by (20−10)/√20≈2.2standard deviations (based on a Poisson model). Thus, deep sequencing is required to accurately identify bases having low relative coverage.
Motif bias
Typically, only a small fraction of a genome has‘low’ rela-tive coverage. For example, 198-fold mean coverage of the human genome by Illumina HiSeq 2000 version 2 chemis-try only left 0.23% of bases undercovered by a factor of 10 or more (data set A2). At first glance, this portion of the genome appears minuscule, but if the data were unbiased, we would expect no bases to have such a low level of cov-erage (more than 12 standard deviations less than the mean). Additionally, this small undercovered fraction included important loci. For example, this deep-coverage HiSeq data set contained no reads overlapping the tran-scription start sites of several genes associated with early development, transcriptional regulation, cell-cell adhesion, actin binding, neural development, and intracellular sig-naling (for an example, see Figure 1). Thus, understanding the specific nature of undercovered sequences is impor-tant. We approached this problem in two ways: by evaluat-ing specific biologically important regions of the genome that are significantly undercovered, and by identifying spe-cific sequence motifs that are systematically undercovered. Anecdotal results suggested that many transcription start sites or first exons in the human genome tend to have poor coverage. By a systematic analysis of these regions we defined the 1,000 with the lowest relative coverage based on low coverage by an Illumina data set, which we term the‘bad promoters’list (see Materials and methods). The bad promoters are, like many exons, GC-rich (averaging 79% GC composition).
We developed a list of five bias motifs that encapsu-late several common sources of coverage bias:
• GC≤ 10%, 200-base regions in which the middle 100 bases have ≤10% GC content;
• GC≥ 75%, 200-base regions in which the middle 100 bases have ≥75% GC content;
• GC≥ 85%, 200-base regions in which the middle 100 bases have ≥85% GC content;
• (AT)15, 130-base regions in which the middle 30 bases are repeated AT dinucleotides;
• G|C≥80%, 130-base regions in which the middle 30 bases are either 80% Gs or 80% Cs (and, there-fore, match long G or C homopolymers).
For human data, we added a sixth motif based on the aforementioned list of undercovered transcription start sites: the 1,000 empirically defined‘bad promoter’ 200-base intervals from the human genome (as defined above; coordinates reported in Additional file 1).
The‘special’motifs (AT)15and G|C≥80% are included based on anecdotal evidence that contig breaks in assem-blies are frequently associated with these motifs. The extents of all the motifs in the reference genomes studied in this paper are presented in Table 1. The decision to attend to regions of 100 to 200 bases was an empirical choice influenced by considerations such as the distribu-tion of fragment sizes in our Illumina libraries. Computing our statistics using larger or smaller regions might make different biases apparent depending on the properties of the assayed data set.
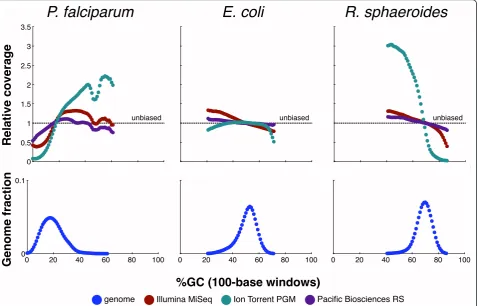
These motifs focus on known trouble spots. Because GC base composition is frequently implicated in coverage bias, it is also useful to measure the relative coverage across the entire GC spectrum by grouping all 100-base sliding windows across the genome by their GC content and reporting the average relative coverage for each GC-content percentage (in effect defining a motif for each percentage). The results can be presented as a GC-bias plot, as exemplified in Figure 2. Unbiased sequencing would be unaffected by GC composition, resulting in a flat line along relative coverage = 1.
Because motifs are typically represented by many loci in a genome, the number of reads incident upon a motif
is much larger than the number of reads incident upon a single base, and hence the relative coverage of a motif (that is, the mean of the relative coverages of its consti-tuent bases) can be accurately measured even with low sequencing coverage.
Table 2 presents relative coverage of the six motifs across 16 data sets. From data set 14 (120-fold coverage of Illumina from the human genome) we also chose ten 0.5-fold random subsets, in each case computing the relative coverage across the motifs. For each motif, we show (data set 14’) the mean of these ten measurements, which for all motifs were within 0.01 of the full sample value, and the observed standard deviation, which for all motifs was approximately 0.02 or less. This shows that for the human genome, relative coverage of the six motifs can be accurately assayed using low coverage.
Comparing bias across technologies
Bias in a GC-spanning set of microbes
To assess the bias profile across technologies efficiently, we generated data from three microbial genomes that together span a wide range of GC base composition:
Plasmodium falciparum(mean 19% GC),Escherichia coli
(51%) andRhodobacter sphaeroides(69%). All three gen-omes have finished reference sequences, thus facilitating a definitive analysis (see Materials and methods). Only data from Illumina (MiSeq), Ion Torrent and Pacific Biosciences were examined, not from Complete Geno-mics, which generates only human sequencing data. For all analyses, we note that although results are categorized by sequencing technology, in fact bias can also be intro-duced by library construction, and that disentanglement of these variables would require additional experiments. For the following bacterial genome analysis, Illumina libraries were made following a low-input variation of the protocol detailed in Fisheret al.[31], modified with Kapa Biosystems reagents (see Materials and methods), and both Ion Torrent and Pacific Bioscience libraries were generated using the respective manufacturers’reagents and recommended protocols (see Materials and methods).
[image:4.595.57.546.643.719.2]We first asked how much of each of the three gen-omes was undercovered by each of the three technolo-gies (Table 3, 1 to 9, italics), ensuring comparability by
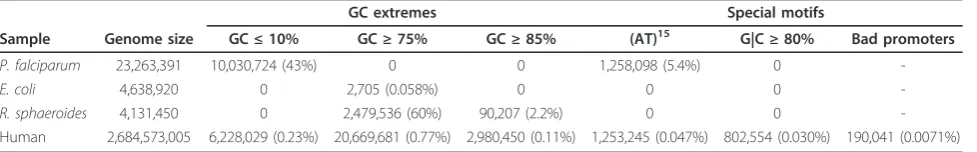
Table 1 Genomes and motifs
GC extremes Special motifs
Sample Genome size GC≤10% GC≥75% GC≥85% (AT)15 G|C≥80% Bad promoters
P. falciparum 23,263,391 10,030,724 (43%) 0 0 1,258,098 (5.4%) 0
-E. coli 4,638,920 0 2,705 (0.058%) 0 0 0
-R. sphaeroides 4,131,450 0 2,479,536 (60%) 90,207 (2.2%) 0 0
-Human 2,684,573,005 6,228,029 (0.23%) 20,669,681 (0.77%) 2,980,450 (0.11%) 1,253,245 (0.047%) 802,554 (0.030%) 190,041 (0.0071%)
For each genome sequenced as part of this work, we show its size in bases, along with the number of bases of each bias motif (see text). Only unambiguous (A, C, T, or G) bases from each reference are included. Plasmids, mitochondria, and sex chromosomes were excluded from the counts.
Rosset al.Genome Biology2013,14:R51 http://genomebiology.com/2013/14/5/R51
downsampling each data set to 100-fold coverage, and testing several levels of relative coverage (0.5, 0.25, 0.1 and no coverage). While modest variation was seen for
E. coli on all three platforms, the results for the GC-extreme genomes were striking. For example, the fraction of the GC-poorP. falciparumgenome that had relative coverage≤0.25 (that is, four-fold undercovered or worse) ranged from 0.33% in Pacific Biosciences data (best) to 3.7% in Illumina data to 22% in Ion Torrent data (worst). In the GC-richR. sphaeroides genome, the four-fold undercoverage fractions were 0.0071% for Pacific Bios-ciences (best), 0.39% for Illumina, and 36% for Ion Torrent (worst). The better performance of Pacific Bios-ciences is probably attributable to the lack of any amplifi-cation in their process (compare [20,21]).
Next, to better understand what parts of the genome were undercovered, we generated GC-bias plots (Figure 2), showing relative coverage at each GC level (and for con-text, the fraction of the genome at each level). These plots provide fine detail but also mirror the preceding conclu-sions, exhibiting the same hierarchy at GC extremes. For example, Ion Torrent coverage dropped severely below 10% and above 75% GC. On the other hand, all three
technologies provided nearly even coverage of the moder-ate-GC range (30 to 70%) inE. coli. At the lowest GC, even Pacific Biosciences showed approximately two-fold coverage reduction, perhaps attributable to dissociation of fragment ends in adapter ligation, a phenomenon that could apply to all three technologies.
Finally, Table 2 (data sets 1 to 9) presents the relative coverage of the previously described motifs, although not all are present in each sample (the G|C≥80% motif is absent in all of the microbes, and the set of bad promoters was only defined for the human genome). We note that the single statistic of relative coverage for the GC≥85% motif provided a suitable assay for bias onR. sphaeroides, with Pacific Biosciences scoring 0.87 (best), Illumina 0.60 and Ion Torrent 0.10 (worst), while GC ≥75% did not clearly distinguish between Illumina and Pacific Bio-sciences data. The GC≤10% motif was similarly useful for
P. falciparum, with Pacific Biosciences scoring 0.89 (best), Illumina 0.58, and Ion Torrent 0.39 (worst). For these data, the (AT)15motif also stood out, with Pacific Bios-ciences at 0.85, Illumina at 0.43, and Ion Torrent at 0.11. Importantly, just these few statistics provided a meaningful readout on the performance of the different technologies.
100
0 20 40 60 80
3.5
0 0.5 1 1.5 2 2.5 3
unbiased
100
0 20 40 60 80
3.5
0 0.5 1 1.5 2 2.5 3
unbiased
100
0 20 40 60 80
3.5
0 0.5 1 1.5 2 2.5 3
unbiased
100
0 20 40 60 80
0.1
0
100
0 20 40 60 80
0.1
0
100
0 20 40 60 80
0.1
0
Relative coverage
G
enome fraction
P. falciparum
E. coli
R. sphaeroides
%GC (100-base windows)
[image:5.595.61.540.90.396.2]genome Illumina MiSeq Ion Torrent PGM Pacific Biosciences RS
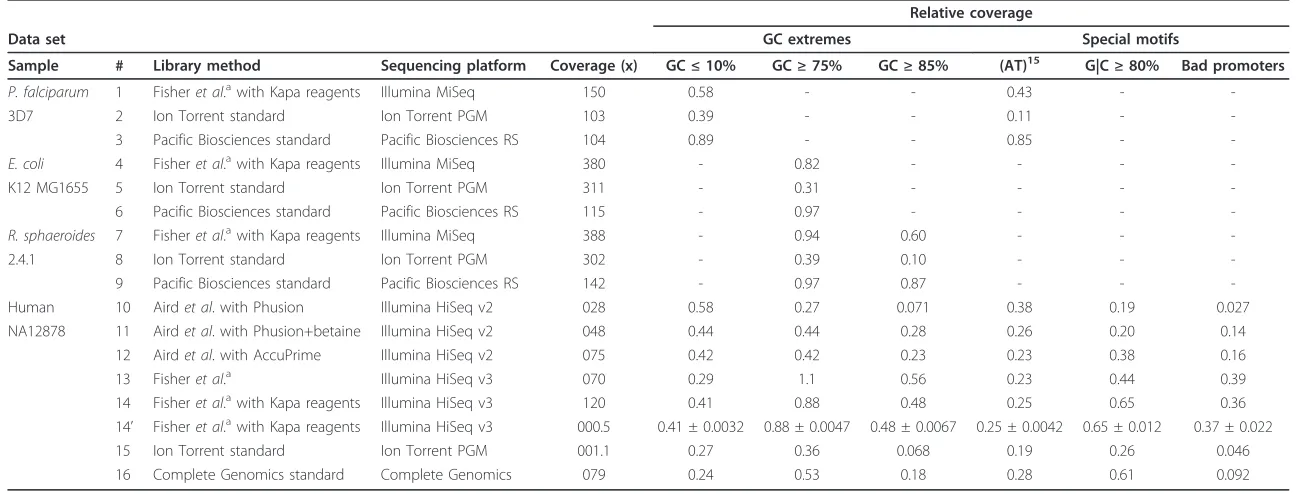
Table 2 Data sets and their relative coverage on bias motifs
Relative coverage
Data set GC extremes Special motifs
Sample # Library method Sequencing platform Coverage (x) GC≤10% GC≥75% GC≥85% (AT)15 G|C≥80% Bad promoters
P. falciparum 1 Fisheret al.awith Kapa reagents Illumina MiSeq 150 0.58 - - 0.43 -
-3D7 2 Ion Torrent standard Ion Torrent PGM 103 0.39 - - 0.11 -
-3 Pacific Biosciences standard Pacific Biosciences RS 104 0.89 - - 0.85 -
-E. coli 4 Fisheret al.awith Kapa reagents Illumina MiSeq 380 - 0.82 - - -
-K12 MG1655 5 Ion Torrent standard Ion Torrent PGM 311 - 0.31 - - -
-6 Pacific Biosciences standard Pacific Biosciences RS 115 - 0.97 - - -
-R. sphaeroides 7 Fisheret al.awith Kapa reagents Illumina MiSeq 388 - 0.94 0.60 - -
-2.4.1 8 Ion Torrent standard Ion Torrent PGM 302 - 0.39 0.10 - -
-9 Pacific Biosciences standard Pacific Biosciences RS 142 - 0.97 0.87 - -
-Human 10 Airdet al. with Phusion Illumina HiSeq v2 028 0.58 0.27 0.071 0.38 0.19 0.027
NA12878 11 Airdet al. with Phusion+betaine Illumina HiSeq v2 048 0.44 0.44 0.28 0.26 0.20 0.14
12 Airdet al. with AccuPrime Illumina HiSeq v2 075 0.42 0.42 0.23 0.23 0.38 0.16
13 Fisheret al.a Illumina HiSeq v3 070 0.29 1.1 0.56 0.23 0.44 0.39
14 Fisheret al.awith Kapa reagents Illumina HiSeq v3 120 0.41 0.88 0.48 0.25 0.65 0.36
14’ Fisheret al.awith Kapa reagents Illumina HiSeq v3 000.5 0.41 ± 0.0032 0.88 ± 0.0047 0.48 ± 0.0067 0.25 ± 0.0042 0.65 ± 0.012 0.37 ± 0.022
15 Ion Torrent standard Ion Torrent PGM 001.1 0.27 0.36 0.068 0.19 0.26 0.046
16 Complete Genomics standard Complete Genomics 079 0.24 0.53 0.18 0.28 0.61 0.092
a
Low-input variation of Fisheret al. [31] (see Materials and methods). Data sets from samples, library construction methods and sequencing platforms are shown, along with their total coverage of the genome, and relative coverage, for each of five bias motifs and a set of‘bad promoters’(see text). Entries are blank if the samples’genome had no instances of the given motif. Data set 14’is the summary of ten random subsamplings from data set 14, with coverage reduced to 0.5×, and we show the mean and standard deviations for the relative coverage measurements from it (see text).
Ross
et
al
.
Genome
Biology
2013,
14
:R51
http://genome
biology.
com/2013/14/
5/R51
Page
6
of
Bias on human samples
The human genome is far larger and more complex than the previously analyzed microbes and contains many examples of all of the motifs, as well as the 1,000 bad promoters (Table 1). We generated slightly more than one-fold coverage on the Ion Torrent PGM platform and 120-fold coverage on Illumina HiSeq. We also analyzed a 79-fold coverage data set generated by Complete Geno-mics. Complete Genomics sequencing, like Illumina and Ion Torrent, uses amplification in its process. We did not analyze the performance of Pacific Biosciences on human samples because, at the time of these experiments, the system’s throughput made it impractical to generate suf-ficient coverage. To maximize comparability and avoid misinterpreting biological variation as sequencing varia-tion, all data sets utilized the well-studied NA12878 sam-ple [32] and were aligned to the Human Genome Assembly 19 (GRCh37) reference.
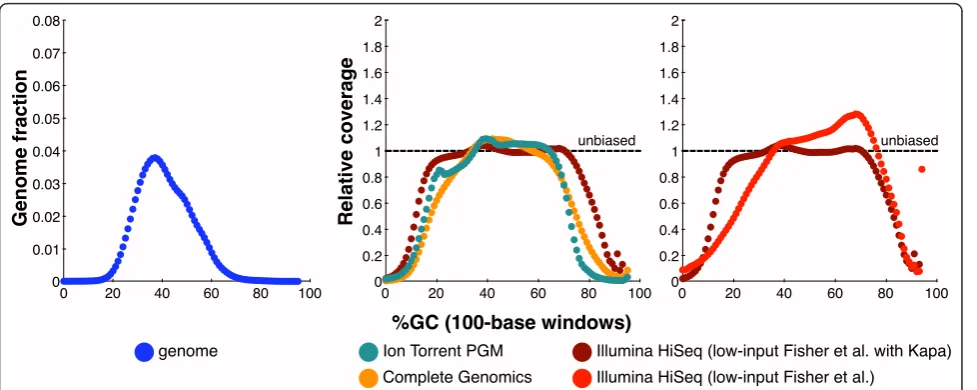
Table 2 and Figure 3 show the motif results and bias curves comparing Illumina HiSeq (data set 14), Ion Tor-rent PGM (data set 15), and Complete Genomics (data set 16) coverage of NA12878. The HiSeq libraries were prepared using the low-input Fisheret al. protocol [31] modified with Kapa Biosystems reagents (see Materials and methods), the other libraries used the manufacturers’ standard protocols (see Materials and methods). We use data set 14 to represent HiSeq performance, rather than the other HiSeq human data sets in Table 2, because it represents our current best Illumina library construction
protocol. Of the data sets tested, the bias curves clearly suggest that the Illumina HiSeq data provided the most even coverage of the human genome. Complete Geno-mics coverage dropped more severely at both GC extremes and only provided 0.092 relative coverage of the bad promoters, compared to 0.36 relative coverage by HiSeq. The Ion Torrent coverage dropped even more quickly than Complete Genomics as GC increased and only provided 0.046 relative coverage of the bad promo-ters. Ion Torrent also had the worst performance of these three data sets on the (AT)15and G|C≥80% motifs.
In Table 2 we can also see how updates to the Illumina HiSeq platform have affected bias. Notably, the HiSeq version 3 data (data sets 13 and 14) show better coverage of high-GC motifs and the bad promoters compared to the HiSeq version 2 data (data sets 10 to 12). We have also compared the standard list of bad promoters, com-puted from HiSeq version 2 data, to a new list comcom-puted from HiSeq version 3 data (see Materials and methods and Additional files 1 and 2 for details). The lists have 47% of their bases in common, which indicates that many bad promoters are still resistant to sequencing despite Illumina’s improvements.
The inter-platform GC-bias comparisons on human and microbial samples presented above are broadly com-patible with previously published work [3,5]. However, we clearly observed more bias between 60% and 70% GC on R. sphaeroidesin Ion Torrent data than on MiSeq
[image:7.595.56.541.104.345.2]data, while Liu et al. [7] found the reverse when
Table 3 Percentage of undercovered microbial genome given 100× coverage
Data set Relative coverage thresholds (% of genome)
Sample # Sequencing platform = 0 ≤0.1 ≤0.25 ≤0.5
P. falciparum3D7 1 Illumina MiSeq 0.010 0.18 3.7 24
2 Ion Torrent PGM 2.6 14 22 33
3 Pacific Riosciences RS 0.012 0.13 0.33 2.7
1+2 Illumina + Ion Torrent 0.0096 1.1 12 30
2+3 Ion Torrent + Pac Bio 0.0062 0.097 1.6 17
3+1 Pac Bio + Illumina 0.0051 0.040 0.33 7.9
E. coliK12 MG1655 4 Illumina MiSeq 0.00022 0.0019 0.019 0.54
5 Ion Torrent PGM 0.00047 0.013 0.046 0.27
6 Pacific Biosciences RS 0 0.00075 0.030 0.36
4+5 Illumina + Ion Torrent 0 0.0012 0.0053 0.075
5+6 Ion Torrent + Pac Bio 0 0.00037 0.0018 0.054
6+4 Pac Bio + Illumina 0 0.00026 0.0012 0.061
R. sphaeroides2.4.1 7 Illumina MiSeq 0.00094 0.045 0.39 2.7
8 Ion Torrent PGM 0.88 19 36 47
9 Pacific Biosciences RS 0.000048 0.0021 0.0071 0.067
7+8 Illumina + Ion Torrent 0.0038 0.23 1.8 19
8+9 Ion Torrent + Pac Bio 0.000024 0.00058 0.14 16
9+7 Pac Bio + Illumina 0.00012 0.0018 0.017 0.49
comparing Ion Torrent to HiSeq. OurR. sphaeroides
results are compatible with the results reported by Ion
Torrent for the high-GCRhodopseudomonas palustris
genome [28].
Comparing bias across libraries
Library construction methods affect evenness of coverage [20-22]. Table 2 includes human Illumina data produced using the methods described in Airdet al. [20] that are illustrative of this, showing a striking improvement at high GC when the PCR enzyme Phusion HF (data set 10) was supplemented by betaine (data set 11) or replaced by AccuPrime Taq HiFi (data set 12). Figure 3 shows a marked flattening of relative coverage between 15% and 70% GC when we replaced some reagents in the low-input Fisheret al. protocol (data set 13) [31] with reagents from Kapa Biosystems (data set 14) (see Materials and methods), although the large improvement at low-GC was partly offset by a small decline in high-GC coverage (Figure 3, Table 2). Oyolaet al.[21] achieved a similar improvement in low-GC coverage ofP. falciparumby uti-lizing Kapa HiFi enzymes and the PCR additive tetra-methylammonium chloride in library construction.
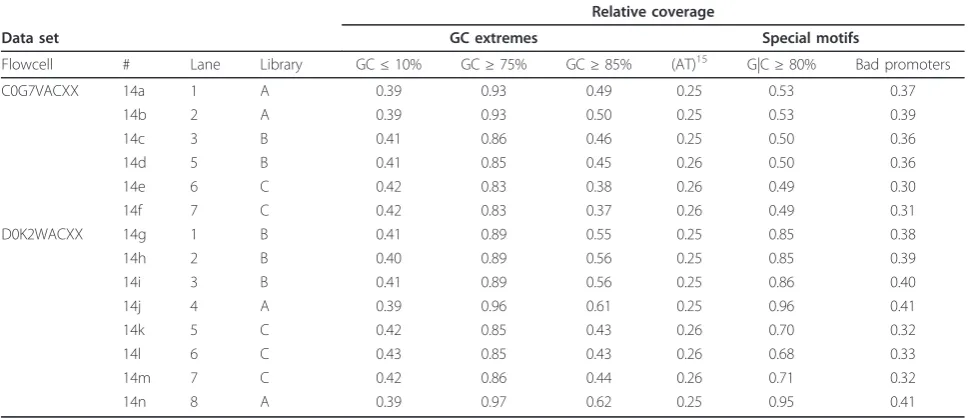
It is also true that there can be variation in bias between ‘technical replicates’, data sets created from the same sam-ple using the same protocols. For examsam-ple, the HiSeq ‘Kapa’human data set (data set 14) was created from three libraries and sequenced in fourteen lanes on two flowcells, with no deliberate variation in protocol at any point. Yet when bias statistics are computed lane-by-lane, one sees
substantial variation in bias between libraries, and between flowcells - although not between lanes from the same library and flowcell (Table 4). Most notable is the between-flowcell variation of the G|C≥80% motif, which is approximately two-fold undercovered in the first flow-cell, but very well covered in the second. Possible sources of unexplained variation include variability of library con-struction instantiations, cluster amplification devices (cBot), flowcells, and HiSeq instruments that were used. Although variations between technical replicates are of interest, they are, for the most part, smaller than those observed between platforms.
It is now possible to create‘PCR-free’Illumina libraries, in which there is no DNA amplification prior to cluster generation and sequencing. A comparison of libraries prepared with our standard Fisheret al. protocol and a PCR-free protocol (Table S1 in Additional file 3) reveals that the PCR-free libraries lead to less bias across all bias motifs onP. falciparum,E. coli, andR. sphaeroides sam-ples. On human samples, PCR-free library construction produced improved coverage of all motifs except for GC
≥75% and G|C≥80%. Additionally, the bad promoters, although improved, were still two-fold undercovered. These results suggest that PCR-free library construction reduces, but does not cure, coverage bias.
Coverage complementarity
Combining the outputs of multiple sequencing technolo-gies might create a composite data set whose overall bias is reduced. Two technologies provide complementary cov-erage if, on the same sample, they tend to fill in each
Genome fraction Relative coverage
%GC (100-base windows)
genome Illumina HiSeq (low-input Fisher et al. with Kapa) Illumina HiSeq (low-input Fisher et al.)
Ion Torrent PGM Complete Genomics
100 0 20 40 60 80 0.08
0 0.01 0.02 0.03 0.04 0.05 0.06 0.07
100 0 20 40 60 80 2
0 0.2 0.4 0.6 0.8 1 1.2 1.4 1.6 1.8
unbiased
100 0 20 40 60 80 2
0 0.2 0.4 0.6 0.8 1 1.2 1.4 1.6 1.8
[image:8.595.57.546.88.283.2]unbiased
Figure 3GC-bias plots for the human genome. Left: the GC composition distribution of the human genome (HG19, GRCh37). Center and right: GC-bias plots for several data sets from human NA12878. Unbiased coverage would be represented by a horizontal line at relative coverage = 1. Center: HiSeq v3 with sample-preparation reagents from Kapa Biosystems (Table 2, data set 14), Ion Torrent PGM (data set 15), and Complete Genomics data (data set 16). Right: HiSeq v3 with sample-preparation reagents from Kapa Biosystems (data set 14, as in center panel) and HiSeq v3 with the standard Fisheret al.[31] reagents (data set 13). Note that Illumina relative coverage exceeded the y-axis above 93% GC content. Relative coverage is only plotted for GC percentages for which there are at least 1,000 100-base windows in the genome.
Rosset al.Genome Biology2013,14:R51 http://genomebiology.com/2013/14/5/R51
other’s low-coverage regions. Complementary technology mixtures should have bias statistics that are better than either one of the components. Precedent for this approach stretches back to the practice of combining data from dye-terminator and dye-primer chemistries in Sanger sequen-cing to reduce error biases [33]. Note that there can be other benefits from mixing technologies, by taking advan-tage of a broader range of complementary properties (and not just bias). For example, for genome assembly there are benefits from combining the long, relatively unbiased but lower accuracy reads from Pacific Biosciences with shorter Illumina reads that provide per-base accuracy [34-36].
To evaluate complementarity, we created mixed-technology microbial data sets for each possible plat-form pairing (MiSeq and Ion Torrent, Ion Torrent and Pacific Biosciences, Pacific Biosciences and MiSeq) using the previously described data sets (data sets 1 to 9). Each pairing consisted of 100-fold total coverage, composed of 50-fold randomly sampled coverage from each component technology. Then we measured the fraction of each gen-ome that fell beneath several relative coverage thresholds, comparing those results to the undercoverage values from 100-fold‘pure’coverage from the component technologies (Table 3). If the coverage biases were complementary, we would expect that the undercoverage fractions from the mixed data sets would be smaller than those measured in the component pure data sets. This did happen in some cases. ForE. coli, using a mixture of Illumina and Ion Torrent data, the two-fold undercovered fraction was 0.075%, compared to 0.54% and 0.27%, respectively, for the two technologies taken separately. Similar improvements occurred forE. coliwith other platform combinations.
However, for the other organisms, for the technologies tested, combining data did not reduce the overall level of bias. In most cases, one technology had much lower bias than the other and mixing tended to result in an intermedi-ate level of bias. Therefore, in these cases, mixing provided no coverage benefit; lower bias could have been achieved by only using data from the lower bias technology.
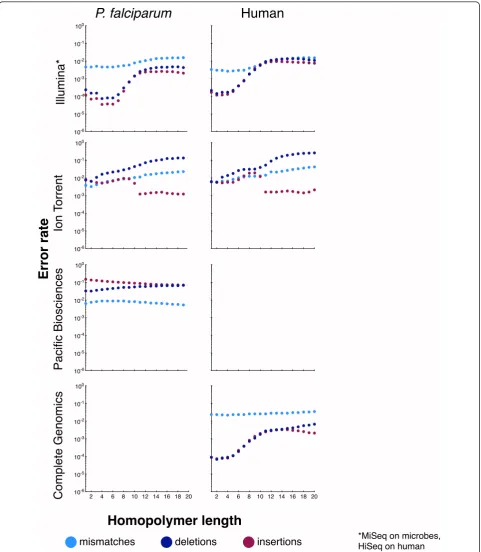
Error biases
While coverage bias is an important sequencing metric, it ignores possible variations in sequence accuracy. For many applications, decreases in accuracy could offset the advantages of better relative coverage in difficult regions. To compare between platforms and assess the influence of sequence context, Figure 4 plots the mismatch, dele-tion, and insertion rates onP. falciparum,R. sphaeroides, and human for the four surveyed technologies, as a func-tion of GC content, whereas Figure 5 plots the same as a function of homopolymer length. A logarithmic scale is used to facilitate comparison between technologies and between error types because rates vary greatly. Table 5 lists the genome-wide error rates for the four platforms. For human, the reported errors includebona fide differ-ences between the NA12878 sample and the reference sequence, and hence the error rates were somewhat inflated. When Illumina NA12878 data (data set 14) were aligned to an NA12878-specific reference [37], the mis-match rate declined by 40%, and the indel rate declined by 80% (Table S2 in Additional file 3). Because of their larger magnitude, a similar experiment yielded no sub-stantial change in the Ion Torrent error rates.
[image:9.595.56.542.101.310.2]Briefly, while the details depend on the technology, these plots document changes in error rates at GC extremes and
Table 4 Per-lane bias statistics for Illumina HiSeq (Kapa) human NA12878
Relative coverage
Data set GC extremes Special motifs
Flowcell # Lane Library GC≤10% GC≥75% GC≥85% (AT)15 G|C≥80% Bad promoters
C0G7VACXX 14a 1 A 0.39 0.93 0.49 0.25 0.53 0.37
14b 2 A 0.39 0.93 0.50 0.25 0.53 0.39
14c 3 B 0.41 0.86 0.46 0.25 0.50 0.36
14d 5 B 0.41 0.85 0.45 0.26 0.50 0.36
14e 6 C 0.42 0.83 0.38 0.26 0.49 0.30
14f 7 C 0.42 0.83 0.37 0.26 0.49 0.31
D0K2WACXX 14g 1 B 0.41 0.89 0.55 0.25 0.85 0.38
14h 2 B 0.40 0.89 0.56 0.25 0.85 0.39
14i 3 B 0.41 0.89 0.56 0.25 0.86 0.40
14j 4 A 0.39 0.96 0.61 0.25 0.96 0.41
14k 5 C 0.42 0.85 0.43 0.26 0.70 0.32
14l 6 C 0.43 0.85 0.43 0.26 0.68 0.33
14m 7 C 0.42 0.86 0.44 0.26 0.71 0.32
14n 8 A 0.39 0.97 0.62 0.25 0.95 0.41
100
0 50
100
10-6
10-5
10-4
10-3
10-2
10-1
100
0 50
100
10-6
10-5
10-4
10-3
10-2
10-1
100
0 50
100
10-6
10-5
10-4
10-3
10-2
10-1
100
0 50
100
10-6
10-5
10-4
10-3
10-2
10-1
100
0 50
100
10-6
10-5
10-4
10-3
10-2
10-1
100
0 50
100
10-6
10-5
10-4
10-3
10-2
10-1
100
0 50
100
10-6
10-5
10-4
10-3
10-2
10-1
100
0 50
100
10-6
10-5
10-4
10-3
10-2
10-1
100
0 50
100
10-6
10-5
10-4
10-3
10-2
10-1
100
0 50
100
10-6
10-5
10-4
10-3
10-2
10-1
Illumina*
P. falciparum
R. sphaeroides
Human
Paci
fi
c Biosciences
%GC (100-base windows)
Error rate
Ion T
orrent
mismatches deletions insertions
Complete Genomics
*MiSeq on microbes, HiSeq on human
100
0 50
100
10-6
10-5
10-4
10-3
10-2
10-1
100
0 50
100
10-6
10-5
10-4
10-3
10-2
[image:10.595.59.539.85.640.2]10-1
Figure 4Error rates as a function of GC composition. Each graph shows mismatch (light blue), deletion (dark blue), and insertion (maroon) rates (y-axis) as a function of GC composition (x-axis). Data are shown for the Ion Torrent PGM from three organisms (P. falciparum,R.
sphaeroides, and human), for the Illumina MiSeq on the two microbes, for the Illumina HiSeq on human, for Pacific Biosciences from the two microbes and from Complete Genomics for human (Table 2, data sets 1 to 3, 7 to 9, and 14 to 16). For human we note thatbona fide differences between the sample and the reference sequence were recorded as errors. Error rates are only plotted for GC percentages for which there are at least 1,000 100-base windows in the genome.
Rosset al.Genome Biology2013,14:R51 http://genomebiology.com/2013/14/5/R51
20 2 4 6 8 10 12 14 16 18 100
10-6 10-5 10-4 10-3 10-2 10-1
20 2 4 6 8 10 12 14 16 18 100
10-6 10-5 10-4 10-3 10-2 10-1 20 2 4 6 8 10 12 14 16 18 100
10-6 10-5 10-4 10-3 10-2 10-1
20 2 4 6 8 10 12 14 16 18 100
10-6 10-5 10-4 10-3 10-2 10-1
20 2 4 6 8 10 12 14 16 18 100
10-6 10-5 10-4 10-3 10-2 10-1
20 2 4 6 8 10 12 14 16 18 100
10-6 10-5 10-4 10-3 10-2 10-1
20 2 4 6 8 10 12 14 16 18 100
10-6 10-5 10-4 10-3 10-2 10-1
Illumina*
P. falciparum
Human
Paci
fi
c Biosciences
Homopolymer length
Error rate
Ion T
orrent
mismatches deletions insertions
Complete Genomics
*MiSeq on microbes, HiSeq on human
20 2 4 6 8 10 12 14 16 18 100
[image:11.595.58.540.88.641.2]10-6 10-5 10-4 10-3 10-2 10-1
on long homopolymers, for every technology. For example, Illumina, which had very low insertion and deletion error rates, had a substantial rise in insertions and deletion rates at both GC extremes. The Ion Torrent insertion and dele-tion rates were more consistent, albeit higher than Illumi-na’s, across a range of GC contents, but the mismatch rate was elevated at low and high-GC regions. As another example, we note that for Pacific Biosciences, the deletion rate rose at high GC, while the insertion rate declined. This behavior appears to result from lower signal-to-noise ratios for the dyes attached to G and C bases in C1 chemis-try (personal communication, Edwin Hauw, Pacific Bios-ciences, USA). Complete Genomics showed consistent (relatively high) mismatch and (relatively low) insertion rates across the GC spectrum, but the deletion rate rose substantially at the extremes. Within long homopolymers, the behavior of insertion and deletion errors would depend on whether a technology systematically over- or under-reports homopolymer length. For example, as homopoly-mer lengths increased, Ion Torrent showed an increased deletion rate, but the insertion rate stayed about the same. In contrast, the insertion and deletion rates of Illumina data increased in longer homopolymers, which is consis-tent with their behavior in GC-extreme regions. In the Illu-mina and Ion Torrent human data, these trends were unchanged when the data were realigned to a sample-spe-cific reference [37] that accounted for known biological variations (Figure S1 in Additional file 4, Figure S2 in Additional file 5). Similarly consistent with GC behavior are the decrease in insertions and increase in deletions observed in Pacific Biosciences data in long homopoly-mers. In general, the sequence-context dependence of error rates varied considerably from technology to technology.
PCR amplification in library construction is a source of error in sequencing data [38-40]. In a matched
comparison, we found that our production libraries had lower error rates than a PCR-free protocol on E. coli
and human samples, and only a slight increase in error rate on R. sphaeroidesand P. falciparum (Table S3 in Additional file 3), possibly due to their extreme base composition.
Discovering uncategorized bias
Finally, with the goal of understanding bias in the human genome that was not explained by our motifs, we generated >100-fold coverage of NA12878 using Illu-mina HiSeq data, from libraries generated with Kapa Biosystems reagents (Table 2, data set 14). We note that some apparently low or missing coverage will be due to true biological differences, including sequences that are present in the reference but not in NA12878. However, we used other deeply sequenced data sets and an assem-bly-based analysis to filter out many of these variant loci, as described below.
Initially we identified 5.5 Mb of the human reference sequence (HG19) having 0.1 or less relative coverage. If the data were unbiased, then 0.1 relative coverage would be more than 9 standard deviations from the expected coverage at each base. Therefore, we would expect no bases in the human genome to have such low coverage in the absence of sequencing bias. We then applied two fil-ters to this‘undercovered set’to remove sequence that is unlikely to be present in the NA12878 genome (see Mate-rials and methods). These filters, one based on analysis of the NA12878 assembly and the other based on a compari-sons between NA12878 and a diverse population of other samples, excluded 8.7% (23 Mb) of the autosomal refer-ence from further consideration. After this filtering, 3.6 Mb of undercovered reference genome remained.
[image:12.595.56.543.101.273.2]Finally, because we were interested in discovering new bias contexts, we excluded regions that were similar
Table 5 Sequencing technology error rates
Data set Fractional error rate
Sample # Platform Mismatches Deletions Insertions Total
P. falciparum 1 Illumina MiSeq 0.0046 0.00021 0.00011 0.0049
2 Ion Torrent PGM 0.0038 0.0090 0.0068 0.020
3 Pacific Biosciences RS 0.0068 0.033 0.14 0.18
E. coli 4 Illumina MiSeq 0.0036 0.0000097 0.0000051 0.0037
5 Ion Torrent PGM 0.0018 0.0053 0.0044 0.012
6 Pacific Biosciences RS 0.0077 0.032 0.17 0.21
R. sphaeroides 7 Illumina MiSeq 0.0030 0.000018 0.0000089 0.0030
8 Ion Torrent PGM 0.0014 0.0055 0.0037 0.011
9 Pacific Biosciences RS 0.0076 0.029 0.16 0.20
Human 14 Illumina HiSeq 0.0030 0.00023 0.00017 0.0034
15 Ion Torrent PGM 0.0060 0.0069 0.0057 0.019
16 Complete Genomics 0.023 0.000099 0.000091 0.024
For a subset of the data sets in Table 2, we show the fractional rates of mismatch, deletion, and insertion, computed relative to coverage, inferred by comparison to the reference sequences. For human we note thatbona fidedifferences between the sample and reference sequence were recorded as errors.
Rosset al.Genome Biology2013,14:R51 http://genomebiology.com/2013/14/5/R51
(but not necessarily identical) to previously known motifs. Similarity was defined by matching at least one of the following motifs:
• GC≤ 13%, 200-base regions in which the middle 100 bases have ≤13% GC content (a superset of the GC≤10% motif);
•GC≥ 70%, 200-base regions in which the middle 100 bases have≥70% GC content (a superset of the GC≥75% and GC≥85% motifs);
•(AT)10, 130-base regions in which the middle 20 bases are repeated AT dinucleotides (a superset of the (AT)15motif);
• G|C≥75%, 130-base regions in which the middle 30 bases are either 75% Gs or 75% Cs (a superset of the G|C≥80% motif);
•the list of 1,000‘bad promoters’.
Except for the bad promoters, which were unaltered, these generalized motifs were selected to each cover roughly twice as many bases as their equivalents in the original motif list. Together they covered 2.8% (74 Mb) of the autosomal bases in HG19. The generalized motifs included 7.5% (1.7 Mb) of the bases previously excluded as probable biological variations. This enrichment may indicate that the biological variation filters excluded bases whose low coverage had a non-biological origin, or it may indicate a correlation between bias motifs and sites with high mutation rates.
Filtering out the probable biological differences between the sample and the reference and the areas similar to known motifs excluded 78% of the ten-fold undercovered locations in HG19. The remaining 35,389 undercovered intervals represented 0.045% (1.2 Mb) of the human auto-somal reference genome with an N50 interval size of 98 bp. Performance on this fraction is hidden from our moni-toring methods by its dissimilarity with the current set of motifs. On the Illumina HiSeq‘Kapa’data set, these bases had mean relative coverage of 0.037. They also suffered from high error rates - a mismatch rate of 0.020 (6.7 times the whole-genome average), a deletion rate of 0.11 (470 times the whole-genome average), and an insertion rate of 0.0021 (12 times the whole-genome average). The high deletion rate suggests that some of the undercoverage may have been due to short biological deletions in NA12878 relative to the reference sequence, but even if all the dele-tions originated in the sample, these regions would still be more than ten-fold undercovered. Their GC-content and homopolymer distributions did not differ appreciably from the overall genome (Figure 6). Clearly, these regions were either exceptionally resistant to the Illumina HiSeq tech-nology or are places where the reference is inaccurate for NA12878 or for human samples generally. A list of the
intervals’coordinates, GC content, and homopolymer N50 statistics are included in Additional file 6.
Conclusions
Sequencing vendors and individual investigators alike strive to improve the quality of their data. This includes increasing read length, yield, overall base quality, and other average measures that reflect the behavior of the technology on‘typical’parts of the genome. However, such measures do not tell us how the technology performs on the‘hardest’parts of the genome, where data quality is lowest, and this is a critical omission. For example, as we have noted, in many human data sets there are large num-bers of transcription start sites and first exons with essen-tially no coverage, and although this bias affects only a tiny fraction of the genome, it is of fundamental impor-tance to the utility of the data.
A goal of our work has been to develop a systematic methodology for assaying coverage bias. We note the following key components of our approach.
Use of multiple microbial samples to assess bias: these samples span diverse sequence contexts and have finished reference sequences, thus facilitating analyses that expose ‘extreme’regions on which performance is subpar. Their genomes are small and thus can be economically sequenced to high coverage.
Bias assessment on the human genome: because of its size and complexity, it spans even more diverse sequence contexts than the microbial samples. Conversely, although we used the highly studied sample NA12878, we note the lack of a truly finished sample-specific reference sequence that would facilitate definitive undercoverage analyses.
Formulation of a menagerie of‘bad’motifs: these encode known trouble spots, including high and low GC but also less well-known motifs, such as ATAT... runs. GC-bias plots effectively encode a whole family of motifs, one for each GC percentage. Motifs, especially on large genomes such as human, can be economically assayed using low-coverage data.
Use of relative coverage as the metric for coverage bias: whether assaying the whole genome or only motifs, relative coverage, as in Tables 2 and 3, simplifies and clarifies bias measurement.
protocols, noted assay variability arising from process fluctuation. We emphasize the ongoing importance of such process monitoring as a prerequisite for meaning-ful inferences about protocol improvements. Our experi-ences lead to the general conclusion that a platform’s sequencing bias is not an immutable property. Although Ion Torrent’s platform generally suffered from the most bias, reagent, protocol, and computational changes may lead to future improvements.
Bias in read accuracy (and not just coverage) is also important. It is well known that some loci on the genome sequence badly. Often this behavior is associated with polymerase slippage. In this work we defined assays, like those for coverage bias, which can be used to track error bias, and evaluated these assays on the same data sets used for coverage bias.
We note that bias is far from the only important metric for sequencing platform evaluation. Users must also eval-uate accuracy, throughput, cost, speed, and many other factors when choosing the appropriate platform for an experiment. Indeed, there is no universal‘best’platform for every purpose.
Taken together, coverage and error bias assays provide a comprehensive view of bias in sequence data. We note several avenues for future work. First, the assays can be used to drive laboratory improvements, with the goal of minimizing bias. Second, the assays can be used to
monitor intentional and unintentional process changes that might affect bias. Third, the assay genomes and our knowledge of them might be improved. In particular, it would be of great value to have an ultra-high-quality reference sequence for an available human sample. Fourth, the motifs might be refined and added to with the goal of creating as comprehensive and informative a list of bias-prone contexts as possible. Collectively these advances could improve data quality, thus increasing the accuracy and contiguity of genome assemblies and mini-mizing the likelihood that biologically important loci will be poorly represented in sequence data.
Materials and methods
Samples and references
P. falciparum3D7 DNA was provided by Daniel Neafsey (Broad Institute) and Sarah Volkman Cooke (Harvard School of Public Health).E. coliK12 and R. sphaeroides
2.4.1 were provided by Louise Williams (Broad Insti-tute). Human DNA samples (listed in the SAMPLE_A-LIAS columns of the relevant spreadsheets in Additional file 7) were obtained from the NIGMS Human Genetic Repository and the NGHRI Sample Repository for Human Genetic Research collections at the Coriell Insti-tute for Medical Research.
The references used for alignment wereE. coliK12 substr. MG1655 (GenBank NC_000913.2),R. sphaeroides
100 0 20 40 60 80
0.04
0 0.005 0.01 0.015 0.02 0.025 0.03 0.035
%GC (100-base windows)
Homopolymer length
Fraction of bases
0
0.1
0.2
0.3
0.4
0.5
0.6
1 2 3 4 5 6 7 8 9 10
[image:14.595.59.537.89.340.2]genome uncharacterized bias
Figure 6GC and homopolymer distributions of uncharacterized Illumina undercoverage of human sample NA12878. The graphs show the distribution of GC-content and homopolymer length for bases in the overall human genome and in the genome intervals that are ten-fold undercovered but which were not explained by known sequence biases or differences between the sample and reference sequence. Data are from Table 2, data set 14.
Rosset al.Genome Biology2013,14:R51 http://genomebiology.com/2013/14/5/R51
2.4.1 with plasmids (GenBank AKVW01000000),P. falci-parum3D7 (GenBank GCA_000002765.1), and Human assembly 19/GRCh37 (GenBank GCA_000001405.1). The NA12878 diploid reference used to generate Table S2 in Additional file 3, Figure S1 in Additional file 4, and Figure S2 in Additional file 5 was created by the Gerstein Lab [37].
Data
The SRA accession numbers for all the Illumina, Ion Torrent, and Pacific Biosciences data used in this work (data sets 1 to 15 and A1 to A11) are provided in Addi-tional file 7. Each spreadsheet in the file corresponds to a data set referenced herein. The Complete Genomics data are publicly available [41].
Illumina HiSeq and MiSeq sequencing
Illumina library construction
Illumina libraries indicated as‘low-input Fisher et al.’ were prepared following the protocol described by Fisheret al.[31] with the following modifications: geno-mic DNA input into shearing was reduced from 3 µg to 100 ng in 50 µl volume. In addition, for adapter ligation, Illumina paired-end adapters were replaced with palin-dromic forked adapters with unique 8-base index sequences embedded within the adapter.
Libraries described as‘low-input Fisheret al. modified with Kapa Biosystems reagents’were made as described above except library construction and PCR reagents were obtained from Kapa Biosystems. DNA fragment end repair, A-base addition, and adapter ligation reactions were performed according to the manufacturer’s recom-mendations (Kapa Biosystems, MA, catalog number KK8201) but utilizing the‘with-bead’SPRI-based clean up method in Fisheret al. Library enrichment with Kapa HiFi enzyme (catalog number KK2102) was performed as fol-lows: the entire unenriched product was enriched in a reaction volume of 60 µl in the presence of 1× Kapa HiFi HF buffer, 0.4 mM each dNTP, 0.8 µM of each enrich-ment primer, and 1 unit of Kapa HiFi enzyme. Kapa HiFi PCR enrichment was performed for 8 cycles with the fol-lowing cycling parameters: 98°C for 45 seconds; 8 cycles of 98°C for 15 seconds, 60°C for 30 seconds, 72°C for 30 sec-onds; 72°C for 1 minute.
Libraries described as‘Airdet al. with Phusion’,‘Aird
et al. with Phusion + betaine’, and‘Airdet al. with Accu-Prime’, were generated as previously described [20].
Libraries described as‘Broad PCR-free’were prepared utilizing the protocol described as‘low-input Fisheret al. modified with Kapa Biosystems reagents’but with several modifications. The PCR-free protocol eliminates all of the amplification steps of the Fisher et al. protocol. Genomic DNA input into shearing was increased from 100 ng to 500 ng in 50 µl volume. Samples were sheared
to an average fragment size of 200 bp instead of 150 bp. For adapter ligation, Illumina TruSeq Adapters (Illumina, CA, catalog FC-121-2001) were used instead of those described in Fisheret al.
For all Illumina PCR-based libraries prepared, the desired insert size was selected by gel electrophoresis with a target of ±10 to 15%. Multiple gel cuts were taken for libraries requiring high sequencing coverage. For the Broad PCR-free method, a second 0.7× SPRI reaction following adapter ligation was utilized instead of gel electrophoresis to tighten up size distribution and reduce excess adapter.
Illumina sequencing
Sequencing libraries were quantified using quantitative PCR (Kapa Biosystems, Woburn, MA, USA), normalized to 2 nM and denatured using 0.1 N NaOH prior to sequencing. Flowcell cluster amplification and sequen-cing were performed according to the manufacturer’s protocols (Illumina, CA, USA) using HiSeq 2000 v2 (data sets 10 to 12, and A2), HiSeq 2000 v3 (data sets 13, 14, A1, and A3), HiSeq 2500 v1 (data sets A10 and A11), MiSeq v1 (data sets 1, 4, and 7), or Miseq v2 (data sets A4 to A9) cluster chemistry and flowcells. HiSeq data were analyzed using Illumina RTA v1.10.15 or RTA v.1.12.4.2. MiSeq data were analyzed using RTA v1.13 or v1.14.23. Read lengths were 2 × 251 bases for MiSeq data sets 1, 4, and 7; 2 × 150 bases for MiSeq data sets A4 to A9; 2 × 101 bases for HiSeq data sets 10 to 14 and A1 to A3; and 2 × 250 bases for HiSeq 2500 data sets A10 to A11. Data were further processed using the Picard data-processing pipeline [42] to generate BAM files. Alignment was performed using BWA ver-sion 0.5.9 [43]. The ‘aln’ command was run with the alignment options‘-q 5 -l 32 -k 2 -o 1’, followed by the ‘sampe’command to generate a paired-end alignment. The Picard MarkDuplicates program was applied after alignment and all duplicate-flagged reads were excluded from the analyses in this manuscript. All human data sets, with the exception of data set 10 to 12, were also processed with the GATK IndelRealigner and TableRe-calibration tools [44,45], but none of the results pre-sented in this work depend on precise indel placement or on quality scores.
Ion torrent sequencing
Libraries for Ion Torrent sequencing were created using the Ion Xpress™ Plus Fragment Library Kit, according to the Ion Xpress™ Plus gDNA Fragment Library Pre-paration protocol (version 5, Ion Torrent, Guilford, CT, USA).
Workflow parameters consisted of 100 ng DNA start-ing input material each of P. falciparum, E. coli,
sheared to a size range of 100 to 1,000 bp using the fol-lowing parameters: temperature, 6 to 8°C; duty cycle, 20% for P. falciparum and human, 1% for E. coli and
R. sphaeroides; intensity, 5; cycles per burst, 200; time, 130 seconds for P. falciparumand human, 550 seconds for E. coli and R. sphaeroides; shearing tubes, Micro-Tubes crimpcap (Covaris, Woburn, MA, USA), using a Covaris E210 instrument. Size selection of the unampli-fied libraries was done with the Pippin Prep™ Instru-ment (SAGE Science, Beverly, MA, USA). The libraries were amplified following the protocol specifications for samples starting with 100 ng input. Final libraries were quantified and checked for size on an Agilent Bioanaly-zer using the High Sensitivity DNA Kit (Agilent Tech-nologies, Santa Clara, CA, USA).
Template preparation was conducted using the Ion
PGM™200 Xpress™ Template Kit, following the Ion
PGM™200 Xpress™Template Kit protocol (version 3; Ion Torrent). Recovery of the Ion Spheres (ISPs) was done according to the Ion Sphere Particles 200 recovery proto-col. Quality of the templated ISPs was assessed using the Guava easyCyte HT8 Cytometer (EMD Millipore, Billerica, MA, USA).
Sequencing of the samples was conducted according to the Ion PGM™200 Sequencing Kit Protocol (version 6; Ion Torrent). One or more 318 sequencing chips were loaded and run on an Ion Torrent PGM (Ion Torrent) for each sample. Each run was programmed to include 520 nucleotide flows to deliver 200-base reads, on average. Base calling and alignment were performed using the Tor-rent Suite 3.0 software (Ion TorTor-rent).
Because the default TMAP aligner [46] cannot align to references with more than 4.3 billion bases, it was neces-sary to use the BWA-SW aligner [47] to realign the Ion data to the diploid NA12878 reference for the error-rate comparison presented in Table S2 in Additional file 3, Figure S1 in Additional file 4, and Figure S2 in Additional file 5. To ensure that the comparison was only affected by the choice of reference, we also used BWA-SW to realign the Ion data to Human assembly 19 (GRCh 37) for those comparisons. The alignment was done using version 0.6.2 of the aligner with default parameters and the‘-M’ option to generate only one primary alignment per read (the analysis ignores secondary alignments).
Pacific Biosciences sequencing
Pacific Biosciences sequencing libraries were generated following the manufacturer’s recommendations using the DNA Template Prep Kit Version 1 chemistry (Pacific Biosciences, Menlo Park, CA, USA) with the following modifications. For each sample, between 7 and 12 µg of genomic DNA was sheared to approximately 2 kb in size using a Covaris S instrument with the following para-meters: temperature, 6 to 8°C; duty cycle, 20%; intensity,
0.1; cycles per burst, 1,000; time, 15 cycles × 60 seconds; shearing tubes, MiniTUBE-Clear (Covaris). DNA frag-ments were purified, end-repaired, and ligated with SMRTbell sequencing adapters following the manufac-turer’s recommendations (Pacific Biosciences) with the exception that the individual AMPure clean-up steps were purified three times rather than the recommended two. SMRTbell sequencing libraries were combined with sequencing primer and polymerase following the manufac-turer’s recommendations (Pacific Biosciences). The result-ing complex was subjected to Pacific Biosciences sequencing, followed by primary data analysis (version 1.1.1 chemistry and analysis software) on the Pacific Bios-ciences RS instrument following the manufacturer’s recommendations. Secondary analyses, including read fil-tering, were performed by SMRT Analysis versions 1.3.1 (E. coli and P. falciparum) or 1.3.0 (R. sphaeroides). Because Pacific Bioscience’s BLASR aligner does not cur-rently support random placement of ambiguously aligned reads, alignment was performed using the BWA-SW long-read aligner [47] version 0.6.2 with parameters‘-b5 -q2 -r1 -z20 -M -w200’. BWA-SW parameters were based on the software’s suggested defaults for Pacific Biosciences reads, adding the‘-z20’parameter for greater accuracy (validated in [48]), the‘-M’parameter to generate only one primary alignment per read (the analysis ignores secondary align-ments), and‘-w200’to encourage the aligner to generate only one alignment per read. The aligner input files were the‘filtered_subreads.fastq’files produced by the standard resequencing protocol.
Complete Genomics data
All statistics were computed on BAM files provided by Complete Genomics. Complete Genomics’pipeline [49] first maps all reads that can be aligned to the reference with very few errors and then uses local assembly, con-strained by read-pairing information, to accumulate evi-dence of variation from the remaining reads. Unlike the standard Complete Genomics BAM representations, these BAM files represent both the aligned and locally assembled reads, containing a single record for every read representing its highest-scoring alignment to the reference, using padded alignment to represent the rela-tionships produced by the local assembler (personal com-munication, Srinka Ghosh, Complete Genomics). In cases where multiple equally good alignments/assemblies existed for a particular read pair, the file contains one chosen at random, similar to the policies of the aligners used on the other technologies. For the purpose of mea-suring coverage, this representation is superior to the BAMs produced by Complete Genomics’publicly avail-able tools because it unifies the alignment and assembly data and presents a single‘best’alignment/assembly for each read pair.
Rosset al.Genome Biology2013,14:R51 http://genomebiology.com/2013/14/5/R51
Selecting genomic regions
For microbial organisms, reads were aligned to the com-plete reference sequences, but only chromosomal con-tigs were considered in the bias calculations. For human data, reads were aligned to the complete reference sequence, but only autosomal contigs were considered in bias calculations. Plasmid, mitochondrial, and sex chromosomes were not included because they are not expected to be equimolar with the rest of the genome. Regions of the references containing ambiguous bases were also excluded from all bias computations as there is no way to accurately map reads to them or to assess their membership in motifs.
Defining the bad promoters
The list of‘bad promoters’was identified based on data from 39 individuals sequenced on Illumina HiSeq v2 for the 1000 Genomes Project (198-fold total coverage, data set A2). To obtain the list, for each transcription-start site in the RefSeq database [50], the ratio of average coverage in the surrounding 200 bases to average coverage in the surrounding 3,000 bases was computed. Then the 1,000 sites with the lowest ratios were designated as‘bad promo-ters’and are listed in Additional file 1. If the database con-tained multiple entries for the same gene, the entry with the lowest coverage ratio was kept for the list. For compar-ison purposes, we used the same algorithm on a HiSeq v3 1000 Genomes data set (A3, 253-fold coverage of 71 indi-viduals) to generate Additional file 2.
Computing coverage and counting errors from alignments
All alignments were represented in the common SAM format (or its compressed, binary representation, BAM) [51]. In the SAM specification, the mapping between a read and a reference location is described by what is termed a‘CIGAR’string of operators. A read base that is aligned to a particular reference base is affiliated with the M, =, or × operators, as only those bases contribute to ‘coverage’at a genome location.
For purposes of tracking error biases, we determined the number of CIGAR M, =, or X-mapped read bases where the read nucleotide differed from the reference nucleotide, and counted these as mismatches at the reference position. Similarly, deletions at a reference base were counted by incrementing a counter every time the CIGAR D operator is used to skip that base. Insertion errors are more proble-matic because these bases exist in the read but have no reference position. Some convention is necessary, so if an alignment contained an insertion of length L, denoted by ‘LI’in the CIGAR string, we charged L insertions to the reference base immediately after the inserted sequence. For consistency, all error rates reported in the paper are computed relative to coverage levels: that is, error rates
are fractions in which the numerator is the error count in a region or motif and the denominator is the number of mapped bases.
It is important to note that some details of the results may be sensitive to aligner algorithms and parameters. For example, a read whose best alignment has many errors may be left unmapped with one set of parameters, poten-tially contributing to coverage bias, or mapped with alter-native parameters, potentially contributing to error bias. Similarly, parameters often determine whether a particular base is categorized as a mismatch, insertion, or deletion. As much as possible, we have addressed these issues by using aligners and parameters for each technology that have been validated as producing useful alignments for other applications. In our experience, the statistics we have presented are robust to reasonable substitutions of aligners and parameters.
Filtering NA12878 data for the discovery of uncharacterized bias
The following filters were used to exclude regions for which low coverage of sample NA12878 were likely due to biological variation between the sample and the human reference.
We took the previously published NA12878 assembly, produced from a different set of Illumina data [52], and aligned its contigs to the HG19 reference. For each instance in which a contig in the NA12878 assembly con-tained a gap relative to the reference, we excluded the gap sequence from the undercovered set. Contigs from the ALLPATHS-LG assembly of NA12878 were aligned to the human reference hg19 with BWA-SW version 0.5.9 [38] using default arguments. Contigs longer than 100 kb were split before alignment so as to stay within the aligner’s maximum read length. The splitting algorithm ensures that the resulting subsequences are no shorter than 50 kb. When BWA-SW detects large deletions in the contig-reads relative to the reference, it splits the alignments, treating the contigs as chimeric reads. Additionally, we scanned all the aligned contigs and marked any sliding 100-base windows that exhibited more than five alignment errors (mismatches, deleted bases, or inserted bases) as areas that may have high local rates of polymorphism. These regions are excluded from consideration because reads that cover them may fail to align to the reference, which would reduce apparent coverage even in the absence of sequencing bias.