comment
reviews
reports
deposited research
interactions
information
refereed research
Research
Within the fold: assessing differential expression measures and
reproducibility in microarray assays
Ivana V Yang*, Emily Chen*, Jeremy P Hasseman*, Wei Liang*,
Bryan C Frank*, Shuibang Wang*, Vasily Sharov*, Alexander I Saeed*,
Joseph White*, Jerry Li*, Norman H Lee*, Timothy J Yeatman
†
and
John Quackenbush*
Addresses: *The Institute for Genomic Research, 9712 Medical Center Drive, Rockville, MD 20850, USA. †H. Lee Moffitt Cancer Center, 12902 Magnolia Drive, Tampa, FL 33612, USA.
Correspondence: John Quackenbush. E-mail: [email protected]
Abstract
Background:‘Fold-change’ cutoffs have been widely used in microarray assays to identify genes that are differentially expressed between query and reference samples. More accurate measures of differential expression and effective data-normalization strategies are required to identify high-confidence sets of genes with biologically meaningful changes in transcription. Further, the analysis of a large number of expression profiles is facilitated by a common reference sample, the construction of which must be carefully addressed.
Results:We carried out a series of ‘self-self’ hybridizations in which aliquots of the same RNA sample were labeled separately with Cy3 and Cy5 fluorescent dyes and co-hybridized to the same microarray. From this, we can analyze the intensity-dependent behavior of microarray data, define a statistically significant measure of differential expression that exploits the structure of the fluorescent signals, and measure the inherent reproducibility of the technique. We also devised a simple procedure for identifying and eliminating low-quality data for replicates within and between slides. We examine the properties required of a universal reference RNA sample and show how pooling a small number of samples with a diverse representation of expressed genes can outperform more complex mixtures as a reference sample.
Conclusion:Analysis of cell-line samples can identify systematic structure in measured gene-expression levels. A general procedure for analyzing cDNA microarray data is proposed and validated. We show that pooled reference samples should be based not only on the expression of individual genes in each cell line but also on the expression levels of genes within cell lines. Published: 24 October 2002
GenomeBiology2002, 3(11):research0062.1–0062.12
The electronic version of this article is the complete one and can be found online at http://genomebiology.com/2002/3/11/research/0062 © 2002 Yang et al., licensee BioMed Central Ltd
(Print ISSN 1465-6906; Online ISSN 1465-6914)
Received: 22 May 2002 Revised: 28 August 2002 Accepted: 19 September 2002
Background
DNA microarray analysis has become the most widely used technique for the study of gene-expression patterns on a
comes from identification of informative patterns of gene expression across multiple experiments. Achieving both these objectives is facilitated by using a common reference sample that provides a baseline expression measure for each gene, enabling normalization and comparison of indepen-dent experiments.
Pooled RNA derived from cell lines is a commonly used ref-erence sample. To provide optimal coverage of genes spotted on the array, reference samples are often constructed from a large number of cell lines from a variety of tissues. One example is the universal human RNA reference commer-cially available from Stratagene [3]. This reference consists of equimolar quantities of RNA from ten human cancer cell lines representing ten different tissues (B cells, breast, brain, cervix, liver, lipocytes, macrophage, skin, T cells and testis). Another challenging technical consideration in microarray analysis is the cutoff value used to distinguish differential expression from natural variability in the data. A cutoff of twofold up- or down-regulation has been chosen to define differential expression in most published studies [1,2]. However, little has been done to evaluate the accuracy of the technique and assess the confidence levels for various fold-level changes in expression ratios. In addition, microarray analysis is a complex, multistep technique involving array fabrication, labeling, hybridization and data analysis, and many laboratories have developed a variety of protocols for each of these steps [4,5]. Studies by a number of groups using a range of protocols and including many different RNA samples will give a better picture of how reliable microarrays are for elucidating gene-expression profiles.
In this study, we evaluate the performance of cDNA microar-rays using our current laboratory and data-analysis proto-cols and derive a new intensity-dependent approach to identifying differentially expressed genes. RNA from 19 dif-ferent human cancer cell lines, the Stratagene universal ref-erence RNA, and RNA isolated from a tumor specimen were assayed in a series of ‘self-self’ hybridizations on a 19,200-element cDNA array (containing 9,600 19,200-elements spotted in duplicate). Statistical analysis of the ratios of Cy5/Cy3 fluo-rescence intensities among this large number of distinct samples provides insight into the variation inherent in expression ratios extracted from cDNA microarrays. We assess reproducibility of array experiments by analyzing replicates, using both clones spotted in duplicate on the same array and in triplicate hybridization assays. In addi-tion, we use the methodology developed in this study to compare expression in a colon and an ovarian cell line to identify tissue-specific genes.
Self-self hybridization results for individual cell lines were also analyzed to determine the composition of an optimal reference pool consisting of RNA derived from cell lines. Our underlying hypothesis was that pooling a large number of
cell lines might not necessarily improve the overall gene rep-resentation. Although some cell lines express significantly more genes than others, not all cell lines express all genes at the same levels. Consequently, mixing cell lines may dilute rare transcripts so that their representation in the final RNA pool is below the detectable limit. Results of our analysis will aid in the future assessment of gene-expression patterns and the design of reference RNA samples.
Results and discussion
Cell line self-self hybridizationsTo evaluate the natural variability present in spotted cDNA microarray data across a number of distinct RNA samples, we carried out a set of self-self assays in which aliquots of the same RNA are separately labeled with Cy3 and Cy5 dyes and co-hybridized to a single microarray. Poly(A)+RNA was
pre-pared from 19 human carcinoma cell lines (2 brain, 5 colon, 10 ovarian, 1 pancreatic, and 1 testicular) and Stratagene’s universal human reference RNA. RNA was reverse tran-scribed into cDNA using random hexamer primers in the presence of 5-aminoallyl-dUTP; Cy3 and Cy5 dyes were covalently coupled to the incorporated aminoallyl linkers in a subsequent labeling reaction.
For each cell line, Cy3- and Cy5-cDNA samples were co-hybridized to a spotted microarray containing 19,200 human cDNA clones (9,600 clones printed in duplicate). Hybridization results were analyzed to determine relative expression levels for each printed element, and hybridiza-tion intensity data were first normalized globally using an iterative mean-log2(ratio)-centering approach. Briefly,
log2(ratio) values were calculated for each array element and the mean of the distribution was calculated. Ratios were adjusted such that the mean log2(ratio) for the entire
collec-tion of genes was set to zero(or a corresponding average ratio of 1). As outliers can significantly influence this process, these were identified and excluded and the process repeated until convergence. This process results in an average Cy5/Cy3 log2(ratio) of zero for the spots analyzed in each microarray.
We and others have noted that the log2(ratio) values often have a systematic dependence on intensity most often observed as a deviation from zero for low-intensity spots. Locally weighted linear regression (lowess) [6] has been pro-posed as a normalization method for microarray assays [7,8] that can remove intensity-dependent dye-specific effects in the log2(ratio) values.
comment
reviews
reports
deposited research
interactions
information
[image:3.609.58.552.79.678.2]refereed research
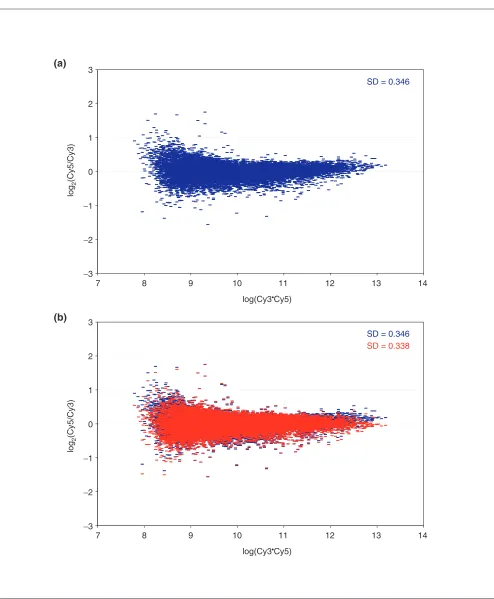
Figure 1 (continues on the next page)
Self-self hybridization of the KM12L4A cell line. (a)R-I (ratio-intensity) plot for a self-self hybridization of the KM12L4A cell line before lowess correction. (b)The same dataset, showing the effect of lowess correction (red) relative to the uncorrected data (blue). Lowess removes the intensity-dependent curvature that is evident in the uncorrected data and in the process, reduces the SD in the dataset. (c)Similar plots for all 30 self-self hybridizations performed in this study, including the SD for the dataset before (blue) and after (red) the application of the lowess correction.
SD = 0.346
SD = 0.338
SD = 0.346
7 8 9 10
log(Cy3•Cy5)
log
2
(Cy5
/Cy3)
log
2
(Cy5
/Cy3)
12
11 13 14
7 8 9 10
log(Cy3•Cy5)
12
11 13 14
3
2
1
0
−1
−2
−3 3
2
1
0
−1
−2
−3
(a)
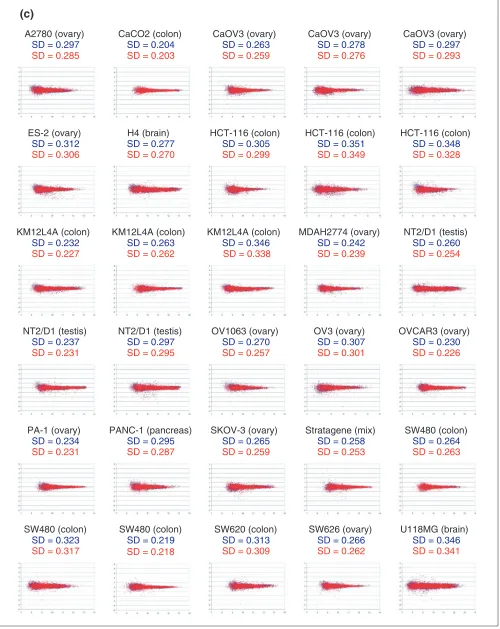
Figure 1(continued from the previous page)
A2780 (ovary)
SD = 0.297 SD = 0.285
CaCO2 (colon)
SD = 0.204 SD = 0.203
CaOV3 (ovary)
SD = 0.263 SD = 0.259
CaOV3 (ovary)
SD = 0.278 SD = 0.276
CaOV3 (ovary)
SD = 0.297 SD = 0.293
ES-2 (ovary)
SD = 0.312 SD = 0.306
H4 (brain)
SD = 0.277 SD = 0.270
HCT-116 (colon)
SD = 0.305 SD = 0.299
HCT-116 (colon)
SD = 0.351 SD = 0.349
HCT-116 (colon)
SD = 0.348 SD = 0.328
KM12L4A (colon)
SD = 0.232 SD = 0.227
KM12L4A (colon)
SD = 0.263 SD = 0.262
KM12L4A (colon)
SD = 0.346 SD = 0.338
MDAH2774 (ovary)
SD = 0.242 SD = 0.239
NT2/D1 (testis)
SD = 0.260 SD = 0.254
NT2/D1 (testis)
SD = 0.237 SD = 0.231
NT2/D1 (testis)
SD = 0.297 SD = 0.295
OV1063 (ovary)
SD = 0.270 SD = 0.257
OV3 (ovary)
SD = 0.307 SD = 0.301
OVCAR3 (ovary)
SD = 0.230 SD = 0.226
PA-1 (ovary)
SD = 0.234 SD = 0.231
PANC-1 (pancreas)
SD = 0.295 SD = 0.287
SKOV-3 (ovary)
SD = 0.265 SD = 0.259
Stratagene (mix)
SD = 0.258 SD = 0.253
SW480 (colon)
SD = 0.264 SD = 0.263
SW480 (colon)
SD = 0.323 SD = 0.317
SW480 (colon)
SD = 0.219 SD = 0.218
SW620 (colon)
SD = 0.313 SD = 0.309
SW626 (ovary)
SD = 0.266 SD = 0.262
U118MG (brain)
for weakly fluorescing arrayed elements. For a self-self hybridization of the type analyzed here, one expects a mean log2(Cy5/Cy3) ratio of zero for each element in the array independent of intensity. Lowess enables deviations from this expected behavior to be detected and corrected by per-forming a local weighted linear regression for each data point in the R-I plot and subtracting the average ratio from the experimentally observed ratio. A representative R-I plot for the cell line KM12L4A in Figure 1 shows a slight upward curve of the log2(ratio) for low-intensity data points (shown
[image:5.609.55.299.85.262.2]in blue) which is removed after application of the lowess correction, producing a balanced distribution of expression ratios around zero independent of intensity (shown in red). Similar plots, including a calculated standard deviation (SD) both before and after lowess correction, are shown in Figure 1c. The most important feature of the data is the narrow distribution of ratios in individual array ments regardless of the RNA sample assayed in each experi-ment. This is also true of the entire dataset, as can be seen in the histogram of combined expression ratios from 30 experiments, shown in Figure 2.
These results are comparable to those obtained in a recent study of 30 self-self hybridizations on 10,000-element cDNA arrays [9]. Yue et al. [9] created histograms for three sets of data, each consisting of 10 independent array experiments, using mRNA derived from human placenta, brain and heart tissue. In one of their data sets, a 2-SD limit of 1.25-fold was observed; combined, 99.5% of the data points were within ± 1.4-fold. A small number of dis-tinct samples (3) in combination with a large number of replicates per sample (10) most probably accounts for the slightly tighter distribution of expression ratios than that observed in our study.
The second important aspect of our dataset is the number of ‘outliers’; approximately 5% of the data points in each array fall outside of 2 SD from the mean (data not shown). While this is not unexpected, it suggests that the distribu-tion of log2(ratio) values does not deviate badly from normal. This is of a particular significance because it should enable detection of genes with low levels of differ-ential expression at high confidence in future studies. Combining all data from all 30 hybridizations, the 2-SD limit is equivalent to 1.46-fold change (± 0.546 log2(ratio)), only 18,221 out of 332,601 points, or 5.5% of the expres-sion ratios, fall outside a 2-SD threshold. Consequently, if differential expression is defined as greater than 2 SD from the mean, genes with fold changes greater than 1.5 can be classified as up- or down-regulated at approximately 95% confidence level.
comment
reviews
reports
deposited research
interactions
information
refereed research
Figure 2
A combined histogram of the log2(expression ratio) measured for all array elements across all 30 hybridizations used in this study both before (blue) and after (red) application of lowess correction.
log2(Cy5/Cy3)
SD = 0.28 SD = 0.27
−3
−2.8−2.6−2.4−2.2−2−1.8−1.6−1.4−1.2−1−0.8−0.6−0.4−0.2 00.2 0.4 0.6 0.8 11.2 1.4 1.6 1.8 22.2 2.4 2.6 2.8 3 70,000
Frequency
60,000
50,000
40,000
30,000
20,000
10,000
0
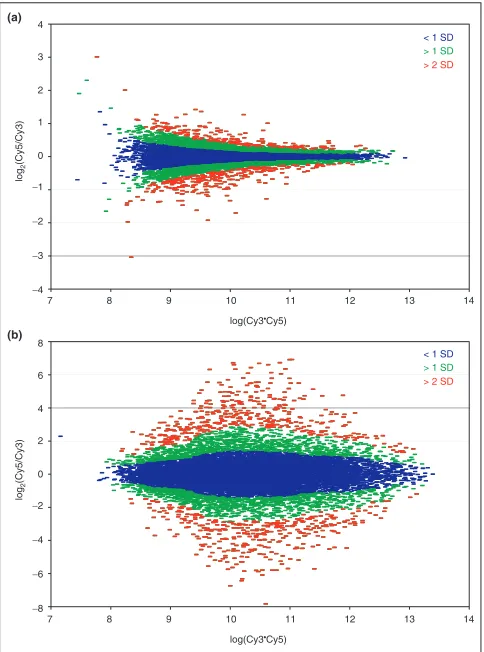
Figure 3
Intensity-dependent calculations of SDs described in the text show distinct patterns that depend on how closely related are the samples being compared. (a)The ‘tadpole’ pattern seen in the self-self hybridization of RNA samples from the KM12L4A cell line is characteristic of RNA samples derived from similar sources are compared. (b)RNA samples from very different samples show a characteristic ‘eye’ pattern, with greater diversity of expression for genes expressed at intermediate levels, as seen in this co-hybridization of a Cy5-labeled PA-1 (ovary) with a Cy3-labeled CaCO2 (colon) RNA sample.
< 1 SD
> 1 SD
> 2 SD
< 1 SD
> 1 SD
> 2 SD
log
2
(Cy5
/Cy3)
7 8 9 10
log(Cy3•Cy5) 12
11 13 14
8
6
4
2
0
−8
−6
−4
−2
log
2
(Cy5
/Cy3)
7 8 9 10
log(Cy3•Cy5) 12
11 13 14
4
3
2
1
0
−4
−3
−2
−1
(a)
[image:5.609.314.556.306.632.2]Good-quality array data can only be generated using well devel-oped and extensively tested laboratory and data-analysis proto-cols. Our group has been working continuously to improve our laboratory procedures and implement new data-analysis methods. One of the changes recently adopted by ours and many other laboratories is indirect cDNA labeling. As first-strand cDNA synthesis is identical for both samples, incorpora-tion of nucleotides with an aminoallyl linker followed by the covalent coupling reaction to Cy dyes reduces bias for incorpo-ration of one dye over the other by the reverse transcriptase. Slight dye-specific effects are present in normalized low-inten-sity data, probably caused by a wavelength-dependent differen-tial response of the photomultiplier tubes in the array scanners or slight differences or nonlinearities in the quantum efficien-cies of the fluorescent dyes, but these can be efficiently removed by the application of the lowess correction.
Tissue sample self-self hybridization
In our experience, hybridization using RNA derived from tissue samples is generally more problematic than that
derived from cell lines. To determine whether data of com-parable quality can be generated with tissue RNA, we carried out a similar expression analysis using RNA derived from a colon tumor liver metastasis. Twenty micrograms of total RNA that have been extracted using Trizol and subjected to secondary purification using Qiagen RNeasy columns were labeled with both Cy3 and Cy5 and examined in a self-self co-hybridization assay. The distribution of expression ratios is in excellent agreement with cell-line data; only 507 out of 11,743 (4.3%) of identified spots fall outside the 1.42-fold change, 2-SD limit.
Intensity-dependent estimation of differential expression
While lowess normalization greatly reduces dye-specific arti-facts that often appear for low-intensity data points, the data exhibit additional structure that can be used to evaluate pat-terns of gene expression. As can be seen in Figure 1a, the log2(ratio) measures generally show greater variation at
lower intensities. Most published microarray studies use a single log2(ratio) threshold as a measure of differential expression. Examination of the distribution in Figure 1 sug-gests that this may inappropriately identify genes at intensi-ties where the natural variation in the data would not support their selection, while at the same time causing genes to be missed in other intensities where the data suggest that much lower log2(ratio) values are statistically significant.
Several mathematical models have been derived to explain this phenomenon [10-14]. One [10] discusses the use of a smoothed estimate of the SD as a function of the fluores-cence intensity. The study conducted by Hughes et al. [11] shows how their model for estimating intensity-dependent differential expression can be used to identify biologically meaningful differential regulation at levels lower than twofold in a compendium of 300 different Saccharomyces cerevisiaemutants and chemical treatments.
[image:6.609.55.298.342.643.2]We developed a much simpler approach to identify differen-tially expressed genes using an intensity-dependent calculation of a standard Z-score. Using a sliding window of fixed width in log10(Cy5*Cy3), the local mean and SD was calculated for each gene using the data in the normalized R-I plot. Figure 3a depicts the result of such a calculation for the cell line KM12L4A, with data less than 1 SD shown blue, between 1SD and 2SD in green, and greater than 2 SD in red, respec-tively; genes greater than 2 SD from the local mean (Z> 2) are identified as being significantly differentially expressed. The shape of the R-I plot and the Z-score distributions are characteristic of the samples being compared in the microarray assay under consideration. For closely related samples, such as RNA from a cell line and the same line perturbed with a stressor, the R-I distribution has a ‘tadpole’ shape similar to that shown for our self-self hybridization, although typically with a slightly broader distribution in the log2(ratio) than that shown in Figure 3a. When two very different samples or Figure 4
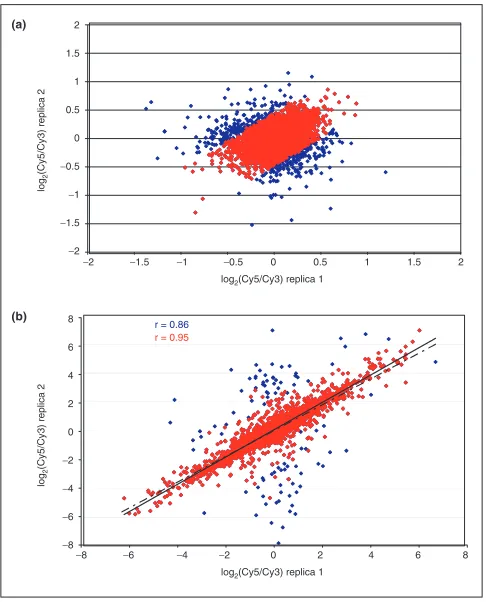
Replicate filtering within an array can reduce variability in the data. Scatterplots showing correlation coefficients (r) for the logarithms of the Cy5/Cy3 ratios for duplicate spots within arrays for (a) a self-self hybridization of RNA samples from the CaOV3 cell line and (b)a co-hybridization of a Cy5-labeled PA-1 with a Cy3-labeled CaCO2 RNA sample. In both cases, data before replicate filtering (blue) includes a number of outliers that are eliminated from the filtered data (red), resulting in a much better correlation between duplicate measurements
r = 0.86 r = 0.95 2
1.5
1
0.5
0
−0.5
−1
−1.5
−2
8
6
4
2
0
−2
−4
−6
−8
−2 −1.5 −1 −0.5 0 log2(Cy5/Cy3) replica 1
log
2
(Cy5/Cy3) replica 2
log
2
(Cy5/Cy3) replica 2
0.5 1 1.5 2
−8 −6 −4 −2 0 log2(Cy5/Cy3) replica 1
2 4 6 8
(a)
comment
reviews
reports
deposited research
interactions
information
[image:7.609.57.557.84.683.2]refereed research
Figure 5
Replicate filtering between slides can also significantly improve data quality. Scatterplots showing correlation coefficients (r) for the logarithms of the Cy5/Cy3 ratios for duplicate spots within arrays for three arrays used to analyze independently labeled sets of (a)CaOV3 RNA samples (self-self hybridizations) and (b)PA-1 (Cy5) and CaCO2 (Cy3) RNA samples.
CaOV3
(a)
(b)
PA-1 vs CaCO2log2(Cy5/Cy3) array 1
log2(Cy5/Cy3) array 1
r = 0.84
r = 0.96
r = 0.82
r = 0.93
r = 0.83
r = 0.94 2
1.5
1
0.5
0
−3 −2 −1 0 1 2 3 −8 −6 −4 −2 0 2 4 6 8
−0.5
−1
−1.5
−2
8
6
4
2
0
−2
−4
−6
−8
log2(Cy5/Cy3) array 2
log2(Cy5/Cy3) array 2
2
1.5
1
0.5
0
−3 −2 −1 0 1 2 3 −8 −6 −4 −2 0 2 4 6 8
−0.5
−1
−1.5
−2
8
6
4
2
0
−2
−4
−6
−8
log2(Cy5/Cy3) array 1
log2(Cy5/Cy3) array 1
2
1.5
1
0.5
0
−3 −2 −1 0 1 2 3 −8 −6 −4 −2 0 2 4 6 8
−0.5
−1
−1.5
−2
8
6
4
2
0
−2
−4
−6
−8
log
2
(Cy5/C3) arr
a
y 2
log
2
(Cy5/C3) arr
a
y 2
log
2
((Cy5/C3) arr
a
y 3
log
2
((Cy5/C3) arr
a
y 3
log
2
((Cy5/C3) arr
a
y 3
log
2
((Cy5/C3) arr
a
tissues are compared, however, the distribution generally has a characteristic ‘eye’ shape, with the greatest spread coming at intermediate expression levels. Figure 3b shows the results from a hybridization comparing the CaCO2 (colon) and PA-1 (ovary) cell lines.
Analysis of replicates
Expression data for clones spotted in duplicate were exam-ined to assess reproducibility within each array. Plots of the log2-transformed ratios of the Cy5 and Cy3 intensities for the two replicates were generated for this purpose. As can be seen in the representative plot in Figure 4a (blue), log2(Cy5/Cy3) values form a ‘sphere’ centered around zero with the majority of data points lying between - 0.5 and + 0.5 on both axes. However, a small number of outliers is present and probably represent situations where one or both of the replica spots are of poor quality. Similar plots were obtained for the other 29 self-self hybridization assays (data not shown).
Because one cannot determine a prioriwhich of the dupli-cates is in error, irreproducible elements should be removed before any further analysis, unless many more replicates are analyzed. The idea of outlier filtering was also incorporated into the model for the intensity-dependence of expression ratios introduced by Baggerly et al. [10]; we developed a simple approach to flag and eliminate questionable repli-cates. Ideally, Cy5/Cy3 ratios should be the same for the two replicas and log2(r1/r2) (where r1and r2are Cy5/Cy3 ratios for the two replicas) should be equal to zero; replicates where this condition is not satisfied probably contain one or more bad elements. Consequently, we sought to filter out genes whose log2(r1/r2) deviates greatly from this expected value of zero. We calculated the mean and SD of this log2(r1/r2) for each pair of replicas in the entire array, and
eliminated pairs of elements whose log2(r1/r2) is greater than 2 SD from the mean. In Figure 4a, 6.3% of data points were eliminated using this outlier criterion (red), resulting in a much tighter dataset.
We also examined duplicate clone filtering in a hybridization assay of two different samples, CaCO2 and PA-1 (Figure 4b). In the case of differential expression, the correlation of the replica ratios is expected to be linear. The correlation increases from r = 0.86 (blue; dashed line) to r = 0.95 (red; solid line) after 1.7% of outliers are filtered out using the method outlined above. The substantial increase in the cor-relation coefficient suggests that our filtering procedure effi-ciently removes elements with at least one unreliable log2(Cy5/Cy3) value.
A similar approach can be used to identify questionable replicate spots on separate slides. To show this, five cell lines (CaOV3, HCT-116, KM12L4A, NT2/D1, and SW480) were selected and assayed in triplicate. In addition, expression in CaCO2 and PA-1 was compared in triplicate hybridizations.
RNA from the same isolation was used for replicate hybridizations, thus allowing us to concentrate on technical and not biological replication and to explore more thor-oughly the systematic errors that can arise. Replicate slides were subject to filtering in pairs (arrays 1 and 2; 2 and 3; 1 and 3) using a process analogous to that applied to within-slide replicates; representative data are shown in Figure 5. Correlations of log2(Cy5/Cy3) values for the three pairs of
arrays before (blue; dashed line) and after (red; solid line) filtering for the CaOV3 cell line self-self hybridizations are shown in Figure 5a. The same set of plots for differential expression assays of CaCO2 and PA-1 cell lines including linear fits to the data is shown in Figure 5b.
Triplicate hybridization assays enable us to assess variability among independent labeling reactions and hybridizations. As can be seen in Figure 5a, there is some variation in correla-tions for each pair of hybridization replicas (arrays 1 and 2, as well as 2 and 3, show better correlation than do arrays 1 and 3). When averaged over three pairs of replicas, however, the variability between arrays is comparable to within-array vari-ation. Similar results were obtained for the remaining four cell lines (data not shown). For the case of hybridizations of two different samples (Figure 5b), the mean r values increase significantly from 0.83 (blue; dashed lines) to 0.94 (red; solid lines) after outliers in each pair of hybridizations are filtered out. These correlations are, as in the case of self-self hybridizations, similar to those seen for within-array replicas. Our analysis suggests that replication is essential for ensur-ing data quality, whether spottensur-ing replicate clones on sensur-ingle arrays or performing multiple independent hybridization assays. Further, the replicate filtering process we describe here is a simple approach that can eliminate questionable array elements and provide higher-confidence expression measurements.
Identification of differentially expressed genes
To show how the concepts presented in this study can be applied to detect differentially regulated genes, we sought to identify sets of genes that are over- and under-expressed in ovary relative to colon by analyzing hybridization assays of CaCO2 (colon) and PA-1 (ovary) cell lines. The CaCO2 sample was labeled with Cy3 and the PA-1 sample was labeled with Cy5; genes that are expressed in colon at much higher levels will, therefore, have negative log-ratios and ovary genes will have positive log-ratios.
Intensity-dependent estimation of differential expression section. Array elements with ratios outside the 2-SD limit were defined as differentially regulated; 510, 543 and 523 were identified in each individual assay. Finally, the intersec-tion of differentially expressed genes on all three arrays was taken; this resulted in a list of 324 array elements (225 genes, as some are within-array replicates), of which 157 (109 genes) have higher expression in colon and 167 (116 genes) are more highly expressed in the ovary relative to colon.
A list of differentially expressed genes with mean log2(Cy5/Cy3) values and SD calculated over three experi-ments is available online (see Additional data files). The small SDs illustrate the reproducibility of measurements made using the methods described here and show their ability to provide a high-confidence list of differentially expressed genes and their expression ratios.
In an attempt to validate the differential expression we observed in this assay, we compared our results to the expression patterns derived from EST libraries generated
from 18 colon and 12 ovarian sources (including normal tissue, cancer tissue, and cell lines) using the digital differen-tial display (DDD) available at the National Center for Biotechnology Information (NCBI) [15] (see Additional data files). Although these data sets are not completely comple-mentary, we identified one gene that is significantly upregu-lated in the colon relative to ovary (PLAB, coding for prostate differentiation factor; Hs.296638; THC888554), and one gene that is overexpressed in the ovary relative to colon (24-dehydrocholesterol reductase; DHCR24; Hs.75616; THC932478) in both microarray and DDD data. We also identified three gene families significantly differentially expressed in both datasets. We found genes in the solute carrier families 34 (Hs.84700; DDD), 22 (THC960422; microarray) and 16 (THC863879; microarray), as well as laminin A5 (Hs.11669; DDD) and A4 (THC933239; microar-ray) to be more abundant in the ovary. In addition, serologi-cally defined colon cancer antigens 28 (Hs.84700; DDD) and 33 (THC899239; microarray) were more highly represented in colon. However, we also found two discrepancies in rela-tive abundances of one gene and one gene family between the
comment
reviews
reports
deposited research
interactions
information
[image:9.609.55.555.355.662.2]refereed research
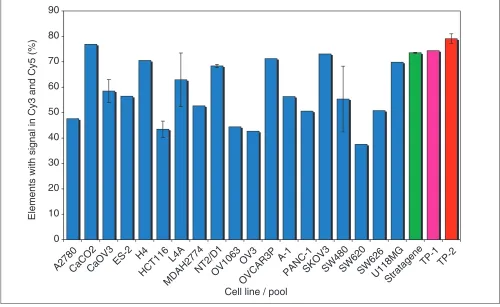
Figure 6
An ideal reference RNA sample will provide detectable hybridization above background for as broad as possible representation of the arrayed genes. The histogram shows the percentage of array elements with detectable signals in both the Cy3 and Cy5 channels for a series of self-self hybridizations representing all of the primary cell lines used in this study, the Stratagene universal reference RNA, and RNA pools created on the basis of our analysis. TP-1 consists of equal amounts of CaCO2 (colon), KM12L4A (colon), and OVCAR3 (ovary) cell lines. TP-2 consists of equal amounts of CaCO2 (colon), KM12L4A (colon), and U118MG (brain) cell lines. Mean values with 1 SD as the error bars are plotted for the samples that were assayed more than once. CaOV3, HCT-116, KM12L4A, NT2/D1, and SW480 cell lines were assayed in triplicate, and Stratagene and TP-1 pools were hybridized in duplicate.
A2780CaCO2CaOV3ES-2
H4
HCT116 L4A
MDAH2774
NT2/D1OV1063OV3
OVCAR3P A-1
PANC-1SKOV3SW480SW620SW626U118MG
Stratagene
TP-1 TP-2
Cell line / pool
Elements with signal in Cy3 and Cy5 (%)
DDD and microarray data. DDD data indicate that the protein-kinase inhibitor P58 (Hs.177574; THC906738) is more abundant in the ovary but the same gene appears to be more highly represented in the colon in our microarray study. Similarly, insulin-like growth factor binding protein 3 (Hs.77326; DDD) is upregulated in the ovary relative to colon while the opposite is true for insulin-like growth factor binding protein 6 (THC1022140; microarray).
To further validate our findings, we performed quantitative real-time reverse transcription PCR (RT-PCR) assays on 25 genes with log10(R*G) and log2(R/G) values encompassing the entire range present in the microarray data. Expression ratios obtained by quantitative RT-PCR (see Additional data files), are in good agreement with the ratios obtained using microarrays. This concordance is especially significant for genes with low expression ratios and for transcripts expressed at low copy number, confirming the validity of our approach for obtaining a high-confidence list of differen-tially expressed genes. RT-PCR data also showed that the P58 protein-kinase inhibitor (Hs.177574; THC906738) is upregulated in the colon relative to ovary, which supports our array results and suggests that the discrepancy between microarrays and DDD is not due to technical limitations of microarray assays but reflects a true biological difference between the cell lines we compared and tissues used in DDD.
Reference pool selection
Comparison of query samples to a common reference sample is among the most widely used experimental designs for large-scale microarray studies [16,17]. Refer-ence samples often consist of pools of RNA molecules derived from cell lines because cell lines provide a renew-able source of large quantities of RNA. Each cell line expresses a distinct assortment of RNA species, so any par-ticular cell line will provide measurable, baseline hybridiza-tion for only a subset of the genes on an array. Consequently, cell line RNA reference pools are typically constructed from a large number (10 or more) of cell lines derived from a variety of primary tissues. The idea underly-ing such a design is that by combinunderly-ing RNAs from diverse cell lines, one might obtain a more complete representation of the genes spotted on the array.
This approach, however, does not take into account the expression levels of individual genes in each cell line. While genes expressed at high levels will give detectable signal even when diluted by a factor of 10, many of the more rare transcripts may get diluted to below the detection limit. Therefore, we hypothesized that comparable or better repre-sentation of spotted genes might be obtained using fewer cell lines, each expressing a large number of diverse genes. To test this hypothesis, we constructed two reference pools, TP-1 and TP-2, using a naive gene-counting approach designed to include three cell lines with the greatest representation of unique genes that are also easy to grow and yield high
quantities of RNA. TP-1 consists of colon cell lines CaCO2 and KM12L4A as well as the ovarian cell line OVCAR3; OVCAR3 is replaced with the U118MG (brain) cell line in TP-2.
The results of our analysis are summarized in Figure 6, which shows a histogram representing the percentage of array elements with signals in both Cy3 and Cy5 channels in self-self hybridizations. The performance of TP-1 is compa-rable to that of the Stratagene pool (approximately 75%), despite a large difference in the number of cell lines in each pool. This supports our hypothesis that adding more cell lines to the pool may not necessarily improve the overall gene representation because some genes are diluted below the detection limit.
Including cell lines from very dissimilar tissues may, however, give a better representation of the genes on the array. TP-2 contains a brain instead of an ovarian cell line and covers close to 80% of the spotted sequences. This improved performance relative to TP-1 is likely to be due both to the fact that brain exhibits the greatest diversity of tran-scripts (on the basis of based EST and serial analysis of gene expression, SAGE, analysis), and that the subset of genes expressed in brain is more disjoint with the genes observed in colon than in ovary. This illustrates that a simple pool of RNA from diverse cell lines can provide a superior reference.
Conclusion
the importance of replicates in generating high-quality expression data.
Pooled reference samples should be designed on the basis not only of representation of individual genes in each cell line but also of expression levels of genes within the cell lines. Adding more cell lines to the pool does not necessarily improve overall gene representation because rare transcripts become undetectable when diluted in a pool of a large number of cell lines.
Overall, the data presented herein, derived from a large number of RNA samples from cell lines and tissue, suggest that the laboratory and data analysis protocols we describe should allow for a more accurate and reproducible identifi-cation of differentially expressed genes than does the selec-tion of an arbitrary, global fold-change threshold chosen independent of any measure of the natural variability in the data. We propose a model for analysis of cDNA microar-ray data consisting of three steps: lowess-normalization of individual arrays, followed by replica filtering to remove questionable elements, and finally estimation of the local Z -score for identification of differentially regulated genes.
Materials and methods
Array fabricationcDNA clones were obtained from the Research Genetics sequence-verified human cDNA collection. Clone inserts were PCR-amplified directly from culture and purified according to a previously published protocol [5,18]. PCR from plasmid miniprep DNA was carried out for microtiter plates that had fewer than 85% single-band PCR products when amplified from culture. The overall success rate for single-band amplification was 88%. Clones were printed in duplicate from 50% DMSO onto SuperAmine slides (Telechem International) as described previously and cross-linked at 90 mJ using a Stratalinker (Stratagene).
RNA extraction
Cells were grown in a tissue culture incubator (37°C, 5% CO2) in RPMI 1640 or DMEM medium (Life Technologies) supplemented with 10% fetal bovine serum, 200g/ml streptomycin and 200 U/ml penicillin. RNA was extracted with Trizol (Life Technologies) according to the manufactur-er’s protocol and stored at -80°C. mRNA selection from 100g total RNA using oligo-d(T)25Dynabeads (Dynal) and following the manufacturer’s directions yielded 2-3g poly(A)+-enriched RNA in 20 l 10 mM Tris-HCl, pH 7.5.
Agilent 2100 Bioanalyzer mRNA assays were carried out on 1-l aliquots and ribosomal contamination was estimated to vary between 0 and 25%. The rest of the mRNA sample was used to prepare fluorescently labeled cDNA probes.
RNA from a colon tumor liver metastasis was extracted with Trizol (Life Technologies) and further purified on
RNeasy columns (Qiagen) using the protocol supplied by the manufacturers. For each labeling reaction, 20 g total RNA were used.
Probe preparation
First-strand cDNA synthesis was primed with 4g of random nonamers (New England Biolabs) or 6g random hexamers (Life Technologies) by heating at 70°C for 10 minutes, snap-cooling in dry ice/ethanol for 30 sec, and incubating at room temperature for an additional 5-10 min. Reverse transcription was performed in the presence of 500M each of dATP, dCTP, and dGTP, 200 M 5-aminoal-lyl-dUTP (Sigma), 300M dTTP, 1x first-strand buffer, 10 mM dithiothreitol, and 400 U Superscript II (Life Tech-nologies) in 40-l reactions at 42°C for 3 h to overnight. Reactions were quenched by the addition of 10l of 0.5 M EDTA and RNA template was hydrolyzed by the addition of 10 l of 1 M NaOH followed by heating at 70°C for 10 min. Reactions were neutralized with 10l of 1 M HCl, and cDNA was purified on QIAquick columns (Qiagen) according to the manufacturer’s directions but substituting phosphate wash buffer (5 mM potassium phosphate pH 8.0, 80% ethanol) for buffer PE, and phosphate elution buffer (4 mM potas-sium phosphate pH 8.5) for buffer EB.
cDNA was lyophilized to dryness and resuspended in 4.5l of 0.1 M sodium carbonate pH 9.0 buffer. NHS ester (4.5l) of Cy3 or Cy5 dye (Amersham Pharmacia) in DMSO (dye from one tube was dissolved in 72 l of DMSO) were added and reactions were incubated at room temperature in the dark for 1 h. Coupling reactions were quenched by the addi-tion of 41l of 0.1 M sodium acetate pH 5.2, and unincorpo-rated dye was removed using QIAquick columns. Labeling efficiency was determined by analyzing the whole undiluted sample in a spectrophotometer using a 50-L MicroCuvette (Beckman). Total incorporated Cy dye ranged from 300-600 pmol and the ratio of unlabeled to labeled nucleotides was typically between 25 and 50.
Hybridization and image processing
Slides were prehybridized in 1.0% BSA, 5x SSC, 0.1% SDS for 45 min, washed by repeated dipping in MilliQ water twice and 2-propanol once, and air dried. Fluorescent cDNA probes were lyophilized to dryness and resuspended in 12l hybridization buffer (50% formamide, 5x SSC, 0.1% SDS). To combined Cy3 and Cy5 samples were added 20g Cot1 DNA and 20g poly(A)+DNA and samples were denatured
at 95°C for 5 min, followed by snap cooling on ice for 1 min. Room-temperature probes were applied to a prehybridized array, covered with a glass coverslip (Fisher), and placed in a humidified hybridization chamber (Corning). Hybridizations were carried out at 42°C for 16-20 h, followed by washing in (5 min each): 1x SSC and 0.2% SDS at 42°C once, 0.1x SSC and 0.2% SDS at room temperature once, and 0.1x SSC at room temperature twice. Arrays were scanned using a GenePix 4000 dual-color confocal laser scanner (Axon).
comment
reviews
reports
deposited research
interactions
information
Data were collected in Cy3 and Cy5 channels and stored as paired TIFF images.
Data analysis
Spots were identified and local background subtracted in the TIGR_Spotfinder software [19]. In the first step, a grid con-sisting of square cells is drawn around each array element. Spot segmentation is then performed using a histogram seg-mentation method that uses the distribution of pixel intensi-ties to separate probable signal from background and a binary thresholding approach to identify spots, followed by a procedure to exclude disconnected features. Raw intensity for each element is obtained by first excluding saturated pixels and then summing all remaining pixel intensities inside the spot contour. The area outside the spot contour but inside the cell is used to calculate local background. Background per pixel is estimated as a median of the pixels in this area and is multiplied by the spot area to give an estimated spot back-ground value. In the final step, this integrated backback-ground value is subtracted from the raw integrated spot intensity to produce the background-subtracted integrated intensities we use for further analysis. Furthermore, a quality control (QC) filter is used to remove questionable array features. Two cri-teria for spot rejection are a spot shape that deviates greatly from a circle and low signal-to-noise ratio. Spots for which the ratio of area to circumference deviates by more than 20% from the value for an ideal circle and spots containing fewer than 50% of pixels above the median background value are flagged and eliminated from further consideration. This approach has proved extremely robust to misidentification of the spot boundaries, and expression measures have shown it to be both reproducible and verifiable. The output data from Spotfinder is available as additional data files with the online version of this paper.
Lowess normalization was implemented using a native Java implementation in TIGR MIDAS (Microarray Data Analysis System), freely available through [19] and based on the LOCFIT package developed by Bell Labs [20]. For all nor-malization, the smoothing parameter was set to 33%. All additional data files and protocols used in this study are available from [21].
Quantitative real-time RT-PCR
Quantitative RT-PCR assays were performed on the ABI Prism 7900HT sequence-detection system using the Taqman Reverse Transcription Kit (Applied Biosystems) and QuantiTech SYBRGreen PCR Kit (Qiagen) using a two-step reaction with protocols supplied by manufacturers. Primers were designed in the Primer 3 Old Version [22] using default parameters with minor modifications (product size range 100-150; optimum Tm60; minimum Tm58; maximum Tm61; maximum 3ⴕcomplementarity 1). Following the initial RT, 1l of the resulting reaction product amplified by PCR in a 20l reaction volume with 200 nM final primer concentra-tion. Data were normalized to 18S ribosomal RNA Ambion
QuantumRNA 18S Internal Standards Kit; the 18S primers and competimers were in a 3:7 ratio with the primers at 200 nM final concentration.
Additional data files
Spotfinder data files (tab-delimited text files) and tables (Word files) showing (1) Differentially expressed genes in PA-1 and CaCO2 cell lines, and (2) genes differentially expressed in colon and ovary as determined using digital dif-ferential display to analyze sequence abundance in EST libraries deposited in dbEST, are available with the online version of this paper.
Acknowledgements
We wish to thank Y. Wang, H. Kim, K.-Y. Kwong, M. I. Klapa, and H. Wang for helpful discussions and comments on the manuscript and J. Tsai and T. Currier for bioinformatics support for the microarray work The authors also wish to thank M. Heaney and S. Lo for database support, and V. Sapiro, B. Lee, J. Shao, C. Irwin, J. Neubrech, R. Karamchedu, M. Senga-malay and E. Arnold for computer system support. This project was sup-ported by grants from the US National Cancer Institute, the National Heart, Lung, and Blood Institute, and the National Science Foundation.
References
1. Schena M, Shalon D, Davis RW, Brown PO: Quantitative moni-toring of gene expression patterns with a complementary DNA microarray.Science 1995, 270:467-470.
2. Schena M, Shalon D, Heller R, Chai A, Brown PO, Davis RW: Paral-lel human genome analysis: microarray-based expression monitoring of 1000 genes. Proc Natl Acad Sci USA 1996,
93:10614-10619.
3. Stratagene [http://www.stratagene.com]
4. Eisen MB, Brown PO: DNA arrays for analysis of gene expres-sion.Methods Enzymol 1999, 303:179-205.
5. Hegde P, Qi R, Abernaty K, Gay C, Dharap S, Gaspard R, Hughes J, Snesrud E, Lee N, Quackenbush J: A concise guide to cDNA microarray analysis.Biotechniques 2000, 29:552-562.
6. Cleveland W, Devlin S: Locally weighted linear regression: an approach to regression analysis by local fitting.J Am Stat Assoc
1988, 83:596-609.
7. Yang YH, Dudoit S, Luu P, Lin DM, Peng V, Ngai J, Speed TP: Nor-malization for cDNA microarray data: a robust composite method addressing single and multiple slide systematic vari-ation.Nucleic Acids Res 2002, 30:e15.
8. Dudoit S, Yang YH, Callow M, Speed T: Statistical methods for identifying differentially expressed genes in replicated cDNA microarray experiments. Statistica Sinica 2002, 12: 111-139.
9. Yue H, Eastman P, Wang B, Minor J, Doctolero M, Nuttall R, Stack R, Becker J, Montgomery J, Vainer M, Johnston R: An evaluation of the performance of cDNA microarrays for detecting changes in global mRNA expression. Nucleic Acids Res. 2001,
29:e41.
10. Baggerly KA, Coombes KR, Hess KR, Stivers DN, Abruzzo LV, Zhang W: Identifying differentially expressed genes in cDNA microarray experiments.J Comput Biol 2001, 8:639-659. 11. Hughes TR, Marton MJ, Jones AR, Roberts CJ, Stoughton R, Armour
CD, Bennett HA, Coffey E, Dai H, He YD, et al.: Functional dis-covery via a compendium of expression profiles. Cell 2000,
102:109-126.
12. Ideker T, Thorsson V, Siegel AF, Hood LE: Testing for differen-tially-expressed genes by maximum-likelihood analysis of microarray data.J Comput Biol 2000, 7:805-817.
13. Newton MA, Kendziorski CM, Richmond CS, Blattner FR, Tsui KW:
14. Rocke DM, Durbin B: A model for measurement error for gene expression arrays.J Comput Biol 2001, 8:557-569.
15. National Center for Biotechnology Information: Digital Dif-ferential Display
[http://www.ncbi.nlm.nih.gov/UniGene/info_ddd.shtml]
16. Perou CM, Sorlie T, Eisen MB, van de Rijn M, Jeffrey SS, Rees CA, Pollack JR, Ross DT, Johnsen H, Akslen LA, et al.: Molecular por-traits of human breast tumours.Nature 2000, 406:747-752. 17. Garber ME, Troyanskaya OG, Schluens K, Petersen S, Thaesler Z,
Pacyna-Gengelbach M, van de Rijn M, Rosen GD, Perou CM, Whyte RI, et al.: Diversity of gene expression in adenocarcinoma of the lung. Proc Natl Acad Sci USA 2001, 98:13784-13789.
18. Gaspard R, Dharap S, Malek J, Qi R, Quackenbush J: Optimized growth conditions for direct amplification of cDNA clone inserts from culture.Biotechniques 2001, 31:35-36.
19. The Institute for Genomic Research: software tools
[http://www.tigr.org/software]
20. LOCFIT: local regression and likelihood [http://cm.bell-labs.com/cm/ms/departments/sia/project/locfit/index.html]
21. The Institute for Genomic Research: cancer pages
[http://cancer.tigr.org] 22. Primer 3
[http://www-genome.wi.mit.edu/cgi-bin/primer/primer3.cgi#PRIMER_ SELF_ANY]
comment
reviews
reports
deposited research
interactions
information