M E T H O D
Open Access
SWAN: Subset-quantile Within Array
Normalization for Illumina Infinium
HumanMethylation450 BeadChips
Jovana Maksimovic, Lavinia Gordon and Alicia Oshlack
*Abstract
DNA methylation is the most widely studied epigenetic mark and is known to be essential to normal development and frequently disrupted in disease. The Illumina HumanMethylation450 BeadChip assays the methylation status of CpGs at 485,577 sites across the genome. Here we present Subset-quantile Within Array Normalization (SWAN), a new method that substantially improves the results from this platform by reducing technical variation within and between arrays. SWAN is available in theminfiBioconductor package.
Background
DNA methylation, which is the addition of a methyl group to the cytosine of a CpG dinucleotide, is one of the most widely studied epigenetic modifications in human development and disease. Changes in DNA methylation are vital for normal development and differ-entiation [1], whilst aberrant methylation is involved in diseases such as diabetes, schizophrenia, multiple sclero-sis and cancer [2-4]. As interest in epigenetics, and par-ticularly DNA methylation, has increased, analysis methods have had to evolve in scale and resolution. Currently, several microarray and next-generation sequencing technologies are available that allow the interrogation of DNA methylation on a genome-wide scale [5-14]. Each of these approaches has inherent strengths and weaknesses, which have been compared and discussed in several recent reviews [15-18]. As sequencing-based DNA methylation assays become more affordable, it is anticipated that they will be more widely used in this arena; at present, however, they are still too costly for most studies, particularly those that involve large numbers of samples. Consequently, methy-lation arrays are a popular alternative for high-through-put DNA methylation analyses.
DNA methylation profiling using Illumina’s Infinium technology was first utilized on the Infinium
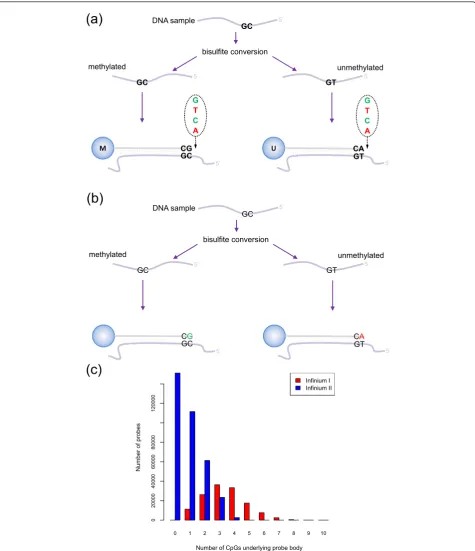
HumanMethylation27 (27k) BeadChip [12,19]. More recently, the genomic coverage of the array was dramati-cally increased, leading to the production of the Infi-nium HumanMethylation450 (450k) BeadChip, which interrogates the methylation status of 485,577 CpGs in the human genome. The Infinium assay detects methy-lation status with single base resolution, without the need for methylated DNA capture, thereby avoiding capture-associated biases. The 50 bp Infinium methyla-tion probes query a [C/T] polymorphism created by bisulfite conversion of unmethylated cytosines in the genome. However, the Infinium 450k methylation plat-form is unique in that it uses a combination of two dis-tinct probe types, Infinium I and II (Figure 1a,b).
The Infinium I design, which was previously employed on the 27k arrays, uses fluorescence from two different probes, unmethylated (converted) and methylated (unconverted), to assess the level of methylation of a target CpG. If a target CpG was methylated in the sam-ple, the DNA fragment will remain unconverted after bisulfite treatment and will therefore bind to the com-plementary‘methylated’probe, which terminates at the 3’end with a cytosine. If the target CpG was unmethy-lated, however, binding will occur to the complementary
‘unmethylated’ probe, which terminates at the 3’end with a thymine. Binding at either probe is followed by single base extension that results in the addition of a fluorescently labeled nucleotide (Figure 1a). It is assumed that the methylation status of CpGs underlying the 50 bp probe body is correlated to that of the target * Correspondence: [email protected]
Murdoch Childrens Research Institute, 50 Flemington Road, Parkville 3052, Australia
! " # $ % & '
(
!
#
$
&
!
[image:2.595.61.537.88.640.2])) )))
CpG such that CpGs in the probe body of an unmethy-lated (converted) probe are also converted, while CpGs in the body of a methylated (unconverted) probe will remain unconverted. By contrast, the Infinium II design uses only a single probe per target CpG, which incorpo-rates a‘degenerate’R-base at any underlying CpG sites in the probe body. The 3’end of each Infinium II probe is complementary to the base directly upstream of the
‘C’ of the target CpG. Methylation state is detected by single base extension at the position of the ‘C’ of the target CpG, which always results in the addition of a labeled ‘G’ or ‘A’nucleotide, complementary to either the‘methylated’C or‘unmethylated’T, respectively (Fig-ure 1b).
The Infinium II design is the preferred probe design for the 450k chip. Bibikovaet al. [20] demonstrated that the Infinium II probes could have up to three CpG sites underlying their 50 bp probe body without affecting data quality. However, hybridization kinetics and specifi-city were often compromised in regions of higher CpG density and therefore Infinium I probes are still used to expand the number of CpG sites that can be assayed. Consequently, many of the Infinium I probes contain three or more underlying CpGs, whilst most Infinium II probes have less than three underlying CpGs (Figure 1c).
Technical differences between the Infinium I and Infi-nium II probe types have been observed. Bibikovaet al. [20] noted a difference in the bvalue distributions they produced, where b is defined as the proportion of the total signal coming from the methylated channel. Speci-fically, they noticed a compression in thebvalue distri-bution of Infinium II probes compared to Infinium I. Similarly, Dedeurwaerder et al. [21] reported that the b values obtained from the Infinium II probes displayed a narrower range than those obtained from Infinium I probes and suggested that Infinium II probes are less sensitive for the detection of extreme methylation values due to the two-color detection method used. They sug-gested a simple scaling of b values for Infinium II probes and reported improved results in terms of valida-tion against bisulfite pyrosequencing data, but also noted potential difficulties in applying this procedure to cancer samples.
Here we present a novel method to normalize between Infinium probe types on the 450k platform. This method derives from normalization methods that have been hugely successful for microarray expression plat-forms [22-24]. Specifically, we introduce a Subset-quan-tile Within Array Normalization (SWAN) method that allows the Infinium I and II probes within a single array to be normalized together. We show that this method substantially reduces the differences in bvalue distribu-tion observed between Infinium I and II probes. We
also demonstrate that this method improves correlation between technical replicates, whilst increasing the num-ber of significantly differentially methylated probes that are detected. SWAN is written in the R programming language and is available in the minfipackage [25] from Bioconductor.
Results
Subset-quantile Within Array Normalization
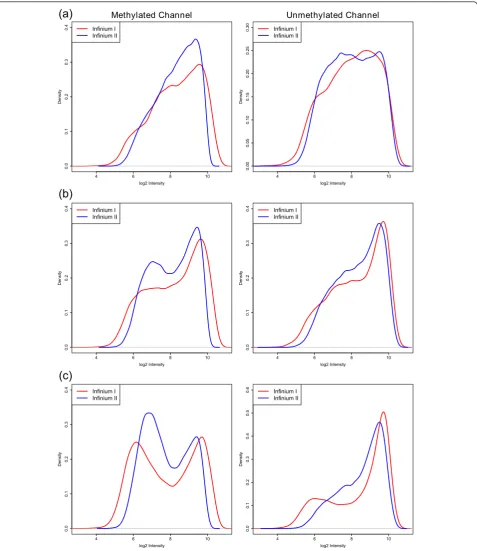
Normalization is intended to remove sources of techni-cal variation between measurements. In this process, however, it is important that any true biological differ-ences between samples and probes are maintained. It has been observed that there are differences between Infinium I and Infinium II probes that are clearly tech-nical in nature [21,26]. However, true biological differ-ences also exist between the probe types due to the design criteria of the array. Figure 2 shows the differ-ences in the intensity distributions of the Infinium I and Infinium II probes. We assume that most of the qualita-tive differences can be explained by the fact that, on average, the Infinium I probes contain a higher propor-tion of CpGs along the body of the probe. Specifically, probes with a high proportion of CpGs are more likely to be in CpG dense areas of the genome and therefore often reside in CpG islands, while probes with few CpGs are less likely to be in CpG islands. Based on the Illumina annotation, 57% of Infinium I probes are found in CpG islands, whilst only 21% of Infinium II probes are designated as islands. It has been well documented that CpGs in CpG islands have different methylation patterns compared to CpGs in the rest of the genome [27-29]. Therefore, it is not surprising that the distribu-tions of the intensities of Infinium I and Infinium II probes are vastly different.
Because the two probe types interrogate different sub-sets of the genome, established methods for normaliza-tion, such as quantile normalizanormaliza-tion, cannot be applied naively between probe types. Standard quantile normali-zation makes the distribution of probe intensities for each array in a set of arrays identical. More recently, a subset quantile normalization approach was introduced that uses large sets of control probes on the arrays for normalization and assumes that only the distributions of these control probes remain constant [30]. However, there are no large sets of controls that have probes cor-responding to both the Infinium I and Infinium II designs on the 450k platform.
we find that the intensity distributions of probes with the same number of CpGs in the probe body are similar (Figure 3). The degree of similarity does vary on a sam-ple to samsam-ple basis; however, we generally find that the intensity distributions of probes with the same number of CpGs in the probe body are more similar than the overall intensity distributions. Q-Q plots (Figure S1 in Additional file 1) of the sample shown in Figure 4 further support our observation, as they appear to be more linear when probes are grouped by their underly-ing CpG content than when all probes are considered together. Hence, the underlying assumption in our pro-posed method is that the differences in the intensity dis-tributions between the probe types, seen in Figure 4, represent technical differences between the Infinium I and II probe types.
The SWAN method has two parts. First, an average quantile distribution is determined using a subset of probes defined to be biologically similar based on CpG content. This is achieved by randomly selecting N Infi-nium I and II probes that have one, two and three underlying CpGs, whereNis the minimum number of probes in the six sets of Infinium I and II probes with one, two and three probe body CpGs. If no probes have been filtered out - for example, sex chromosome probes, and so on - N= 11,303. This results in a pool of 3N Infinium I and 3N Infinium II probes. Due to the vast differences in their distributions (Figure 2), the
subsequent processing is performed independently on both the methylated and unmethylated channels. The subset for each probe type, from each channel (methy-lated or unmethy(methy-lated), is sorted by increasing intensity. The value of each of the 3N pairs of observations is then assigned to be the mean intensity of the two probe types for that row or ‘quantile’. This is the standard quantile procedure. The second step is to then adjust the intensities of the remaining probes, of which there are many more Infinium II than I, by interpolation onto the distribution of the subset probes. This is done for each probe type separately using linear interpolation between the subset probes to define the new intensities. Consequently, while the distribution of the subset is identical, the intensity distribution of Infinium I probes is still vastly different from the distribution of Infinium II probes (Figure S2 in Additional file 1).
SWAN makes Infinium I and IIbvalue distributions more similar
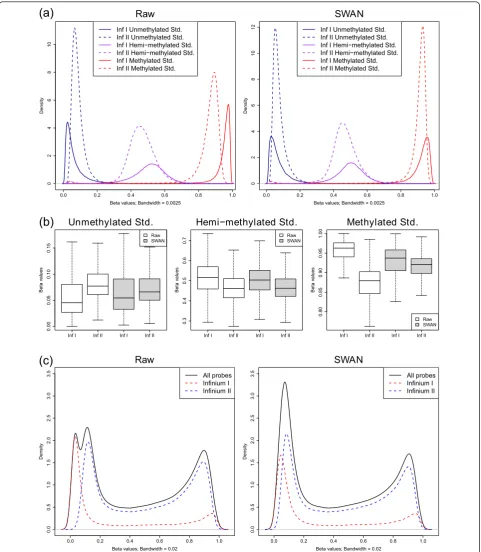
We applied the SWAN method to the fully methylated (FM), fully unmethylated (FU) and hemi-methylated (HM) sample analyzed by Bibikovaet al. [20]. The raw data were imported from IDAT files using the minfi package [25]. SWAN was applied to the raw intensity data and bvalues were calculated using the methylated and unmethylated intensity values for both the raw and SWAN normalized data. Figure 4a shows the raw and
4 6 8 10
0.
00
.10
.20
.30
.4
Methylated Channel
log2 Intensity
Density
Infinium I Infinium II
4 6 8 10
0.0
0.1
0.2
0.3
0.4
0.5
0.6
0.7
Unmethylated Channel
log2 Intensity
Density
[image:4.595.62.538.91.324.2]Infinium I Infinium II
SWAN normalizedbvalue distributions for Infinium I and II probes for all three methylation standards. It can be seen that after SWAN the averagebvalue distribu-tions from the two probe types are more consistent,
particularly for the FM and FU samples. Furthermore, the absolute difference in the medians of the Infinium I and II b value distributions is reduced after using SWAN for all three standards (Figure 4b; difference in
! !
"!
! !
! !
! !
! !
! !
[image:5.595.60.538.88.640.2]
!
"# $%&
'()
!
"# $%&
*
!
"# $%&
"#
!+#(,
-!(
%./0! (( ((
$%&
!+#(,
-!(
%./0! (( ((
"#
!+#(,
-!(
'() '() * *
$%&
!+#(,
-!(
[image:6.595.58.540.88.641.2]'() '() * *
medians: FM-Raw: 0.032, FM-SWAN: 0.012; HM-Raw: 0.057, HM-SWAN: 0.041; FU-Raw: 0.084, FU-SWAN: 0.017). Figure 4c shows an example of how the differ-ences in the two probe types can result in an aberrant overallb value distribution for a normal human DNA sample. Using SWAN, however, corrects the overall dis-tribution (Figure 4c). The SWAN procedure reduces the absolute difference between the peak positions of Infi-nium I and InfiInfi-nium II probes at the unmethylated (ΔPU) and methylated (ΔPM) extremes of the
distribu-tion (see Materials and methods). For the data shown in Figure 4c, ΔPUis reduced from 0.067 to 0.046, whilst ΔPM remains relatively unchanged from 0.035 to 0.038,
resulting in an improved overall b value distribution. Although the changes to the overallbvalue distribution appear dramatic for some samples, not all samples have large differences in probe type distributions. Usually the changes to thebvalues of individual CpGs after SWAN are less than ±0.1 (Figure S3 in Additional file 1).
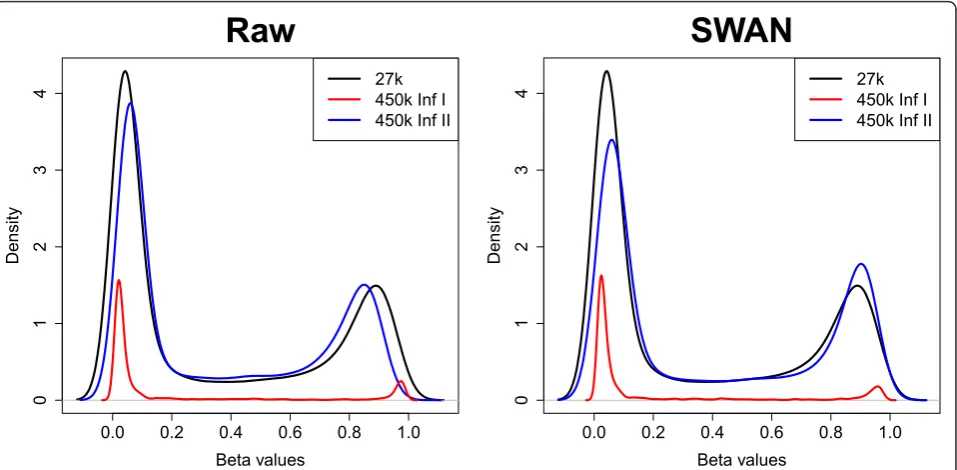
Next we compared the results of methylation analysis for an MCF7 sample that was assayed on the 450k array and the older 27k array. The 27k array only includes probes of the Infinium I design. Of the CpGs interro-gated on the 27k array, 25,978 are included on the 450k array but many (91%) of them are now assayed using the Infinium II design, while the remaining sites are still assayed using the Infinium I design. We found that using SWAN made the 450k Infinium I and II bvalue distributions more similar to those of 27k by reducing the absolute difference in the locations of the peaks at the extremes of the distribution (Figure 6). ΔPU is
reduced for 27k compared to 450k Infinium I from 0.021 to 0.018 and Infinium II from 0.0174 to 0.0167, whilst ΔPM is also reduced for 27k compared to 450k
Infinium I from 0.085 to 0.067 and Infinium II 0.04 to 0.013.
SWAN reduces technical variability
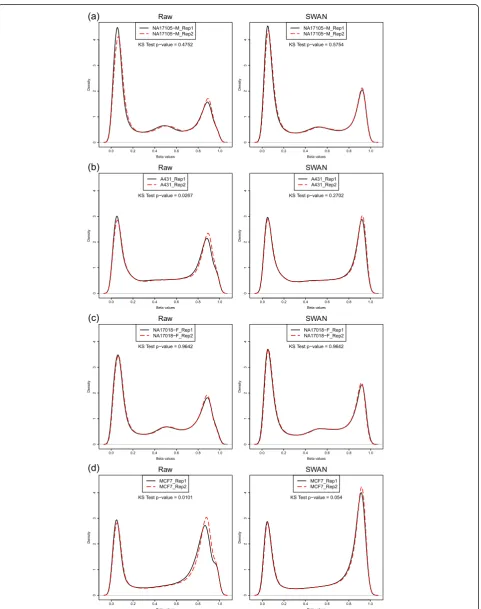
Next, we used four sets of technical replicates to show that SWAN reduces overall technical variability between arrays. The DNA samples, NA17105 and NA17018, and the MCF7 and A431 cancer cell lines were originally reported in Bibikova et al. [20] as technical replicates. We compared the density distributions of b values between the technical replicates for both the raw and SWAN normalized data (Figure 5). The similarity between theb value distributions of each pair of repli-cates was tested using the Kolmogorov-Smirnov (KS) test. The null hypothesis of the KS test is that the two replicates have the same distribution; therefore, a larger P-value indicates greater similarity between the distribu-tions. The results of the KS test for each set of replicates indicate that the bvalue distributions of the replicates are more similar after using SWAN. The same result
was obtained when we performed the KS test on the M-value (log2(Methylated/Unmethylated)) distributions of
the replicate pairs (Figure S4 in Additional file 1). Furthermore, the correlation between replicates, although high to begin with, always increased (Figure S5 in Additional file 1). Together, this indicates that although SWAN is a within array procedure that makes the Infinium I and Infinium II probes comparable, it also reduces technical variability when comparing between arrays by accounting for technical differences in the comparison of the two probe types between arrays. In other words, the difference between the distri-butions of Infinium I and Infinium II probes varies on an array by array basis regardless of the sample that is hybridized.
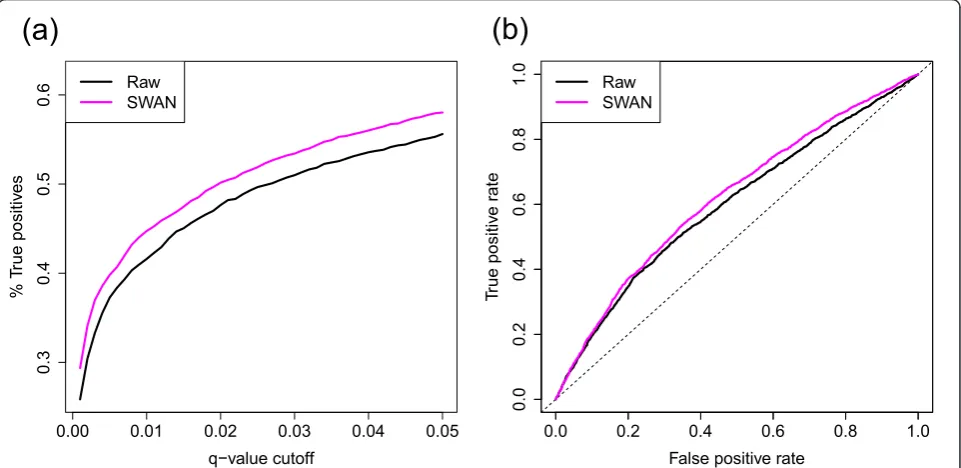
SWAN leads to better detection of differential methylation
We have shown that SWAN reduces technical variation between arrays. In order to show that the biological dif-ferences of interest have been maintained, we performed a differential methylation analysis between two groups, as reducing technical variation whilst maintaining biolo-gical differences should increase the power to detect truly differentially methylated CpGs. We performed a differential methylation analysis comparing three normal human kidney samples to three normal human rectum samples. To evaluate the impact of SWAN on differen-tial methylation analysis, unrelated kidney and rectal mucosa samples analyzed by reduced-representation bisulfite sequencing (RRBS) were used to define a set of
‘truly’differentially methylated loci (see Materials and methods).
!"#$ !"#$ %&'$!(
&)
!"#$ !"#$ %&'$!(
#$ #$ %&'$!(
&)
#$ #$ %&'$!(
!*#$ !*#$ %&'$!(+
&)
!*#$ !*#$ %&'$!(+
",*#$ ",*#$ %&'$!(
&)
[image:8.595.59.541.86.696.2]
",*#$ ",*#$ %&'$!(
indicate that whilst SWAN reduces technical variation, it does not reduce sensitivity.
We performed a second differential methylation analy-sis comparing three male arrays with two female arrays where each array is a pool of two individuals. The data were processed using three different methods: no nor-malization (raw), Illumina’s control normalization as implemented in minfi and SWAN. Probes on the Y chromosome and probes with a detectionP-value >0.01 in one or more samples were excluded, leaving a total of 482,704 probes for differential methylation analysis. Differential methylation analysis was performed using the testing available inminfion each of the three differ-ent versions of the data. Using SWAN consistdiffer-ently resulted in a higher number of significantly differentially methylated probes (DMPs) across a range of q-value thresholds (Figure S6a in Additional file 1). Further-more, using SWAN facilitated the detection of more unique DMPs (170) than using the other methods (118) (Figures S6b and S7 in Additional file 1). We also found that, as expected, a larger proportion (77.6%) of the unique DMPs detected when using SWAN was from the × chromosome, when compared with the combined set of unique DMPs detected using the other methods (63.6%).
Discussion
The HumanMethylation450 BeadChip includes a combi-nation of two different probe designs for assaying the
methylation status of 485,577 CpG sites across the human genome. This unique design clearly produces technical differences between probe types within a single array. Here we present a new within array normalization method that substantially reduces the technical variabil-ity between the probe types whilst maintaining the important biological differences.
The SWAN method makes the assumption that the number of CpGs within the 50 bp probe sequence reflects the underlying biology of the region being inter-rogated. Hence, the overall distribution of intensities of probes with the same number of CpGs in the probe body should be the same. The method then uses a sub-set quantile normalization approach to adjust the inten-sities of the probes on the arrays.
SWAN clearly improves the results obtained from the 450k array. We show that technical variability is reduced, whilst increasing the ability to detect differen-tial methylation between samples. We also report better correlation between the 450k arrays and the 27k arrays, which will be important for studies that aim to combine data from both platforms.
Although further investigations into other aspects of the analysis of these arrays, such as color normalization, between array normalization and statistical testing proce-dures for differential methylation may prove beneficial, we feel that SWAN is an essential step in the analysis of the Illumina Infinium HumanMethylation450 BeadChip. SWAN is available in the Bioconductor packageminfi[25].
0.0 0.2 0.4 0.6 0.8 1.0
01234
Raw
Beta values
Density
27k 450k Inf I 450k Inf II
0.0 0.2 0.4 0.6 0.8 1.0
01234
SWAN
Beta values
Density
[image:9.595.60.539.89.324.2]27k 450k Inf I 450k Inf II
Materials and methods
Data
The HumanMethylation450 data for the unmethylated, methylated and hemi-methylated reference standards, as well as the NA17105 and NA17018 DNA samples, and the MCF7 and A431 cancer cell lines were obtained from the Illumina website in the raw IDAT format. The HumanMethylation27 MCF7 data were kindly provided by Dr Marina Bibikova (Illumina).
The normal human kidney and rectum methylation data were sourced from The Cancer Genome Atlas (TCGA) Data Portal [32]. Specifically, the normal kidney samples (TCGA-B0-5121-11, TCGA-BP-4177-11 and TCGA-B0-5092-11) were part of the kidney renal clear cell carcinoma cohort, whilst the normal rectum sam-ples (TCGA-AG-3731-11, TCGA-AG-3725-11 and TCGA-B0-5121-11) were from the rectal adenocarci-noma cohort. All the data were in the raw IDAT format. The RRBS data were obtained from the Epigenomics Roadmap at NCBI [33]. The normal human kidney (NA000003582.1) and normal human primary rectal mucosal tissue (NA000003579.1) samples were both obtained in WIG format, which is a series of base pair posi-tions with correspondingbvalues for each chromosome.
The data for the male versus female differential methylation comparison comprise a subset of data gen-erated for an unrelated study by Martino et al. [34].
Briefly, the five HumanMethylation450 arrays used in this study were hybridized with bisulfite converted DNA pooled from three samples from two male individuals and two samples from two female individuals extracted from mononuclear cells collected at birth. These data were also in the raw IDAT format.
Normalization
As described in the results, the SWAN method has two parts. An average quantile distribution is firstly determined using a randomly selected subset of probes defined to be biologically similar based on CpG content. The subset for each probe type, from the methylated and unmethylated channels separately, is then sorted by increasing intensity and the value of each observation is assigned to be the mean intensity of the two probe types for that row or
‘quantile’. Subsequently, the intensities of the remaining probes are adjusted for each probe type separately using linear interpolation between the subset probes to define the new intensities. However, if probeihas an intensity greater than the maximum intensity of the subset probes, then it is given an intensity using the following rule:
xi>max(xsub)
di=xi−max(xsub)
xi= max(xsub) +di
!"#$
%
!"#$
[image:10.595.58.539.90.324.2]wherex are the measured intensities and x’are the normalized intensities for probei, and the normalization subset is denoted by sub. Similarly, for probes with intensities less than the minimum intensity in the sub-set, the rule is:
xi<min(xsub)
di= min(xsub)−xi
xi= min(xsub)−di
If the normalized intensity of any probe is less than or equal to zero, its intensity is set to the median intensity of the negative control probes.
CalculatingΔP
In order to assess the performance of the method, we calculated the difference in the peak positions of the Infinium I and Infinium II probes [21]. We define PUto
be the position of the maximum of the bdistribution withb< 0.5 (unmethylated peak) and PMto be the
posi-tion of the maximum with b > 0.5 (methylated peak). We define the absolute difference in peak positions between Infinium I and Infinium II probes as |ΔP = PI
-PII| for both the methylated and unmethylated peaks.
Selecting RRBS validation data
To identify CpG loci that were interrogated in both the RRBS and HumanMethylation450 data, we firstly identi-fied a set of CpGs that were assayed in both the kidney and rectum RRBS samples. The resulting list was then intersected with the probe locations of the Human-Methylation450 data. This produced a subset of 18,678 CpG loci.
Differential methylation analysis: tissue comparison
IDAT files were loaded into the R (2.14) environment using the Bioconductor (2.9)minfipackage (1.0.0) [25]. The detectionP-values for all probes were then calcu-lated for the data using functionality provided inminfi. Probes on the × and Y chromosomes were removed at this stage. Two versions of the data were used in subse-quent analyses: the raw data and SWAN data. Probes with a detectionP-value >0.01 in one or more samples were then excluded. The differential methylation analy-sis was performed for both datasets on the subset of 18,678 probes that overlapped with the RRBS data using the‘dmpFinder’minfi function. The‘dmpFinder’ func-tion uses an F-test to identify posifunc-tions that are differen-tially methylated between two groups. The tests are performed on M-values (log2
(Methylated/Unmethy-lated)) as recommended in Du et al. [35]. Variance shrinkage was used due to the small sample size. In
‘dmpFinder’, the sample variances are squeezed by com-puting empirical Bayes posterior means using the limma
package [36]. Example R code for performing a differen-tial methylation analysis using minfi can be found in Additional file 2.
True positives were defined to be CpGs that had an absolute difference inbvalue >0.25 between the kidney and rectum RRBS samples. Additionally, for the ROC analysis, which was performed using the ROCR package [31], true negatives were defined as those CpGs found to have an absolute difference inbvalue <0.05 between the RRBS samples.
Additional material
Additional file 1: Supplementary Figures S1 to S7.
Additional file 2: Example differential methylation analysis using minfiand SWAN in R.
Abbreviations
27k: HumanMethylation27; 450k: HumanMethylation450; bp: base pair; DMP: differentially methylated probe; FM: fully methylated; FU: fully unmethylated; HM: hemi-methylated; KS: Kolmogorov-Smirnov; ROC: receiver operating characteristic; RRBS: reduced representation bisulfite sequencing; SWAN: Subset-quantile Within Array Normalization; TCGA: The Cancer Genome Atlas.
Acknowledgements
We thank Kasper Hansen, Martin Aryee and Rafael Irizarry for making their
minficode available and including our methods. We thank Mark Robinson
for helpful discussion and critical reading of the manuscript. We also acknowledge Terry Speed, Nadia Davidson, the Cancer and Disease Epigenetics (Saffery) Lab and Early Life Epigenetics (Craig) Lab at the Murdoch Childrens Research Institute (MCRI) for helpful discussion. We thank David Martino and Marina Bibikova for providing access to their published data. We would also like to acknowledge the TCGA Research Network for making their vast resource of genomic data available. This work was supported by the Victorian Government’s Operational Infrastructure Support Program to MCRI.
Authors’contributions
AO conceived the idea. JM performed the analysis and wrote the code. LG contributed to data exploration and discussion. AO and JM wrote the paper. All authors read, edited and approved the final manuscript.
Competing interests
The authors declare that they have no competing interests.
Received: 23 January 2012 Revised: 20 March 2012 Accepted: 15 June 2012 Published: 15 June 2012
References
1. Rakyan VK, Down TA, Thorne NP, Flicek P, Kulesha E, Gräf S, Tomazou EM, Bäckdahl L, Johnson N, Herberth M, Howe KL, Jackson DK, Miretti MM, Fiegler H, Marioni JC, Birney E, Hubbard TJP, Carter NP, Tavaré S, Beck S:An integrated resource for genome-wide identification and analysis of human tissue-specific differentially methylated regions (tDMRs).Genome Res2008,18:1518-1529.
2. Esteller M:Cancer epigenomics: DNA methylomes and histone-modification maps.Nat Rev Genet2007,8:286-298.
3. Koga Y, Pelizzola M, Cheng E, Krauthammer M, Sznol M, Ariyan S, Narayan D, Molinaro AM, Halaban R, Weissman SM:Genome-wide screen of promoter methylation identifies novel markers in melanoma.Genome Res2009,19:1462-1470.
Feinberg AP:The human colon cancer methylome shows similar hypo-and hypermethylation at conserved tissue-specific CpG islhypo-and shores.
Nat Genet2009,41:178-186.
5. Schumacher A, Kapranov P, Kaminsky Z, Flanagan J, Assadzadeh A, Yau P, Virtanen C, Winegarden N, Cheng J, Gingeras T, Petronis A: Microarray-based DNA methylation profiling: technology and applications.Nucleic
Acids Res2006,34:528-542.
6. Weber M, Davies JJ, Wittig D, Oakeley EJ, Haase M, Lam WL, Schübeler D:
Chromosome-wide and promoter-specific analyses identify sites of differential DNA methylation in normal and transformed human cells.
Nat Genet2005,37:853-862.
7. Ordway JM, Bedell JA, Citek RW, Nunberg A, Garrido A, Kendall R, Stevens JR, Cao D, Doerge RW, Korshunova Y, Holemon H, McPherson JD, Lakey N, Leon J, Martienssen RA, Jeddeloh JA:Comprehensive DNA methylation profiling in a human cancer genome identifies novel epigenetic targets.Carcinogenesis2006,27:2409-2423.
8. Meissner A, Gnirke A, Bell GW, Ramsahoye B, Lander ES, Jaenisch R:
Reduced representation bisulfite sequencing for comparative high-resolution DNA methylation analysis.Nucleic Acids Res2005,33:5868-5877. 9. Rauch T, Li H, Wu X, Pfeifer GP:MIRA-assisted microarray analysis, a new
technology for the determination of DNA methylation patterns, identifies frequent methylation of homeodomain-containing genes in lung cancer cells.Cancer Res2006,66:7939-7947.
10. Kuang SQ, Tong WG, Yang H, Lin W, Lee MK, Fang ZH, Wei Y, Jelinek J, Issa JP, Garcia-Manero G:Genome-wide identification of aberrantly methylated promoter associated CpG islands in acute lymphocytic leukemia.Leukemia2008,22:1529-1538.
11. Omura N, Li CP, Li A, Hong SM, Walter K, Jimeno A, Hidalgo M, Goggins M:
Genome-wide profiling of methylated promoters in pancreatic adenocarcinoma.Cancer Biol Ther2008,7:1146-1156.
12. Bibikova M, Le J, Barnes B, Saedinia-Melnyk S, Zhou L, Shen R,
Gunderson KL:Genome-wide DNA methylation profiling using Infinium® assay.Epigenomics2009,1:24.
13. Lister R, Pelizzola M, Dowen RH, Hawkins RD, Hon G, Tonti-Filippini J, Nery JR, Lee L, Ye Z, Ngo QM, Edsall L, Antosiewicz-Bourget J, Stewart R, Ruotti V, Millar Ha, Thomson Ja, Ren B, Ecker JR:Human DNA methylomes at base resolution show widespread epigenomic differences.Nature
2009,462:315-322.
14. Ruike Y, Imanaka Y, Sato F, Shimizu K, Tsujimoto G:Genome-wide analysis of aberrant methylation in human breast cancer cells using methyl-DNA immunoprecipitation combined with high-throughput sequencing.BMC
Genomics2010,11:137.
15. Bibikova M, Fan JB:Genome-wide DNA methylation profiling.Wiley
Interdiscip Rev Syst Biol Med2009,2:210-223.
16. Laird PW:Principles and challenges of genome-wide DNA methylation analysis.Nat Rev Genet2010,11:191-203.
17. Huang YW, Huang THM, Wang LS:Profiling DNA methylomes from microarray to genome-scale sequencing.Technol Cancer Res Treat2010,
9:139-147.
18. Beck S:Taking the measure of the methylome.Nat Biotechnol2010,
28:1026-1028.
19. Bock C, Walter J, Paulsen M, Lengauer T:CpG island mapping by epigenome prediction.PLoS Comput Biol2007,3:e110.
20. Bibikova M, Barnes B, Tsan C, Ho V, Klotzle B, Le JM, Delano D, Zhang L, Schroth GP, Gunderson KL, Fan JB, Shen R:High density DNA methylation array with single CpG site resolution.Genomics2011,98:288-295. 21. Dedeurwaerder S, Defrance M, Calonne E, Denis H, Sotiriou C, Fuks F:
Evaluation of the Infinium Methylation 450K technology.Epigenomics
2011,3:771-784.
22. Irizarry RA, Hobbs B, Collin F, Beazer-Barclay YD, Antonellis KJ, Scherf U, Speed TP:Exploration, normalization, and summaries of high density oligonucleotide array probe level data.Biostatistics2003,4:249-264. 23. Quackenbush J:Microarray data normalization and transformation.Nat
Genet2002,32(Suppl):496-501.
24. Smyth GK, Speed T:Normalization of cDNA microarray data.Methods
2003,31:265-273.
25. minfi: Analyze Illumina’s 450k methylation arrays.[http://www. bioconductor.org/packages/release/bioc/html/minfi.html].
26. Bibikova M, Barnes B, Tsan C, Ho V, Klotzle B, Le JM, Delano D, Zhang L, Schroth GP, Gunderson KL, Fan J-B, Shen R:High density DNA methylation array with single CpG site resolution.Genomics2011,98:288-295.
27. Grunau C, Hindermann W, Rosenthal A:Large-scale methylation analysis of human genomic DNA reveals tissue-specific differences between the methylation profiles of genes and pseudogenes.Hum Mol Genet2000,
9:2651-2663.
28. Smiraglia D, Rush L, Frühwald M, Dai Z, Held W, Costello J, Lang J, Eng C, Li B, Wright F, Caligiuri M, Plass C:Excessive CpG island hypermethylation in cancer cell lines versus primary human malignancies.Hum Mol Genet
2001,10:1413-1419.
29. Strichman-Almashanu LZ, Lee RS, Onyango PO, Perlman E, Flam F, Frieman MB, Feinberg AP:A genome-wide screen for normally
methylated human CpG islands that can identify novel imprinted genes.
Genome Res2002,12:543-554.
30. Wu Z, Aryee MJ:Subset quantile normalization using negative control features.J Comput Biol2010,17:1385-1395.
31. Sing T, Sander O, Beerenwinkel N, Lengauer T:ROCR: visualizing classifier performance in R.Bioinformatics2005,21:3940-3941.
32. The Cancer Genome Atlas Data Portal..[https://tcga-data.nci.nih.gov/tcga/ ].
33. NCBI Epigenomics..[http://www.ncbi.nlm.nih.gov/epigenomics/]. 34. Martino D, Maksimovic J, Joo JH, Prescott SL, Saffery R:Genome-scale
profiling reveals a subset of genes regulated by DNA methylation that program somatic T-cell phenotypes in humans.Genes Immun2012, doi: 10.1038/gene.2012.7.
35. Du P, Zhang X, Huang C-C, Jafari N, Kibbe WA, Hou L, Lin SM:Comparison of Beta-value and M-value methods for quantifying methylation levels by microarray analysis.BMC Bioinformatics2010,11:587.
36. Smyth GK:Limma: linear models for microarray data.InBioinformatics and
Computational Biology Solutions using R and Bioconductor.Edited by:
Gentleman R, Carey V, Dudoit S, Irizarry R, Huber W. New York: Springer; 2005:397-420.
doi:10.1186/gb-2012-13-6-r44
Cite this article as:Maksimovicet al.:SWAN: Subset-quantile Within Array Normalization for Illumina Infinium HumanMethylation450 BeadChips.Genome Biology201213:R44.
Submit your next manuscript to BioMed Central and take full advantage of:
• Convenient online submission
• Thorough peer review
• No space constraints or color figure charges
• Immediate publication on acceptance
• Inclusion in PubMed, CAS, Scopus and Google Scholar
• Research which is freely available for redistribution