Georgia State University Georgia State University
ScholarWorks @ Georgia State University
ScholarWorks @ Georgia State University
Public Health Theses School of Public Health
Summer 8-7-2012
Consumption of Rainwater and Diarrheal Disease in Children
Consumption of Rainwater and Diarrheal Disease in Children
Under Five in the Dominican Republic from 2002 to 2007
Under Five in the Dominican Republic from 2002 to 2007
Andrea Mpogui
Follow this and additional works at: https://scholarworks.gsu.edu/iph_theses
Recommended Citation Recommended Citation
Mpogui, Andrea, "Consumption of Rainwater and Diarrheal Disease in Children Under Five in the Dominican Republic from 2002 to 2007." Thesis, Georgia State University, 2012.
https://scholarworks.gsu.edu/iph_theses/232
ABSTRACT
ANDREA C. MPOGUI
Consumption of Rainwater and Diarrheal Disease in Children Under Five in the Dominican Republic from 2002 to 2007
(Under the direction of Dr. Christine Stauber, Faculty Member)
Background: With the MDG 7 target deadline approaching to halve the global population lacking access to improved water and sanitation by 2015, many nations, developing nations in particular, find the need to explore alternative water sources. Rainwater has been consumed by people all over the world for centuries and today millions of people around the world depend on rainwater for drinking and domestic use. However, there have been concerns raised in recent decades as to the quality of rainwater harvested for potable use.
Methods: Data from the Demographic and Health Surveys database were examined for this study. The data included 50,579 household surveys between 2002 and 2007 from the Dominican Republic. STATA version 8 was used for data analysis. Descriptive statistics were computed, and logistic regression analysis was used to compare toilet type, water source, and type of place of residence with prevalence of diarrheal disease in children under five.
Results: This study found that rainwater presents less risk for diarrheal disease when compared to all other water sources (excluding bottled water). In 2002, people who consumed all other sources of water (excluding bottled) were 1.28 times more likely to have diarrhea in children under 5 (95% CI 1.05-1.57) compared to those who consumed rainwater. In 2007, people who consumed all other sources of water (excluding bottled water) were 1.33 times more likely to have diarrhea in children under 5 (95% CI 1.08-1.65) compared to those who consumed rainwater and 1.31 times more likely in both years (95% CI 1.13-1.51) to have diarrhea in children under 5 in those who consumed all other sources of water (excluding bottled water) compared to those who consumed rainwater.
Discussion: This study concluded that consuming rainwater presents a decreased risk for diarrheal disease compared to all other sources (excluding bottled water). These results are consistent with existing studies that have attempted to quantify the health risks of rainwater consumption which also found no increased health risks associated with consumption of
CONSUMPTION OF RAINWATER AND DIARRHEAL DISEASE IN CHILDREN
UNDER FIVE IN THE DOMINICAN REPUBLIC FROM 2002 TO 2007
By
ANDREA C. MPOGUI
B.S., UNIVERSITY OF GEORGIA
A Thesis Submitted to the Graduate Faculty of Georgia State University in Partial Fulfillment
of the Requirements for the Degree
MASTER OF PUBLIC HEALTH
ATLANTA, GEORGIA
ii
CONSUMPTION OF RAINWATER AND DIARRHEAL DISEASE IN CHILDREN
UNDER FIVE IN THE DOMINICAN REPUBLIC FROM 2002 TO 2007
By
ANDREA C. MPOGUI
Approved:
Christine Stauber, PhD, MS
Committee Chair
Lisa Casanova, PhD
Committee Member
July 20, 2012
iii
Acknowledgements
I would first like to thank my thesis committee, Dr. Christine Stauber and Dr. Lisa Casanova. I am beyond grateful for your guidance and patience during this process.
I am eternally grateful to the loving family and supportive friends who kept me lifted during this journey. I appreciate your words of encouragement, prayers, and moments of truth.
iv
AUTHOR’S STATEMENT
In presenting this thesis as a partial fulfillment of the requirements for an
advanced degree from Georgia State University, I agree that the Library of
the University shall make it available for inspection and circulation in
accordance with its regulations governing materials of this type. I agree that
permission to quote from, to copy from, or to publish this thesis may be
granted by the author or, in her absence, by the professor under whose
direction it was written, or in his absence, by the Associate Dean, College of
Health and Human Sciences. Such quoting, copying, or publishing must be
solely for scholarly purposes and will not involve any potential financial
gain. It is understood that any copying from or publication of this
dissertation which involves potential financial gain will not be allowed
without written permission of the author.
Andrea C. Mpogui
v
NOTICE TO BORROWERS
All theses deposited in the Georgia State University Library must be used in accordance with the stipulations prescribed by the author in the preceding statement.
The author of this thesis is:
Andrea C. Mpogui
C/o Institute of Public Health Georgia State University P.O. Box 3995
Atlanta, GA 30302-3995
The Chair of the committee for this thesis is:
Christine Stauber, Ph.D., M.S. Institute of Public Health Georgia State University P.O. Box 3995
Atlanta, Georgia 30302-3995
Users of this thesis who not regularly enrolled as students at Georgia State University are required to attest acceptance of the preceding stipulation by signing below. Libraries borrowing this thesis for the use of their patrons are required to see that each user records here the information requested.
NAME OF USER ADDRESS DATE TYPE OF USE
vi
CURRICULUM VITAE
Andrea C. Mpogui
C/o Institute of Public Health, Georgia State University P.O. Box 3995
Atlanta, GA 30302-3995 [email protected]
EDUCATION
Georgia State University, Atlanta, GA 2009
- 2012
Master of Public Health; Prevention Sciences track
University of Georgia, Athens, GA 2001
- 2005
Bachelor of Science, Environmental Health
PROFESSIONAL EXPERIENCE
Dekalb County Board of Health 2006 -
Present
Environmental Health Specialist
PROFESSIONAL CERTIFICATIONS
Certified Food Safety Professional (National Registry)
Standardized Food Retail Inspection/Training Officer (Georgia Department of Human Resources)
Registered Environmental Health Specialist (Georgia Board of Registered Professionals)
SKILLS
vii
TABLE OF CONTENTS
Acknowledgements ... ii
TABLE OF CONTENTS ... vii
LIST OF TABLES ... ix
LIST OF FIGURES ... x
INTRODUCTION ... 1
1.1 Background ... 1
1.2 Purpose of the Study ... 2
1.3 Research Questions ... 3
REVIEW OF THE LITERATURE ... 4
2.1 Water Access ... 4
Improved vs. Unimproved Water Source ... 5
2.2 Burden of Diarrheal and Concern for Children Under Five ... 7
2.3 Rainwater ... 7
2.4 Dominican Republic ... 13
2.5 Summary ... 14
METHODOLOGY ... 15
3.1 Data Source ... 15
3.2 Study Population ... 16
3.3 Study measures ... 16
3.4 Data Analysis ... 17
RESULTS ... 19
viii
Drinking Water Source and Place of Residence ... 21
Diarrhea in Children Under Five... 22
Sanitation ... 23
4.2 Logistic Regression Analyses ... 24
DISCUSSION AND CONCLUSION ... 29
5.1 Discussion... 29
5.2 Limitations of the Study ... 33
5.3 Recommendations ... 34
ix
LIST OF TABLES
Table 1. Socio-demographic Characteristics of Study Respondents ... 20
Table 2. Month of Interview ... 21
Table 3. Proportion of Drinking Water Source ... 22
Table 4. Proportion of Drinking Water Source Stratified by Type of Place of Residence 22
Table 5. Proportion of households with children under 5 reporting recent diarrhea in children under 5 ... 23
Table 6. Proportion of Households with recent diarrhea in children under 5 by water source ... 23
Table 7. Proportion of sanitation facilities by type ... 24
Table 8. Sanitation facilities stratified by urban rural for 2002, 2007, and both years combined ... 24
Table 9. Binary logistic regression analysis: reported diarrhea in children under 5 and water source; rainwater is referent ... 25
Table 10. Binary logistic regression analysis: reported diarrhea in children under 5 and water source; bottled water is referent ... 26
Table 11. Binary logistic regression analysis ... 27
x
LIST OF FIGURES
Figure 1. Types of sources of drinking water. Source: WHO/UNICEF JMP ... 5
Figure 2. Trends in global drinking water coverage, 1990-2010, projected to 2015. Source: UNICEF/WHO 2012 ... 6
1
CHAPTER I:
INTRODUCTION
1.1 Background
According to the World Health Organization (WHO), 1.9 million people died
from diarrheal disease in 2004 and 88% of deaths from diarrheal disease are water,
sanitation or hygiene related (2012). Diarrheal disease is especially a concern in children
under five as it accounts for the deaths of 1.5 million children per year worldwide and is
the second leading cause of death in children under five (WHO, 2009). Access to
improved water and sanitation play a key role in reducing morbidity and mortality of
diarrheal disease. WHO estimates that advances in access to improved water and
sanitation as well as improvements in hygiene and water resource management could
result in the reduction of almost 10% of the total burden of disease worldwide (2012).
The United Nations signed a declaration in September of 2000 to combat poverty,
hunger, disease, illiteracy, environmental degradation, and discrimination against women.
Out of this declaration the Millennium Development Goals (MDGs) were born with
targets set to be achieved by the year 2015 (WHO 2012). The MDG to increase access to
improved water sources has been met, but in order to achieve universal access and to
maintain sustainable water sources, nations around the world will have to tap into
2
Rainwater has been consumed by people all over the world for centuries and
today millions of people around the world depend on rainwater for drinking and domestic
use. However, there have been concerns raised in recent decades as to the quality of
rainwater harvested for potable use (Gould 1999). There are few studies in the literature
examining the health risks associated with rainwater consumption and the findings have
varied in the past (Lye, 2002 and Dean & Hunter, 2012). A recent review of the literature
found no evidence that there is increased risk of gastrointestinal illness associated with
rainwater consumption (Dean & Hunter, 2012), while a previous review of the literature
found that consumers of rainwater may be at “considerable risk to a variety of infectious
disease” (Lye, 2002). Clearly, there is a need for more studies to provide evidence as to
the health risks associated with rainwater consumption.
1.2 Purpose of the Study
Access to improved water and sanitation play an important role in reducing the
global childhood burden of diarrheal disease. Though access to improved water sources
has significantly improved since the Millennium Development Goal target was set in
2000, there are still over 780 million people still using unsafe drinking water sources.
Furthermore, it is important to determine if sources we now consider to be improved,
such as rainwater, are safe.
The purpose of this study was to examine the association between consumption of
rainwater as the main drinking water source and reported diarrhea in children under five
in a cross-sectional survey of respondents from the Dominican Republic. More
3
rainwater harvesting systems on access to safe water sources and prevalence of
gastrointestinal illness.
1.3 Research Questions
To further assess the association of rainwater consumption and diarrheal disease
the following questions were examined:
1. Who in the study population is using rainwater and how has that changed over
time?
2. Is consumption of rainwater associated with decreased risk of diarrheal disease as
4
CHAPTER II:
REVIEW OF THE LITERATURE
The purpose of this study was to examine the association between rainwater
consumption and diarrheal disease in children under five. To support the need for this
study, a review of existing literature illustrated the issue of access to improved water
sources and focused on what is currently known about the microbial quality of rainwater
and risk for gastrointestinal illnesses with consumption of rainwater. There is still more
evidence needed to determine the health risks associated with consumption of rainwater.
2.1 Water Access
The United Nations (UN) created the Millennium Development Goals (MDG) in
2000 after creating and signing a declaration to “free people from extreme poverty and
multiple deprivations” (UNDP 2012). As part of Goal 7 to ensure environmental
sustainability, the UN proposed to halve the proportion of people without sustainable
access to safe drinking water and basic sanitation by 2015 (WHO 2012 & UNDP 2012).
As the 21st Century began, one in five people living in the developing world (1.1
billion people) lacked access to clean water (UNDP 2006) and according to the
WHO/UNICEF Joint Monitoring Programme for Water Supply and Sanitation (JMP),
today, over 780 million people still use unsafe drinking water sources (2012).
The UNDP’s 2006 Human Development Report states that average water use
5
United States while the average use in countries such as Mozambique is less than
10 liters. The World Health Organization (WHO) and the United Nations Children’s
Fund (UNICEF) suggest a minimum requirement of 20 liters per day from a source
within 1 kilometer of the household; however, UNDP suggest that this is only sufficient
for drinking and basic personal hygiene and that if bathing and laundry needs are
considered this would raise the personal threshold to about 50 liters per day (2006).
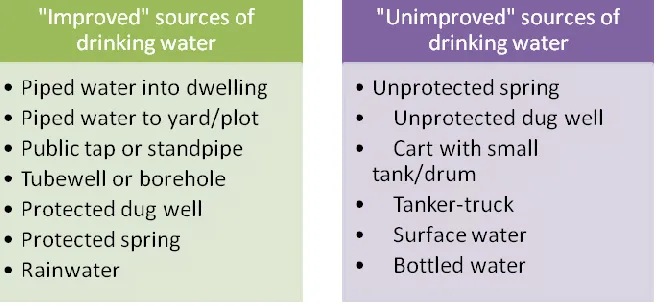
Improved vs. Unimproved Water Source
In order to make global comparison of estimates of water source, JMP classified
water sources into two groups—improved and unimproved (2010). JMP defines an
improved drinking-water source as “one that, by nature of its construction or through
active intervention, is protected from outside contamination, in particular, from
contamination with fecal matter (2010). Figure 1 displays the different types of water
[image:17.612.114.447.467.620.2]sources categorized into improved and unimproved sources.
Figure 1. Types of sources of drinking water. Source: WHO/UNICEF JMP
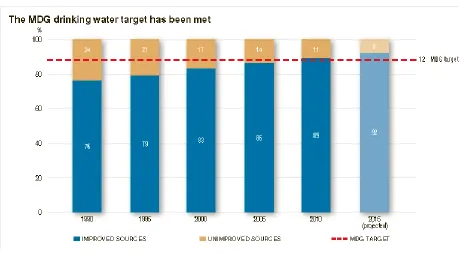
MDG Update
WHO reports that the MDG drinking water target has been reached (2012). Over
6
proportion of the global population still using unimproved sources is estimated at 11%.
Therefore, 89% of the world’s population was using an improved water source in 2010
[image:18.612.108.571.204.457.2](WHO 2012).
Figure 2. Trends in global drinking water coverage, 1990-2010, projected to 2015.
Source: UNICEF/WHO 2012
While this is a great accomplishment, WHO cautions that a great deal of work
still remains. They cite the lack of complete information about drinking water safety for
global monitoring as an issue that needs to be addressed moving forward. Because lab
testing at the national level in all countries is expensive and complicated, the JMP created
a proxy indicator for water quality as mentioned above by defining “improved” and
“unimproved” water sources. However, some of these improved sources may not be
7
(WHO 2012). Consequently, it is important moving forward to measure the risk of
disease associated with various water sources.
2.2 Burden of Diarrheal and Concern for Children Under Five
WHO states that in 2004, water, sanitation and hygiene were responsible for 1.9
million deaths from diarrhea, and 4.2% of the global burden of disease. WHO also
estimates that 88% of the world’s diarrheal deaths are caused by unsafe water, sanitation,
or hygiene (2012). Diarrheal disease is the second most common contributor to the
disease burden in developing countries (Prüss & Havelaar, 2001).Diarrheal disease
mainly affects children under two years old, and it is a leading cause of mortality and
malnutrition in children under five years (WHO,2009). According to UNDP, of the 60
million deaths in the world in 2004, 10.6 million (nearly 20%) were children under the
age of five (2006). There are 5 billion cases of diarrhea in children each year in
developing countries which claim the lives of 1.8 million children under the age of five
each year (UNDP, 2006). Clean water and sanitation play a big role in reducing child
mortality. WHO lists them among the key measures to prevent diarrhea (WHO, 2009).
2.3 Rainwater
There have been various approaches to addressing the global water crisis.
Rainwater harvesting has gained attention as a community-based and environmentally
sustainable method to increasing water access. Gould states that rainwater harvesting is
of particular interest in rural areas of developing countries where community systems fail
to provide adequate water supplies (1999).
8
The benefit is not just in having increased access to water, but household
rainwater collection can also save time, energy, and money. By not having to haul water
from a communal source or purchase it from a vendor, households can have more time,
energy, and money for other purposes, which, in turn can provide an economic boost
(Cain 2010). Lehmann and Tsukada examined how rainwater harvesting might reduce
poverty (2011). They also found that rainwater harvesting allows for savings in time
devoted to household collection which may mean more time spent engaging in other
productive activities which, in turn may have an economic benefit. Specifically, the
authors found that households would be able to dedicate more time and resources to
agriculture and livestock production (Lehmann and Tsukada 2011).Though rainwater
harvesting overall can be viewed as cost-effective, the initial cost of rainwater harvesting
system could be an issue for some households. Cain points out that poorer families may
not be able to afford the initial installation of a basic system. A basic system can cost
around $60.00 which, while relatively inexpensive in developed nations, can add up to
several months’ income for a poorer family in a developing nation (2010).
Implementation of more rainwater harvesting systems in lower income communities will
require assistance from governments and non-governmental organizations (Cain 2010).
Nijhof and Strestha examined the use of micro-credit (small loans) in Nepal to promote
rainwater harvesting (2010). The researchers found that issuing micro-credit for rainwater
harvesting systems can greatly contribute to the promotion of rainwater harvesting
technology in Nepal (Nijhof and Strestha, 2010).
9
When considering the success of a rainwater harvesting system, climate is of chief
concern. How can climate affect the success of a rainwater harvesting system? In his
review of the literature, Gould found that a semi-humid climate with an average rainfall
of 1,000 mm in a year, a roof sized at 50m2 can yield 40m3 of water per year which is
equivalent to 100 liters per day. He also found that in a semi-arid climate, with average
yearly rainfall of 500 mm, a roof sized 50m2 can potentially yield 20m3 of water which,
with sufficient storage, could supply more than 50 litres of water per day to the household
(1999). In Cain’s survey of rainwater use in India, he stated that field testing has
demonstrated the usefulness of rainwater harvesting in variety of environments in India
(2010). Pandey, Gupta, and Anderson examined rainwater use in arid climates. The
authors hypothesized that as water resources are affected by climate changes, people will
resort to rainwater harvesting rather than migration (2003). They found that historically
in India as the aridity increased, rainwater harvesting practices increased (Pandey et al,
2003).
Environmental Considerations
Environmental sustainability is the overarching in issue in the goal for improving
water access. Pandey et al point out that more than half of the accessible freshwater
runoff globally is already appropriated for human use and that per capita availability of
freshwater will decrease in the coming century because the human population will grow
faster than increases in the amount of accessible freshwater (2003). With depletion of our
natural resources being a constant concern, success with increasing access to improved
water sources is hinged upon ensuring that these sources are sustainable. Positive effects
10
ecosystems (by reducing the need to pump groundwater or divert ecological flows),
reduced demand on current water infrastructure, and reduction of storm water and
wastewater flows which can carry pollution into area waters (Cain 2010).
Water Quality and Human Health Considerations
According to Thomas and Greene (as cited by Gould 1999), rainwater is generally
considered unsafe to drink in most industrialized urban areas where there is a high degree
of atmospheric pollution. Atmospheric pollution is generally of less concern in rural
areas, and Waller states (as cited by Gould 1999) that most contamination occurs after the
rainwater comes into contact with the catchment system. A rainwater tank can be
contaminated when material from the roof and gutters are washed into it. Pathogens may
be present from fecal matter of birds, lizards, and other animals which may access the
roof (Ahmed, Vieritz, Goonetilleke, & Gardner, 2010). There are a number of
contaminants that could affect the quality of rainwater, but as mentioned earlier, review
of the existing literature for this study will focus on microbial contamination.
Ahmed, Gardner, and Toze examined the literature for health risks associated
with the use of roof-harvested rainwater (RHRW) and found that published data suggest
that the microbial quality of RHRW should be considered less than that expected for
potable water (2011). In a study of the quality of roof-collected rainwater in Auckland,
New Zealand, researchers found a high prevalence of bacterial indicator organisms. They
were also able to detect Salmonella and Cryptosporidium. They suggest that their
findings indicate that roof-collected rainwater supplies are a potential source for human
illness, even stating that roof-collected rainwater systems appear to be of poor
11
noted however that the eligible samples for testing were small in number and the
prevalence of Salmonella and Crypstosporidium was small, 0.9% and 4% respectively.
Also, there was no indication as to what health risks may be presented from the
pathogens at the levels at which they were detected.
Ahmed et al used quantitative microbial risk assessment to determine the health
risks associated with roof-harvest rainwater in Queensland, Australia. They found that in
their study that the pathogens detected in the potable and nonpotable rainwater supplies
did not present health risks at the level at which they were detected (2010).
In an assessment of rainwater quality in Greece, researchers were able to detect
total coliforms in 80.3% of collected rainwater samples and E.coli and enterococci at
40.9% and 28.8% respectively. Though found in high percentages of sample, the
indicators were found at low concentrations and the researchers concluded that the
rainwater assessed during their 3-year for chemical and microbial quality was unpolluted.
They also suggest regular cleaning of catchments, using first flush to discard the first
portion of each rainfall, and disinfection of tanker trucks use to transport the rainwater in
order to maintain a safe supply (Sazakli, Alexopoulos & Leotsinidis, 2007).
Fry et al (2010) used engineering analysis methodology to estimate potential
public health improvement from increased water supply. Specifically, they estimated
potential reduction in diarrhea disability adjusted life years (DALYs) per month from
enhancements in the water supply from domestic rainwater harvesting (DRWH). The
study focused on West Africa and showed that the effectiveness of DRWH for reducing
diarrheal disease burden varied throughout the region with up to a 25% reduction in
12
Heyworth, Glonek, Maynard, Baghurst, and Finlay-Jones conducted a study
which was published in 2006 of 4 to 6 year old children who drank tank rainwater
(untreated rainwater) or treated public mains water in rural South Australia. They
concluded that in this study, children who regularly consumed tank rainwater were at no
greater odds of gastroenteritis than those who drank treated public mains water
(Heyworth et al 2006).Abdulla and Al-Shareef found in their study of roof-harvested
rainwater in Jordan that the presence of fecal coliforms and total coliforms in the
rainwater samples they tested did not meet WHO standards. They suggested chlorination
of the collected rainwater at least once every rainy season and cleaning of the catchment
area before the start of the rainy season. Further they found that when the “first flush”
method is used, (collecting the first flush of water and disposing of it, minimizing the
amount of material present in the collected water that will be consumed) the collected
rainwater is usually safe to consume (2009).
Garrett et al, in their examination of household water treatment, latrines, shallow
wells, and rainwater harvesting on diarrhea incidence in children in rural Kenya, found
that chlorination of stored water, latrine presence, rainwater use, and living in an
intervention village were all independently associated with lower risk of diarrhea (2008).
Dean and Hunter in their recent systematic review of the literature aimed to
improve estimates of the health risk (particularly gastrointestinal) associated with
consumption of harvested rainwater. The authors cited a previous review (Lye 2002)
which concluded that consumption of rainwater may pose considerable risk to various
infectious diseases. Dean and Hunter, however, criticized this review as not being
13
eight studies about the health risks associated with rainwater consumption. The authors
found that when compared with unimproved sources, there is evidence that rainwater
consumption is associated with fewer episodes of diarrheal disease. They also found that
while overall, there was no evidence that rainwater consumption carries increased risk
compared to other improved source, there may be evidence for increased risk of specific
infections when consuming rainwater, particularly campylobacteriosis. However, the
authors acknowledge and discussed the limitations to the study in which that association
was found. The review concluded that there is currently no evidence that rainwater
carries increased risk when compared to other improved sources (Dean and Hunter 2012).
2.4 Dominican Republic
Water Access and Diarrheal Disease in the Dominican Republic
WHO data from 2010 shows that 3.7% of all deaths in the Dominican Republic
were water, sanitation and hygiene related. The most recent JMP estimates show access
to water in the Dominican Republic overall to be high. According to JMP, from the 1990
to 2010 the proportion of urban residents using water piped onto premises for drinking
water decreased by 14% and increased by 9% in rural areas with an overall drop of 1%.
During this time, the proportion of urban residents using other improved sources
increased by 3% while the number of rural residents using other improved sources
decreased by 1% with an over decrease in Dominican Republic residents using drinking
water from other improved sources by 1%. The proportion of urban residents using
unimproved sources (other than surface water) increased by 11% and increased by 13%
for rural residents while overall increasing by 11%. So, in 2010 86% of the country had
14
of 2010, 14% of the country still in need of access to an improved drinking water source
(JMP 2012).
WHO estimates the burden of diarrheal disease in the Dominican Republic, based
on 2004 data, at 1300 deaths/yr.--5.0 DALYs (Daily adjusted life years) per 1000 capita
per year 2009). The overall under five mortality rate is 29/1000 live births (WHO, 2009).
2.5 Summary
Improving global access to improved water, has long been on the UN agenda.
Great strides have been made to increase access to improved water sources all of the
world and the latest WHO/UNICEF reports indicate that the MDG 2015 target for access
to improved water has been met. Still, there is more work to do as there are still some 780
million people who use unsafe drinking water sources, and in order to ensure that the
“improved” water sources are safe, more research is needed to quantify health risks
associated with specific water sources.
Interest in harvesting rainwater has been well documented throughout history and
continues to increase around the world, in developing areas of the world in particular.
Rainwater harvesting systems are fairly inexpensive and their use provides some
economic benefits as well as environmental benefits. However, the benefits and/or risk of
rainwater consumption are not well defined. One most recent review of the literature
suggests that despite the findings of an earlier review, there is no evidence of an
increased risk for gastrointestinal illness when consuming rainwater. Still, more studies
15
CHAPTER III:
METHODOLOGY
3.1 Data Source
The data used in this study were obtained from the Demographic and Health
Surveys (DHS). The MEASURE DHS project was initiated in 1984 by U.S. Agency for
International Development (USAID) to provide data and analysis on the population,
health, and nutrition of women and children in developing countries. The project
provides technical assistance to more than 240 surveys in over 85 countries. The surveys
are nationally-representative household surveys that provide data for a wide range of
monitoring and impact evaluation indicators in the areas of population, health, and
nutrition (MEASURE DHS, 2007).
There are two types of surveys—standard and interim. These surveys have large
sample sizes (between 5,000 and 30,000 households) and are usually conducted every 5
years. DHS surveys take on average 18-20 months to complete. The process is completed
in four stages: survey preparation and questionnaire design; training and fieldwork; data
processing; and final report, data preparation and dissemination. A special software
package named CSPro (previously ISSA) is used to process all the survey data. All steps
are completed with CSPro which include data entry, production of statistics (including
16
provides a mechanism to export data to the statistical software programs SPSS,
SAS and STATA.
3.2 Study Population
The data for this study were obtained from standard DHS surveys for the years
2002 and 2007 for the Dominican Republic. There are three core questionnaires in DHS
surveys-- Household, Women, and Male. In all households, women age 15-49 are
eligible to participate and in many surveys men age 15-59 from a sub-sample are also
eligible to participate. Data from household surveys were used in this study. In 2002, the
sample size included 27,135 households, 23,384 women, and 2,833 men. In 2007, the
sample size included 32,431 households, 27,195 women, and 27,975 men. As stated
earlier, the data for this study were taken from the household survey data for which all of
the respondents were women.
3.3 Study measures
The dependent variable examined in this study is reported diarrhea in children
under five in the two weeks preceding the survey. In the household survey, respondents
were asked for each child under five years of age if that child had presented with diarrhea
within the last two weeks. The response were either yes, no, or don’t know with
individual responses for up to 6 children in the household under 5 five years of age. A
new variable was generated which categorized “don’t know” responses with “no”
responses.
The independent variables were drinking water source, sanitation (toilet facility
type), and type of place of residence (urban or rural). A new variable for drinking water
17
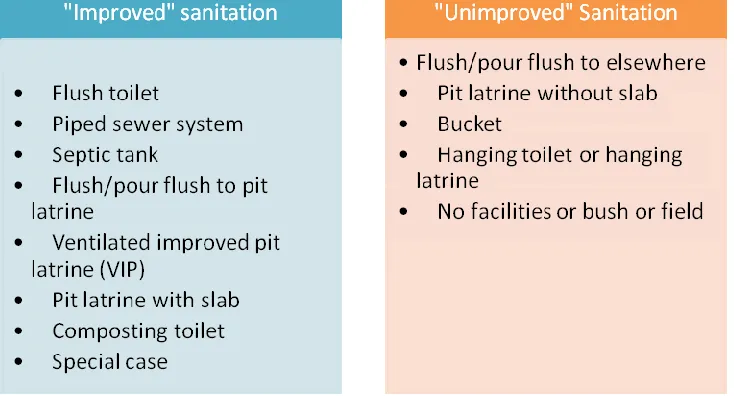
and all other sources. Sanitation was originally coded as toilet type, listing 6 different
types of toilet facilities along with options for no facility and other. A new sanitation
variable was created to make it a dichotomous variable by categorizing toilet facilities as
either improved or unimproved as described by JMP. Figure 3 illustrates the categories
[image:29.612.109.476.246.444.2]for sanitation.
Figure 3. Sanitation Categories. Source: WHO/UNICEF JMP
Other variables examined were age of respondents in five-year groups, highest education
level achieved, month of interview, province, and year of survey.
3.4 Data Analysis
Statistical analysis was conducted using STATA 8. Descriptive statistics were
generated to describe the study population. Distribution of water source was examined
across province and stratified by urban or rural type of place of residence. Proportion of
reported diarrhea in children under five was examined by water source, and the
proportion of toilet type in the overall cohort was examined.
Binary logistic regression analysis was performed to test the association between
18
intervals, and p-values were calculated using this analysis. A p-value of less than 0.05
was considered statistically significant.
A multivariate logistic regression analysis was performed to control for potential
confounding and examine the association between reported diarrhea in children under
five, water source, sanitation, and type of place of residence. Again, odds ratios, 95%
confidence intervals, and p-values were calculated with a p-value of less than 0.05
19
CHAPTER IV:
RESULTS
4.1 Descriptive Statistics
Socio-demographic Characteristics
The respondents in this study are all women because data from household surveys
was used, and only women were interviewed for household surveys. Their ages ranged
from 15 to 49. The largest proportion of respondents in a particular age group was in the
15-19 group. The average age of the respondents in 2002 and 2007 was between 29 and
30 (29.58; 29.49 in 2002 and 29.66 in 2007). The majority of respondents have at least a
primary level education. Also the majority of the respondents lived in urban areas. In the
Dominican Republic, urban is defined as population residing in communal and municipal
district capitals and rural is defined as population residing in areas other than communal
20
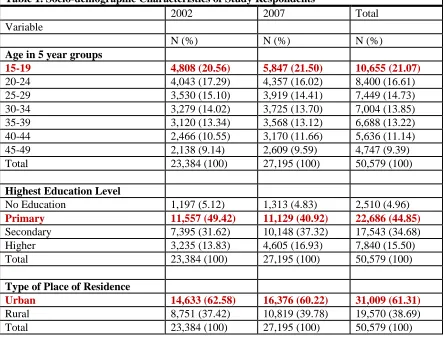
Table 1. Socio-demographic Characteristics of Study Respondents
2002 2007 Total
Variable
N (%) N (%) N (%)
Age in 5 year groups
15-19 4,808 (20.56) 5,847 (21.50) 10,655 (21.07)
20-24 4,043 (17.29) 4,357 (16.02) 8,400 (16.61)
25-29 3,530 (15.10) 3,919 (14.41) 7,449 (14.73)
30-34 3,279 (14.02) 3,725 (13.70) 7,004 (13.85)
35-39 3,120 (13.34) 3,568 (13.12) 6,688 (13.22)
40-44 2,466 (10.55) 3,170 (11.66) 5,636 (11.14)
45-49 2,138 (9.14) 2,609 (9.59) 4,747 (9.39)
Total 23,384 (100) 27,195 (100) 50,579 (100)
Highest Education Level
No Education 1,197 (5.12) 1,313 (4.83) 2,510 (4.96)
Primary 11,557 (49.42) 11,129 (40.92) 22,686 (44.85)
Secondary 7,395 (31.62) 10,148 (37.32) 17,543 (34.68) Higher 3,235 (13.83) 4,605 (16.93) 7,840 (15.50)
Total 23,384 (100) 27,195 (100) 50,579 (100)
Type of Place of Residence
Urban 14,633 (62.58) 16,376 (60.22) 31,009 (61.31)
Rural 8,751 (37.42) 10,819 (39.78) 19,570 (38.69)
Total 23,384 (100) 27,195 (100) 50,579 (100)
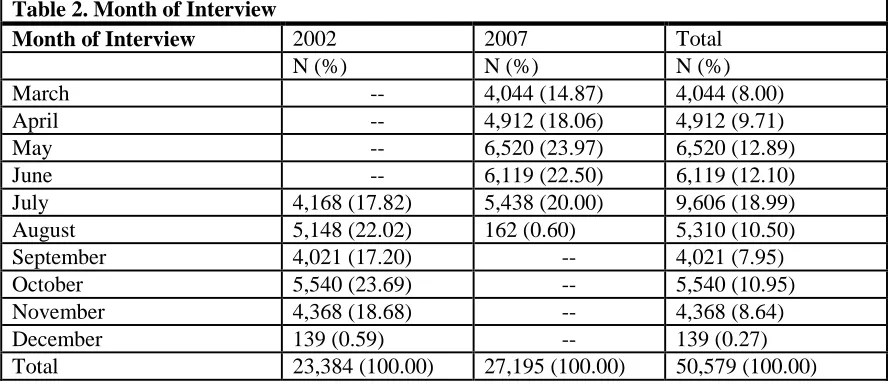
Month of Interview
The month of interview varied from 2002 to 2007 with January and February
being the only months in both years when no interviews were conducted. In 2002,
interviews took place from July to December. In 2007, interviews took place from March
21 Table 2. Month of Interview
Month of Interview 2002 2007 Total
N (%) N (%) N (%)
March -- 4,044 (14.87) 4,044 (8.00)
April -- 4,912 (18.06) 4,912 (9.71)
May -- 6,520 (23.97) 6,520 (12.89)
June -- 6,119 (22.50) 6,119 (12.10)
July 4,168 (17.82) 5,438 (20.00) 9,606 (18.99)
August 5,148 (22.02) 162 (0.60) 5,310 (10.50)
September 4,021 (17.20) -- 4,021 (7.95)
October 5,540 (23.69) -- 5,540 (10.95)
November 4,368 (18.68) -- 4,368 (8.64)
December 139 (0.59) -- 139 (0.27)
Total 23,384 (100.00) 27,195 (100.00) 50,579 (100.00)
Drinking Water Source and Place of Residence
Drinking water source was categorized into three groups, rainwater, bottled water,
and all other sources. Other sources included in the “all other sources” category included
piped into dwelling, piped into yard/lot, water from well, surface water, spring, river,
stream, tanker truck, and other for 2002. In 2007, sources included in the “all other
sources” category included piped into dwelling, piped into yard/plot, tube well or
borehole, river, dam, lakes, ponds, stream, canal, irrigation, tanker truck, cart with small
tank, and other. Table 3 shows proportion of drinking water sources. Rainwater was used
by fewer people over all, and the proportion of people using rainwater also decreased
from 9.88% in 2002 to 8.45% in 2007. In both years, bottled water is the single most used
source, and the proportion of people using bottled water increased from 44.92% in 2002
to 50.91% in 2007. The changes between 2002 and 2007 were shown to be statistically
22 Table 3. Proportion of Drinking Water Source
2002 2007 Total
N (%) N (%) N (%)
Rainwater 2,319 (9.88) 2,296 (8.45) 4,606 (9.11) Bottled Water 10,502 (44.92) 13,839 (50.91) 24,341 (48.14) All other Sources 10,566 (45.20) 11,048 (40.64) 21,614 (42.75)
Total 23,378 (100.00) 27, 183 (100.00) 50,561 (100.00)
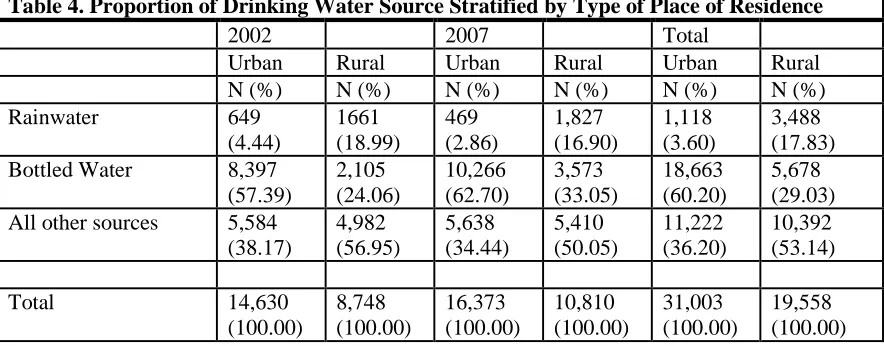
The majority of households which were using rainwater for drinking water were
located in rural areas as shown in table 4. Also, most households in urban areas used
bottled water for drinking water. As previously mentioned, the proportion of households
that reported using rainwater for drinking water decreased from 2002 to 2007. While
Table 4 displays the distribution of water source stratified by urban and rural, Appendix
A gives a more in depth view by specific province. The largest proportion of rainwater
[image:34.612.104.546.409.582.2]use in a single province was in the Salcedo Province.
Table 4. Proportion of Drinking Water Source Stratified by Type of Place of Residence
2002 2007 Total
Urban Rural Urban Rural Urban Rural N (%) N (%) N (%) N (%) N (%) N (%)
Rainwater 649 (4.44) 1661 (18.99) 469 (2.86) 1,827 (16.90) 1,118 (3.60) 3,488 (17.83) Bottled Water 8,397
(57.39) 2,105 (24.06) 10,266 (62.70) 3,573 (33.05) 18,663 (60.20) 5,678 (29.03) All other sources 5,584
(38.17) 4,982 (56.95) 5,638 (34.44) 5,410 (50.05) 11,222 (36.20) 10,392 (53.14) Total 14,630 (100.00) 8,748 (100.00) 16,373 (100.00) 10,810 (100.00) 31,003 (100.00) 19,558 (100.00)
Diarrhea in Children Under Five
Fifty-three percent (53%) of respondents reported no children in the household
under 5 years of age. The number of children under the age of 5, ranged from 0 to 7 for a
23
2002, 1.42 in 2007, and 1.46 in both years combined. The proportion of households
having children under 5 years of age that reported diarrhea in children under 5 was nearly
13% in both years combined as shown in table 5. The proportion of reported diarrhea in
children under 5 is very similar in 2002 and 2007 with proportion slightly decreasing
[image:35.612.104.546.234.346.2]from 2002 to 2007. A chi square test showed this change to be statistically insignificant.
Table 5. Proportion of households with children under 5 reporting recent diarrhea in children under 5
Recent Diarrhea in children under 5 2002 2007 Combined
N (%) N (%) N (%)
No 9,988 (87.00) 10,720 (87.15) 20,708 (87.08) Yes 1,492 (13.00) 1,580 (12.85) 3,072 (12.92)
Total Responses 11,480
(100.000
12,300 (100.00)
23,780 (100.00)
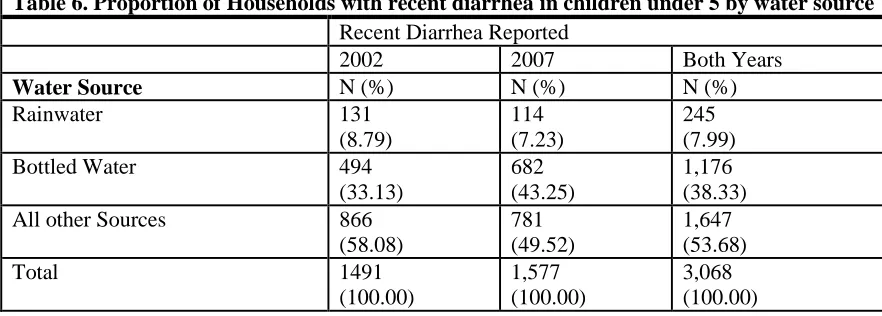
As illustrated in table 6, among the three drinking water source categories,
households that reported rainwater use had the smallest proportion of reported diarrhea in
children under 5. The proportion of reported diarrhea in children under 5 among
[image:35.612.102.543.489.647.2]households using rainwater decreased from 2002 to 2007.
Table 6. Proportion of Households with recent diarrhea in children under 5 by water source
Recent Diarrhea Reported
2002 2007 Both Years
Water Source N (%) N (%) N (%)
Rainwater 131 (8.79) 114 (7.23) 245 (7.99)
Bottled Water 494
(33.13)
682 (43.25)
1,176 (38.33)
All other Sources 866
(58.08) 781 (49.52) 1,647 (53.68) Total 1491 (100.00) 1,577 (100.00) 3,068 (100.00) Sanitation
Tables 7 and 8 illustrate the distribution of types of sanitation facilities. The
24
toilets decreased from about 23% in 2002 to just under 19% in 2007. A chi square test
showed that this change is statistically significant. A larger proportion of people had
access to improved sanitation facilities in urban areas than in rural areas. Conversely, the
proportion of unimproved sanitation facilities was greater in rural areas than in urban
[image:36.612.104.547.213.334.2]areas.
Table 7. Proportion of sanitation facilities by type
Sanitation 2002 2007 Both Years
N (%) N (%) N (%)
[image:36.612.101.548.385.536.2]Unimproved 5,366 (22.96) 5,052 (18.60) 10,418 (20.62) Improved 18,004 (77.04) 22,104 (81.40) 40, 108 (79.38) Total 23,370 (100.00) 27,156 (100.00) 50,526 (100.00)
Table 8. Sanitation facilities stratified by urban rural for 2002, 2007, and both years combined
2002 2007 Both
Years
Urban Rural Urban Rural Urban Rural
Sanitation N (%) N (%) N (%) N (%) N (%) N (%)
Unimproved 2,969 (20.30) 2,397 (27.41) 2,524 (15.44) 2,528 (23.39) 5,493 (17.73) 4,925 (25.19) Improved 11,655 (79.70) 6,349 (72.59) 13,826 (84.56) 8,278 (76.61) 25,481 (82.27) 14,627 (74.81) Total 14,624 (100.00) 8,746 100.00) 16,350 (100.00) 10,806 (100.00) 30,974 (100.00) 19,552 (100.00)
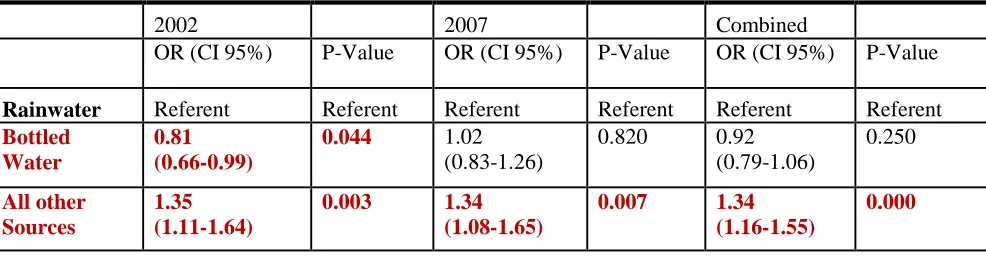
4.2 Logistic Regression Analyses
Logistic regression analyses were performed in STATA 8. A binary logistic
regression analysis was performed to examine the relationship between water source and
reported diarrhea in children under five in this cohort, and the results are displayed in
table 9. People who reported consuming bottled water in 2002 reported 0.81 times the
25
value of 0.044. This indicates a statistically significant decrease in odds of diarrhea in
children under 5 when bottled water was consumed as the drinking water source
compared to rainwater. However, people who reported using other sources (other than
bottled) were 1.35 times more likely to have reported diarrhea in children under 5 (95%
CI 1.11-1.164) compared to those who reported consuming rainwater in 2002. When
compared in 2007, a similar result was found. Those using other sources (other than
bottled) were 1.34 times more like to have reported diarrhea in children under 5 in 2007
(95% CI 1.08-1.65) compared to those using rainwater. This was also similar when both
[image:37.612.107.600.354.482.2]years were compared together as shown in Table 9.
Table 9. Binary logistic regression analysis: reported diarrhea in children under 5 and water source; rainwater is referent
2002 2007 Combined
OR (CI 95%) P-Value OR (CI 95%) P-Value OR (CI 95%) P-Value
Rainwater Referent Referent Referent Referent Referent Referent
Bottled Water 0.81 (0.66-0.99) 0.044 1.02 (0.83-1.26) 0.820 0.92 (0.79-1.06) 0.250 All other Sources 1.35 (1.11-1.64) 0.003 1.34 (1.08-1.65) 0.007 1.34 (1.16-1.55) 0.000
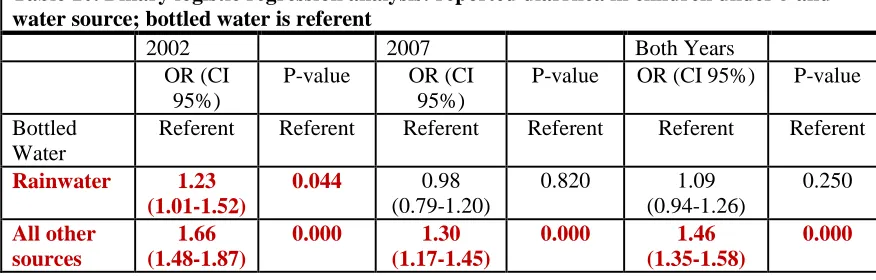
As shown in table 10, when bottled water is used as the referent group, the results
are similar to the previous analysis. People who consumed rainwater were 1.23 times
more likely to have diarrhea in children under 5 (95% CI 1.01-1.52) compared to bottled
water. This result is statistically significant. People who consumed all other sources of
water (except rainwater) in comparison to bottled water had increased risk for diarrhea in
children under 5 with 1.66 times the risk in 2002 (95% CI 1.48-1.87), 1.30 times the risk
in 2007 (95% CI 1.17-1.45), and 1.46 times the risk in both years (95% CI 1.35-1.58). All
26
Table 10. Binary logistic regression analysis: reported diarrhea in children under 5 and water source; bottled water is referent
2002 2007 Both Years
OR (CI 95%)
P-value OR (CI 95%)
P-value OR (CI 95%) P-value
Bottled Water
Referent Referent Referent Referent Referent Referent
Rainwater 1.23 (1.01-1.52)
0.044 0.98 (0.79-1.20)
0.820 1.09 (0.94-1.26) 0.250 All other sources 1.66 (1.48-1.87)
0.000 1.30 (1.17-1.45)
0.000 1.46
(1.35-1.58)
0.000
Stratifying this analysis across urban and rural residences, as shown in table 11,
demonstrated a statistically significant result only in comparison of all other sources
(except bottled water) with rainwater. As previously indicated all other sources (except
bottled water) present an increased risk for diarrhea in children under 5 when compared
to rainwater.
In urban areas in 2002, people who consumed all other sources of water
(excluding bottled water) were 1.57 times more likely to have diarrhea in children under
5 (95% CI 1.06-2.32) compared to people who consumed rainwater. In urban for both
years combined, people who consumed all other sources of water (excluding bottled
water) were 1.48 times more like to have diarrhea in children under 5 (95% CI
1.09-2.01).
In rural areas in 2007, people who consumed all other sources of water (excluding
bottled water) were 1.37 times more likely to have diarrhea in children under 5 (95% CI
1.08-1.74) compared to people who consumed rainwater. In rural areas in both years
combined, people who consumed all other sources of water (excluding bottled water)
were 1.31 times more likely to have diarrhea in children under 5 (95% CI 1.11-1.54) than
27 Table 11. Binary logistic regression analysis
2002 2007 Combined
Urban OR (CI 95%) P-value OR (CI 95%) P-value OR (CI 95%) P-value
Rainwater Referent Referent Referent Referent Referent Referent
Bottled Water 0.86 (0.58-1.27) 0.441 1.07 (0.66-1.73) 0.793 0.96 (0.71-1.30) 0.778 All Other Sources 1.57 (1.06-2.32) 0.024 1.39 (0.85-2.27) 0.184 1.48 (1.09-2.01) 0.012 Rural OR (CI 95%) p-value OR (CI 95%) p-value OR (CI 95%) p-value
Rainwater Referent Referent Referent Referent Referent Referent
Bottled Water 0.97 (0.74-1.29) 0.857 1.13 (0.88-1.47) 0.340 1.06 (0.88-1.28) 0.563 All Other Sources 1.25 (0.99-1.58) 0.063 1.37 (1.08-1.74) 0.010 1.31 (1.11-1.54) 0.002
Shown in Table 12 are the results of a multivariate logistic regression which tests
the relationship between water source and diarrhea in children under five while
controlling for place of residence (urban/rural) and sanitation. In this model the
consumption of rainwater presents decreased odds of diarrheal disease when compared
to all other water sources (excluding bottled water). In 2002, people who consumed all
other sources of water (excluding bottled) were 1.28 times more likely to have diarrhea in
children under 5 (95% CI 1.05-1.57) compared to those who consumed rainwater. In
2007, people who consumed all other sources of water (excluding bottled water) were
1.33 times more likely to have diarrhea in children under 5 (95% CI 1.08-1.65) compared
to those who consumed rainwater and 1.31 times more likely in both years (95% CI
1.13-1.51) to have diarrhea in children under 5 in those who consumed all other sources of
28
For sanitation facilities, people with improved sanitation facilities in 2002 were
0.49 times less likely to have diarrhea in children under 5 compared to those who had
unimproved sanitation facilities (95% CI 0.43-0.54). In 2007, people who were using
improved sanitation facilities were 0.64 times less likely to have diarrhea in children
under 5 than those who used unimproved sanitation facilities (95% CI 0.57-0.72). In both
years combined, people who used improved sanitation facilities were 0.56 less like to
[image:40.612.107.584.270.470.2]have diarrhea in children under 5 than (95% CI 0.51-0.61).
Table 12. Multivariate logistic regression analysis
2002 2007 Combined
OR (CI 95%) p-value OR (CI 95%) p-value OR (CI 95%) p-value
Rainwater Referent Referent Referent Refere
nt
Referent Referent
Bottle Water 0.87
(0.70-1.07) 0.190 1.14 (0.911-1.41) 0.257 1.01 (0.86-1.17) 0.950
29
CHAPTER V:
DISCUSSION AND CONCLUSION
5.1 Discussion
There are few studies in the existing literature examining health risks
associated with rainwater consumption, but the results of this study were consistent with
previous studies which have attempted to quantify health risks associated with rainwater
consumption and found decreased risk or no increased risk with consumption of
rainwater. However, the study designs vary, and there are many differences in the design
of this study and the studies reviewed in the existing literature.
Garret et al (2008) in their examination of diarrhea prevention in a high-risk rural
Kenyan population evaluated a program that included the implementation of a strategy
called Safe Water Systems (SWS)and promoted for latrine building, rainwater collection,
and shallow well construction. The SWS had 3 components: point-of-use water
disinfection with sodium hypochlorite, safe water storage, and behavior change
techniques. In their study, Garret et al conducted weekly diarrheal surveillance for an 8
week period from March to May in their study population. The results of the study
showed that chlorinating stored water, latrine use, and consumption of rainwater all
decreased risk of diarrhea. Garret et al study was very different from our study. First, no
primary data was collected in this study. Second, we did not include information about
30
if and what other improved water sources were in use other than rainwater
collection and shallow wells.
The study by Fry et al (2010) showed that rainwater harvesting could potentially
reduce diarrhea disease in West Africa. This study was very different from our study. The
study by Fry et al used engineering analysis (modeling) to make estimates of potential
reduction in diarrhea resulting from domestic rainwater harvesting. The study only
considered the quantity of water that would potentially be added to the region and not the
quality and assumed improved sanitation and hygiene with increased quantity of water.
While the study results showed promise of potentially reducing diarrheal disease burden
in West Africa by implementing more DRWH systems, it is difficult to compare these
study results with our study because of the design and the assumptions that were made
regarding diarrheal disease, sanitation, and hygiene.
Ahmed et al (2010) examined the health risk from use of roof-harvested rainwater
in Southeast Queensland, Australia. The study found that the pathogens they detected in
roof-harvested drinking water posed not health threats at the levels at which they were
detected. They also found that the pathogens detected in the roof-harvested rainwater for
nonpotable use also posed no health risks. This study by Ahmed et al was very different
from our study. The Ahmed et al study focused on the microbial quaility of the rainwater
samples and estimating risk from analysis of those samples. The researchers sampled
rainwater from 82 residences and tested it for 5 pathogens which may cause diarrheal
disease. They used QMRA to estimate health risk associated with exposure to those
pathogens. There were no measurements of actual levels of diarrheal disease occurring in
31
In their examination of consumption of untreated tank rainwater and
gastroenteritis in among young children in South Australia, Heyworth et al (2006) found
no increase in odds of gastroenteritis among children who drank rainwater compared with
treated mains water. This study was based on survey data which is one similarity between
their study and our study, but there are still many difference. The researchers followed
1016 4 to 6 year old children who drank rainwater or treated mains water. The children’s
parents kept daily diaries of their gastrointestinal symptoms and water consumption for 6
weeks. The first difference is that we did not collect primary data in our study as
previously mentioned. While the Heyworth et al study did observe diarrheal illness in
young children, the age group was between 4 and 6 and not children under the age of 5.
The study also only compared rainwater consumption with public treated mains water,
and there was no information regarding sanitation facilities.
Access to improved drinking water sources in the Dominican Republic is high
(JMP 2012). Bottled water accounts for the highest proportion of a specific water source
with 48% of respondents (in both years combined) in this study using bottled water as
their drinking water source. Considering the large proportion of the population using
bottled water, it may be necessary to develop more sustainable water resources in order to
maintain a high level of access in the future. Rainwater may be a viable alternative
source.
Studies in the existing literally found rainwater to be a viable option for an
alternative improved water source even in arid climates (Pandey et al 2003 & Cain 2010).
The climate in the Dominican Republic is humid. The rainy season occurs from May to
32
Temperature and wet seasons can vary from year to year due to El Niño and La Niña
episodes. Rainwater harvesting may be seasonal due to variation in rainfall at different
times of the year (UNDP 2012). In this study, the respondents from 2002 were
interviewed during the months July to December and in 2007 they were interviewed
during the months March to August. If rainwater harvesting is seasonal, it is difficult to
tell what affect that may have on this data set due to the distribution of month of
interview across both years. Also, seasonal rainwater harvesting could result in changing
main drinking water source in months where rainwater is scarce which may not give an
accurate estimate when a population is sampled and surveyed about who is using
rainwater. This could be a concern as recent estimates indicate that precipitation in the
Dominican Republic has decreased since 1960 at a rate of 5.0mm per month per decade
(UNDP 2012). Therefore, considerations must be made for rainfall variability when
harvested rainwater is the main drinking water source. These include providing large
catchment system, insuring proper storage and protection of harvested rainwater, and
promoting water conservation.
The majority of respondents in this cohort lived in urban areas, but the proportion
of rural dwelling respondents was still large. In 2002, the proportion of respondents who
lived in rural areas was 37% and increased to nearly 40% in 2007. For both 2002 and
2007 combined, 9.11% of people consumed rainwater as their main drinking water source
in this study population, and the majority of respondents who consumed rainwater lived
in rural areas. Access to water in developing nations is of particular concern in rural areas
because the access to improved water sources and basic sanitation tends to be lower than
33
true of the Dominican Republic. However, these estimates also show that as access to
improved water is increasing in rural areas, it is decreasing in urban areas. The decline in
improved water access appears to be mainly an issue for urban areas. 2012 JMP estimates
show that access to improved drinking water in urban areas of the Dominican Republic in
1990 was 98%, but dropped to 95% in 1995, 92% in 2000, 89% in 2005, and 87% in
2010. JMP estimates also show that from 2002 to 2007 the proportion of the urban
population increased from 63% to 67% (2012). The UN previously identified keeping up
with the growing demand for water as one challenge for water access in the future. It is
possible that as urban areas are growing in the Dominican Republic the country may be
experiencing difficulty in keeping up with the demand for improved water sources. This
further highlights the importance of exploring alternative resources that are more
sustainable on a long term basis. Perhaps urban areas could benefit more from rainwater
harvesting in the future, but previously stated, the majority of rainwater consumers in this
study lived in rural areas. More than half of the respondents who lived in the Salcedo
province (now Hermanas Mirabal) consumed rainwater as their main drinking water
source. Salcedo is the smallest province in the Dominican Republic. It is part of the
Cibao region in the northeast of the country and is largely rural (CTO, 2008).
5.2 Limitations of the Study
First, this study is limited by the data source itself. Cross-sectional data gives a
snap shot. We don’t know what the relationship between rainwater consumption and
diarrhea was prior to the snap shot and therefore while the change between 2002 and
2007 is statistically significant, there are limitations to the conclusions we can make
34
The data is also a secondary source, and because we did not collect it, the process
was not tailored to the needs of our study. This means that there may be information that
was not collected in the surveys which may have been pertinent in our examination.
There is no indication as to how the rainwater was being harvest. Different methods
could carry different risk. Not all consumers who harvest rainwater use roof collection
systems. Also it may be helpful to know if the rainwater was collected using a household
system or if there is perhaps a small community collection site. The purpose of seeking to
assess the risk of rainwater consumption is to encourage this practice if indeed harvest
rainwater is considered safe to consume. Having more detailed information as to the type
of catchment systems or collection practices that may be associated with more or less
risks may be helpful to researchers, in particular those seeking to develop and design
rainwater harvesting programs and systems.
While diarrhea is primarily a concern in children under 5 because of its high
morbidity and mortality in this age group, it may have been helpful to get an overall
picture of the burden of diarrheal disease. There were no questions that asked about
diarrhea in household members other than children under 5.
5.3 Recommendations
My first recommendations are to include questions about rainwater collection and
diarrhea in all household members. Perhaps there are more health risks associated with
different catchment systems or practices. Different methods of storage and transport of
water could also present risk for contamination, and could, therefore, present health risks
35
Perhaps future studies could address hygiene practices as water, sanitation, and
hygiene are integral in prevention of diarrheal disease. More studies are needed linking
rainwater quality with specific health risks. More studies are need in rainwater treatment
practices. Generally, more studies are needed to provide more evidence regarding the
health risks associated with rainwater consumption to the existing literature.
5.4 Conclusion
Although the MDG drinking water target has been met, there was still more than
one tenth of the global population relying on unimproved drinking water sources in 2010
(UNICEF and WHO 2012). Interest in rainwater harvesting has grown, particularly in
developing nations where cost effective and sustainable alternatives for water source are
needed. With gastrointestinal illness being an ever-present concern in areas where access
to improved water and sanitation facilities is limited, it is important to examine the
potential risk of illness from the various water sources. This will allow us to continue to
make strides towards providing safe drinking water and basic sanitation for all people.
This study found that rainwater consumption posed less risk of diarrheal disease in
children under five in the Dominican Republic in 2002 and 2007 than alternative water
sources with the exception of bottled water. Still, more studies are needed to provide
36 Appendix A
Distribution of Water Source by Province
2002 2007 Combined
Water Source Water Source Water Source
Province Rainwater Bottled
Water
All Other
Total Rainwater Bottled Water
All Other Total Rainwater Bottled Water All Other Sources
Total
Sources Sources
N (%) N (%) N (%) N (%) N (%) N (%) N (%) N (%) N (%) N (%) N (%) N (%)
Distrito Nacional 2 792 270 1,064 0 873 313 1,186 2 1665 583 2250
0.19% 74.44% 25.37% 100.00% 0.00% 73.61% 26.39% 100.00% 0.09% 74.00% 25.91% 100.00%
Azua 1 221 531 753 0 314 455 769 1 535 986 1522
0.13% 29.35% 70.52% 100.00% 0.00% 40.83% 59.17% 100.00% 0.07% 35.15% 64.78% 100.00%
Bahoruco 7 65 490 562 1 200 594 795 8 265 1084 1357
1.25% 11.56% 87.19% 100.00% 0.12% 25.16% 74.72% 100.00% 0.59% 19.53% 79.88% 100.00%
Barahona 14 150 518 682 6 212 561 779 20 362 1079 1461
2.05% 22.00% 75.95% 100.00% 0.77% 27.21% 72.02% 100.00% 1.37% 24.78% 73.85% 100.00%
Dajabón 11 130 458 599 6 225 490 721 17 355 948 1320
1.84% 21.70% 76.46% 100.00% 0.83% 31.21% 67.96% 100.00% 1.29% 26.89% 71.82% 100.00%
Duarte 242 445 227 914 255 521 204 980 497 966 431 1894
26.48% 48.69% 24.83% 100.00% 26.02% 53.16% 20.82% 100.00% 26.24% 51.00% 22.76% 100.00%
El Seibo 79 194 259 532 99 332 249 680 178 526 508 1212
14.85% 36.47% 48.68% 100.00% 14.56% 48.82% 36.62% 100.00% 14.69% 43.40% 41.91% 100.00%
Elías Piña 1 70 440 511 3 154 460 617 4 224 900 1128
0.20% 13.70% 86.10% 100.00% 0.49% 24.96% 74.55% 100.00% 0.35% 19.86% 79.79% 100.00%
Espaillat 141 264 324 729 142 415 260 817 283 679 584 1546
19.34% 36.21% 44.45% 100.00% 17.38% 50.80% 31.82% 100.00% 18.31% 43.92% 37.77% 100.00%
Hato Mayor 240 224 105 569 149 418 186 753 389 642 291 1322
37
Independencia 4 126 460 590 0 232 542 774 4 358 1002 1364
0.68% 21.35% 77.97% 100.00% 0.00% 29.97% 70.03% 100.00% 0.29% 26.25% 73.46% 100.00%
La Altagracia 55 456 109 620 48 551 77 676 103 1007 186 1296
8.87% 73.55% 17.58% 100.00% 7.10% 81.51% 11.39% 100.00% 7.95% 77.70% 14.35% 100.00%
La Romana 15 824 115 954 11 748 192 951 26 1572 307 1905
1.57% 86.37% 12.06% 100.00% 1.16% 78.65% 20.19% 100.00% 1.36% 82.52% 16.12% 100.00%
La Vega 187 307 410 904 196 478 368 1,042 383 785 778 1946
20.69% 33.96% 45.35% 100.00% 18.81% 45.87% 35.32% 100.00% 19.68% 40.34% 39.98% 100.00%
Maria Trinidad Sánche
230 261 100 591 280 328 154 762 510 589 254 1353
38.92% 44.16% 16.92% 100.00% 36.75% 43.04% 20.21% 100.00% 37.70% 43.53% 18.77% 100.00%
Monseñol Nouel 5 177 551 733 7 324 460 791 12 501 1011 1524
0.68% 24.15% 75.17% 100.00% 0.89% 40.96% 58.15% 100.00% 0.79% 32.87% 66.34% 100.00%
Monte Cristi 71 323 142 536 53 441 171 665 124 764 313 1201
13.25% 60.26% 26.49% 100.00% 7.97% 66.32% 25.71% 100.00% 10.32% 63.62% 26.06% 100.00%
Monte Plata 134 162 362 658 124 205 387 716 258 367 749 1374
20.36% 24.62% 55.02% 100.00% 17.32% 28.63% 54.05% 100.00% 18.78% 26.71% 54.51% 100.00%
Pedernales 4 117 437 558 17 225 428 670 21 342 865 1228
0.72% 20.97% 78.31% 100.00% 2.54% 33.58% 63.88% 100.00% 1.71% 27.85% 70.44% 100.00%
Peravia 8 355 432 795 3 435 338 776 11 790 770 1571
1.01% 44.65% 54.34% 100.00% 0.39% 56.06% 43.55% 100.00% 0.70% 50.29% 49.01% 100.00%
Puerto Plata 45 408 332 785 31 674 252 957 76 1082 584 1742
5.73% 51.97% 42.30% 100.00% 3.24% 70.43% 26.33% 100.00% 4.36% 62.12% 33.52% 100.00%
Salcedo 372 187 110 669 445 295 90 830 817 482 200 1499
55.61% 27.95% 16.44% 100.00% 53.62% 35.54% 10.84% 100.00% 54.50% 32.16% 13.34% 100.00%
Samaná 137 250 253 640 125 418 233 776 262 668 486 1416
21.41% 39.06% 39.53% 100.00% 16.11% 53.87% 30.02% 100.00% 18.50% 47.18% 34.32% 100.00%
San Cristóbal 81 600 442 1,123 59 592 586 1,237 140 1192 1028 2360