ScholarWorks @ Georgia State University
ScholarWorks @ Georgia State University
Computer Science Dissertations Department of Computer Science
Spring 5-5-2012
Innovative Algorithms and Evaluation Methods for Biological
Innovative Algorithms and Evaluation Methods for Biological
Motif Finding
Motif Finding
Wooyoung Kim
Follow this and additional works at: https://scholarworks.gsu.edu/cs_diss
Recommended Citation Recommended Citation
Kim, Wooyoung, "Innovative Algorithms and Evaluation Methods for Biological Motif Finding." Dissertation, Georgia State University, 2012.
https://scholarworks.gsu.edu/cs_diss/63
This Dissertation is brought to you for free and open access by the Department of Computer Science at
ScholarWorks @ Georgia State University. It has been accepted for inclusion in Computer Science Dissertations by an authorized administrator of ScholarWorks @ Georgia State University. For more information, please contact
FINDING
by
WOOYOUNG KIM
Under the Direction of Dr. Yi Pan
ABSTRACT
Biological motifs are defined as overly recurring sub-patterns in biological systems. Sequence
motifs and network motifs are the examples of biological motifs. Due to the wide range of
ap-plications, many algorithms and computational tools have been developed for efficient search for
biological motifs. Therefore, there are more computationally derived motifs than experimentally
validated motifs, and how to validate the biological significance of the ‘candidate motifs’ becomes
an important question. Some of sequence motifs are verified by their structural similarities or their
functional roles in DNA or protein sequences, and stored in databases. However, biological role of
network motifs is still invalidated and currently no databases exist for this purpose.
In this thesis, we focus not only on the computational efficiency but also on the biological
mean-ings of the motifs. We provide an efficient way to incorporate biological information with
clus-tering analysis methods: For example, a sparse nonnegative matrix factorization (SNMF) method
is used with Chou-Fasman parameters for the protein motif finding. Biological network motifs
Experimen-number of high-quality of biological motifs.
In addition, we apply biological network motifs for the discovery of essential proteins. Essential
proteins are defined as a minimum set of proteins which are vital for development to a fertile adult
and in a cellular life in an organism. We design a new centrality algorithm with biological network
motifs, named MCGO, and score proteins in a protein-protein interaction (PPI) network to find
essential proteins. MCGO is also combined with other centrality measures to predict essential
proteins using machine learning techniques.
We have three contributions to the study of biological motifs through this thesis; 1) Clustering
analysis is efficiently used in this work and biological information is easily integrated with the
analysis; 2) We focus more on the biological meanings of motifs by adding biological knowledge
in the algorithms and by suggesting biologically related evaluation methods. 3) Biological network
motifs are successfully applied to a practical application of prediction of essential proteins.
FINDING
by
WOOYOUNG KIM
A Dissertation Submitted in Partial Fulfillment of the Requirements for the Degree of
Doctor of Philosophy
in the College of Arts and Sciences
Georgia State University
FINDING
by
WOOYOUNG KIM
Committee Chair: Dr. Yi Pan
Committee: Dr. Raj Sunderraman
Dr. Alex Zelikovsky
Dr. Dr. Yichuan Zhao
Electronic Version Approved:
Office of Graduate Studies
College of Arts and Sciences
Georgia State University
ACKNOWLEDGEMENTS
This dissertation would have not been possible without supports of many persons. First of all, I
am greatly thankful to my advisor, Prof. Yi Pan for providing a challenging and exciting topic of
this dissertation, but also for his supervise and encouragement. I also want to express my profound
acknowledgements to Dr. Min Li and Dr. Jianxin Wang who gave excellent advise and guided my
work to the right direction. It is also a pleasure to thank Prof. Haesun Park for her great support
on the start of the research with her novel algorithm of sparse nonnegative matrix factorization.
Special thanks also go to Dr. Bernard Chen and Mr. Jingu Kim for their helps on various aspects
including data collection and design of algorithms.
I also would like to thank my committee, Prof. Raj Sunderraman, Prof. Alex Zelikovsky and Prof.
Yichuan Zhao for the valuable suggestions and all the supports.
Last, but not least, I thank my family; my parents, mother-in-law, husband and my precious two
girls for their love and all the supports. Especially, I am deeply grateful for my husband’s infinite
TABLE OF CONTENTS
ACKNOWLEDGEMENTS . . . iv
LIST OF TABLES . . . ix
LIST OF FIGURES . . . xiii
LIST OF ABBREVIATIONS . . . xxi
Chapter 1 INTRODUCTION . . . 1
1.1 Motivation . . . 1
1.2 The Approaches . . . 4
1.3 Contribution . . . 6
1.4 Dissertation Road Map . . . 7
Chapter 2 LITERATURE REVIEW . . . 8
2.1 Biological Motif . . . 8
2.1.1 Sequence Motif . . . 9
2.1.2 Network Motif . . . 17
2.2 Biological Network . . . 30
2.2.1 Types of Biological Networks . . . 30
2.2.2 Network Property . . . 35
2.2.3 Challenges . . . 36
2.3 Granular Computing . . . 36
2.3.1 Data Clustering Algorithms . . . 36
2.3.2 Network Clustering . . . 40
3.1 Background . . . 49
3.2 Problem Statement . . . 50
3.3 Methods . . . 51
3.3.1 Related Works . . . 52
3.3.2 New Approaches . . . 53
3.3.3 Evaluation Methods . . . 57
3.4 Result and Discussion . . . 58
3.4.1 Data set and data representation . . . 59
3.4.2 Experiment steps . . . 60
3.4.3 Clustering Results . . . 60
3.4.4 Sequence Motifs . . . 63
3.5 Summary and Future Work . . . 63
Chapter 4 ALGORITHMS AND EVALUATION METHODS FOR BIOLOGI-CAL NETWORK MOTIF . . . 70
4.1 Background . . . 70
4.2 Problem Statement . . . 72
4.3 Methods . . . 72
4.3.1 Definitions . . . 73
4.3.2 Algorithms . . . 74
4.3.3 Evaluation Methods . . . 83
4.4 Result and Discussion . . . 85
4.5 Summary and Future Work . . . 90
Chapter 5 ESSENTIAL PROTEIN DISCOVERY IN A PPI NETWORK US-ING NETWORK MOTIF AND GENE ONTOLOGY . . . . 95
5.1 Background . . . 95
5.2 Problem Statement . . . 96
5.3.1 Algorithms . . . 97
5.3.2 Evaluation Methods . . . 103
5.4 Results and Discussion . . . 106
5.4.1 Experimental data . . . 106
5.4.2 Evaluation by three evaluation measures . . . 107
5.4.3 Effects of EDGEGO . . . 108
5.4.4 Analysis of MC and MCGO . . . 109
5.5 Summary and Future Work . . . 110
Chapter 6 MODEL-DRIVEN APPROACH TO PREDICTING ESSENTIAL PROTEINS IN A PPI NETWORK . . . 117
6.1 Background . . . 117
6.2 Problem Statement . . . 118
6.3 Methods . . . 119
6.3.1 Algorithms . . . 119
6.3.2 Evaluation Methods . . . 123
6.4 Results and Discussion . . . 126
6.4.1 Data sets and features . . . 126
6.4.2 Comparison of the balanced data sets . . . 126
6.4.3 CENT-GO and CENT-ING-GO . . . 128
6.4.4 Prediction based on different classifiers . . . 129
6.4.5 Analysis on each centrality measure . . . 131
6.5 Summary and Future Works . . . 133
Chapter 7 CONCLUSIONS . . . 139
7.1 Conclusions . . . 139
7.2 Future Work . . . 142
APPENDICES . . . 178
Appendix A NMF AND BMF . . . 178
A.1 Nonnegative Matrix Factorization . . . 178
A.2 Sparse Nonnegative Matrix Factorization . . . 180
A.3 Bounded Matrix Factorization . . . 181
A.3.1 Two Block Coordinate Descent Framework for BMF . . . 182
A.3.2 BLS based on the Active Set method . . . 183
A.3.3 Fast Combinatorial Bounded Least Squares . . . 186
Appendix B PARALLEL NETWORK MOTIF SEARCH . . . 191
B.1 Parallel search of network motifs . . . 191
B.1.1 Recover Subgraphs from Removed Edges . . . 191
LIST OF TABLES
Table 2.1: Number of Non-isomorphic Subgraphs for undirected and directed graphs
with up to 10 vertices [1] . . . 22
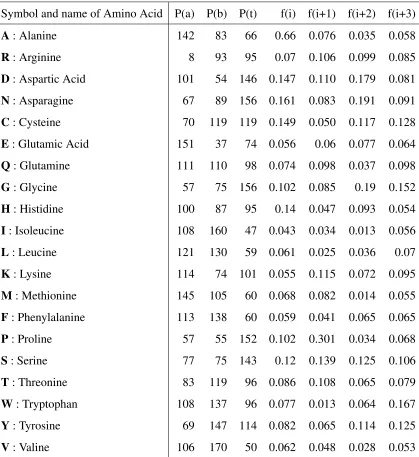
Table 3.1: Chou-Fasman parameter . . . 68
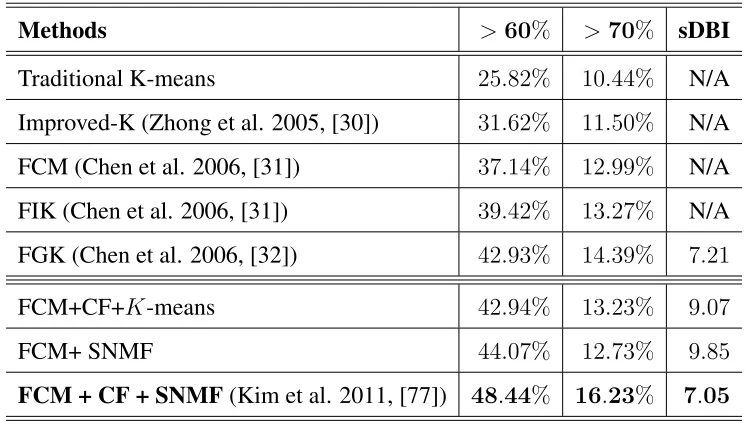
Table 3.2: Comparison of various clustering methods . . . 69
Table 4.1: Various algorithms used for the detection of biological network motifs: All
the algorithms introduced in this work are compared based on the type, the
time before enumeration by ESU, parameter and its deterministic property.
Heredis GO depth threshold,lis the number of GO terms associated to the graphG, cis the number of clusters, ris the number of edges to remove, andη, β for sparse NMF computation. . . 83
Table 4.2: Results of 4-node biological network motifs in theDIP Corenetwork: We can see that EDGEBETWEENNESS-BNM performs best in ‘motif included
in complex’ measure while EDGEGO-BNM performs best in other
mea-sures. . . 87
Table 4.3: Results of 5-node biological network motifs in theDIP Corenetwork: We can see that EDGEBETWEENNESS-BNM performs best in ‘motif included
in complex’ measure while EDGEGO-BNM performs best in other
Table 4.4: Results of 4-node biological network motifs in the Y2knetwork: We can see that EDGEBETWEENNESS-BNM performs best in ‘motif included in
complex’ measure. NMFGO-BNMperforms best on ‘MF’ and ‘CC
cluster-ing score’ measures. EDGEGO-BNM performs best in the ‘motif included
in functional module’ measure ‘BP, CC clustering score’ measures.
How-ever all the algorithms perform poorly in ‘MF clustering score’ measure,
with less than30. . . 88
Table 4.5: Results of 5-node biological network motifs in the Y2k network: We can see that EDGEBETWEENNESS-BNM performs best in ‘motif included
in complex’ measure while EDGEGO-BNM performs best in other
mea-sures. . . 89
Table 4.6: Y2k statistical properties, from FANMOD: Each type of 4-node subgraph
shows its significance based on its structural uniqueness. The label is
gen-erated by Nauty program [2] and the corresponding shape is shown in Figure 4.3. In this network, the first three types are detected as network
motifs. . . 89
Table 4.7: Y2k reduced network by EDGEGO-BNMstatistical properties, from
FAN-MOD: Each type of 4-node subgraph shows its significance based on its
structural uniqueness. The label is generated by Nauty program [2] and the corresponding shape is shown in Figure 4.3. In this network, the first
Table 4.8: The rates of motifs included in a ‘rRNA processing’ functional module in
the yeast (Y2k network), computed using Equation (5.18): Except ESU,
all algorithms search30%of subgraphs in the original network. However,
EDGEGO-BNM recovers over90%of motifs included in functional
mod-ule. We note that the non-motif types of Cr, CF and CR have a number
of instances for this functional match, indicating structural uniqueness is
insufficient to discover its biological significance. . . 91
Table 5.1: Confusion matrix or contingency table . . . 112
Table 5.2: Area under curve (AUC) value for each PR curve . . . 112
Table 6.1: Comparison of balanced data sets: To verify that all the 10 data sets are
statistically similar, we run a meta classifier to each data set and obtain an
AUC-ROC value. We verified that all the data sets are statistically similar
through Mann-Whitney U-statistics test with their AUC-ROC values. . 127
Table 6.2: Statistical Significant of the set of integrated features: Each set of features
was assessed based on its statistical significance. We can observe that when
we run a classifier to the set of integrated features (CENT-ING-GO), the
performance improves significantly. . . 130
Table 6.3: The performances of CENT-GO, ING-GO and the combined of the two,
CENT-ING-GO are compared with their area under ROC (AUC-ROC),
area under PR (AUC-PR), accuracy (ACC) and time (T). CENT-GO and
ING-GO have slight variations, but integration of them, CENT-ING-GO,
Table 6.4: Comparison of classifiers: The CENT-ING-GO feature set is performed
with 2 different classifiers and the performances are compared based on
AUC-ROC, AUC-PR, ACC and T measures. “Classifier by Kim et al.,
2012” performs better than “Classifier by Acencio and Lemke, 2009.” . 132
Table 6.5: Statistical Significance of each feature: Each feature was assessed based
on its statistical significance. The performance improvement of CENT-GO
is statistically verified as all the p-values, compared with each measure, are
less than0.05. . . 135
Table 6.6: Comparison of each measure: The experiment with CENT-GO is
com-pared with the experiment with a single feature each. The performances
LIST OF FIGURES
Figure 2.1: An example of position weight matrix (PWM) representation for a
se-quence motif of length six. Profiles are variations of PWM. . . 11
Figure 2.2: An example of profile HMMs, from the paper [3]. A DNA motif at the top
can be converted into a profile HMM at the bottom. . . 12
Figure 2.3: An example of a sequence logo, from the paper [4]. . . 13
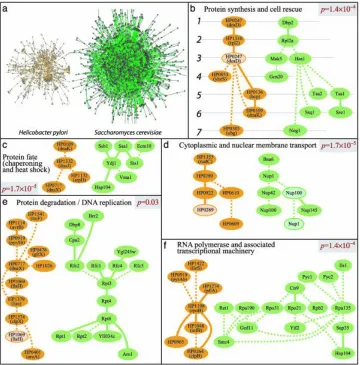
Figure 2.4: Top-scoring pathway alignments between bacteria and yeast. (a) The
protein-protein interaction networks of H. pylori and S. cerevisiae were globally aligned to reveal conserved network regions through b-f
pro-cesses. This figure is from [5]. . . 19
Figure 2.5: Outline of the Graemlin algorithm, by the courtesy of [6]. (A) Four
net-works with their phylogenetic relationships. (B) Graemlin first performs
a pairwise alignment of the two closest species, using d-cluster and a pair
of seeds. (C) Graemlin extends the seed using a greedy algorithm. (D)
Graemlin transforms the resulting alignment and the unaligned nodes into
three generalized networks for use in the next step. (E) In the next step,
Graemlin will perform three pairwise alignments, one for each of the newly
created generalized network. . . 42
Figure 2.6: A query networkg and a target networkGare given in the left-side hand. The resulting graph G0 is constructed in the right hand side, using Path-Match algorithm. Dashed lines show vertex correspondences and≡inG0 means the representing vertex in G. In this example, at most one mis-matches or indels are allowed between two mis-matches. Figure is from the
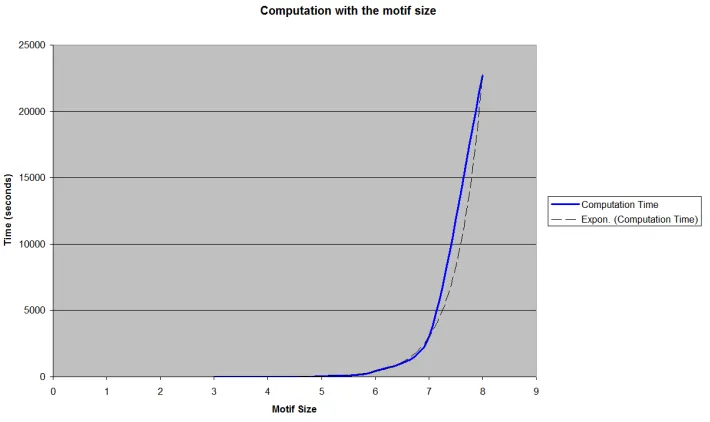
Figure 2.7: Subgraph search time increases rapidly as the motif size increases. The
horizontal axis is the size of motifs and the vertical axis is the time
con-sumed for the search. The dashed line is an exponential curve to show a
trend of search time based on the size of motifs. . . 43
Figure 2.8: Subgraph search time increases rapidly as the size of a network increases.
The horizontal axis is the number of edges and the vertical axis is the time
consumed for the search. The dashed line is a polynomial curve to show a
trend of search time based on the size of a network. . . 44
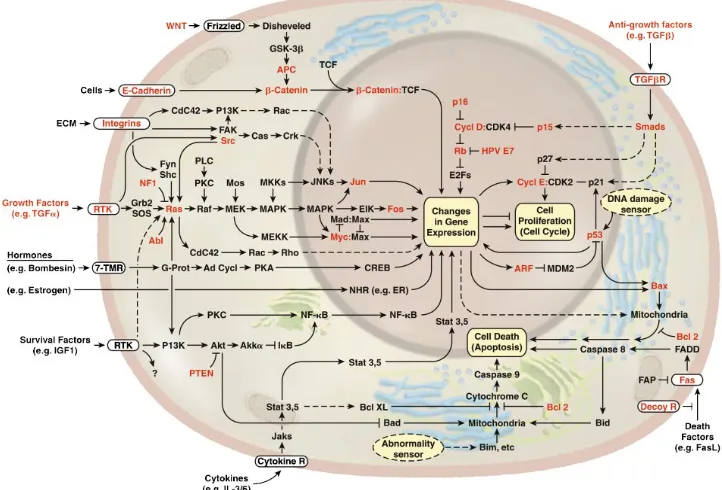
Figure 2.9: The emergent integrated gene regulation network representing the cell
progress in a mammalian cell. The signaling pathway has begun to lay
out a circuitry that will likely mimic electronic integrated circuits in
com-plexity and finesse. Gene expression process has much overlap regions
with signaling pathways. The figure is from [8]. . . 44
Figure 2.10: Overview of signaling pathways in the baker’s yeast S. cerevisiae. The activated receptor activates intracellular processes. The figure is from [9]. 45
Figure 2.11: Transcription regulatory network in yeast. The figure is from [10]. . . . 46
Figure 2.12: Example view for a metabolic network. The figure is from [11]. . . 47
Figure 2.13: An example view of a protein-protein interaction network . . . 48
Figure 3.1: The top image is the coefficient matrix whenk = 3 and bottom image is the coefficient matrix whenk = 45. They-axis represents the number of clusters and thex-axis is the data point. For a specific data shown as a red vertical box, the assignment of the top matrix is clearer than the bottom
matrix, as the second row clearly beats the others. The bottom coefficient
matrix has more than7non-zero values holding around10%of the weight
each, making a proper assignment difficult. . . 55
Figure 3.2: A number of protein sequences in a protein family obtained from PDB server are aligned on the left. According to the frequencies of twenty amino acids represented as one-letter codes, the proteins are expressed as a profile data on the right figure. Sliding a window of length 9, the20×9 matrix shown inside the red box represents one protein segment data for-mat. . . 60
Figure 3.3: This figure summarizes the experiment steps in this study. The original data set of a primary sequence is divided into smaller subsets (information granules) with double applications of FCM. For each subset, secondary structure information is inferred with Chou-Fasman parameters and added to each data set. SNMF is finally applied to each subset and the result is evaluated using two evaluation criteria, secondary structure similarity and sDBI. . . 61
Figure 3.4: Helices motif with conserved A . . . 64
Figure 3.5: Helix-Turn motif . . . 65
Figure 3.6: Turn-Sheet motif . . . 66
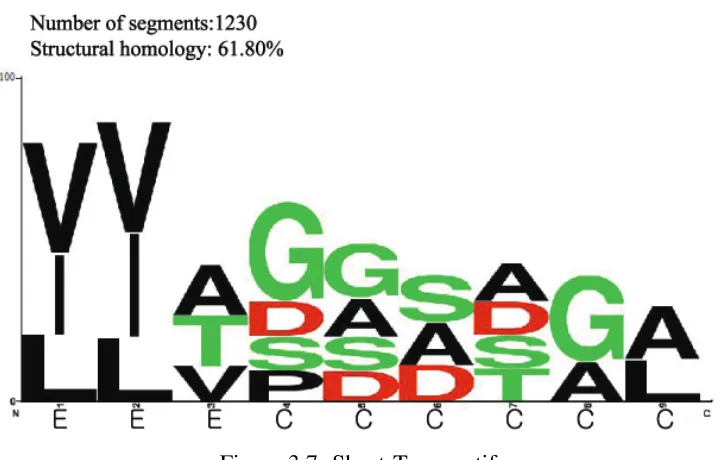
Figure 3.7: Sheet-Turn motif . . . 67
Figure 4.1: After modifying the graph: Original network (left) and the modified
net-work (right) after removing edges or clustering the graph. As shown in
the right hand side, a number of clusters and a list of removed edges are
provided as a result. . . 75
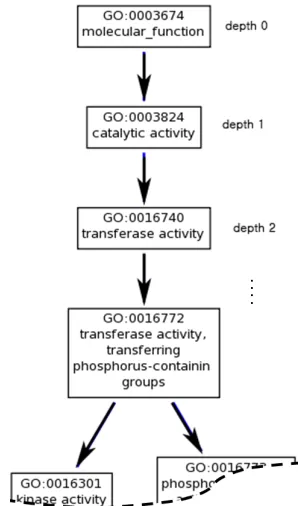
Figure 4.2: An example of GO graph view (GO DAG), where the root node is depth
0. If a GO is depth 0, then it is the most general term, meaning most of
genes or proteins are annotated with this GO term. As the depth of the GO
increases, the information of GO gets specific. . . 77
Figure 4.3: Shapes and labels for 4-node subgraphs in an undirected network: There
are six types for 4-node subgraphs in an undirected network. Each type is
labeled byNautyprogram. . . 90
Figure 4.4: DIP Core network: Search ratios based on the subgraph type: The ratio
of frequency of each type is relatively preserved and it indicates that our
algorithms can be used for the structural network motif discovery as well.
Relative frequencies of each algorithm is plotted with different colors of
line. The horizontal axis indicates each subgraph type for 4-node
sub-graphs. The vertical axis shows the relative frequency of each type. The
values are shown in the table below the figure. . . 92
Figure 4.5: Y2k network: Search ratios based on the subgraph type: The ratio of
fre-quency of each type is relatively preserved and it indicates that our
algo-rithms can be used for the structural network motif discovery as well. The
Figure 5.1: The top graph is an original network. If we remove A, then the graph is
separated into two subgraphs as shown in the bottom-left side. However, if
we remove B or C, the graph is nearly scattered as appeared in the
bottom-right side. Therefore, a central node is not deterministic. The graph is
captured from [13]. . . 99
Figure 5.2: TR proportion: Each bar indicates the performance result of DC, BC, CC,
SC, EC, SoECC, LAC, MC and MCGO from the left to right. . . 108
Figure 5.3: Statistical measures including SN, SP, PPV, NPV, F and ACC: Each bar
indicates the performance result of DC, BC, CC, SC, EC, SoECC, LAC,
MC and MCGO from the left to right. . . 109
Figure 5.4: PR curves: MCGO is at the most upper-right-hand side indicating as the
best algorithm. . . 110
Figure 5.5: TR proportion: Each bar indicates the performance result of DC, DCGO,
SoECC, SoECCGO, LAC, and LACGO from the left. . . 111
Figure 5.6: Statistical measures: Each bar indicates the performance result of DC,
DCGO, SoECC, SoECCGO, LAC, and LACGO from the left. . . 112
Figure 5.7: PR curves: Each-GOalgorithm is better than its original algorithm. . . 113
Figure 5.8: TR proportion: Each bar indicates the performance result of BC, BCGO,
CC, CCGO, SC, SCGO, EC and ECGO from the left. . . 113
Figure 5.9: Statistical measures: Each bar indicates the performance result of BC,
BCGO, CC, CCGO, SC, SCGO, EC and ECGO from the left. . . 114
Figure 5.10: PR curves: Each-GOalgorithm is better than its original algorithm. . . 114
Figure 5.11: TR proportion: Each bar indicates DCGO, BCGO, CCGO, SCGO, ECGO,
Figure 5.12: Statistical measures: Each bar indicates DCGO, BCGO, CCGO, SCGO,
ECGO, SoECCGO, LACGO and MCGO from the left. . . 115
Figure 5.13: PR curves: The curve of MCGO is at the most upper-right-hand side. . 116
Figure 5.14: The graphical view generated from the MINT web site [14] for ALG1 and
their neighbor nodes. (b) shows the extended nodes which are neighbors
of WBP1 in (a). . . 116
Figure 6.1: The process of CENT-GO extraction based on centrality measures from
GO-pruned PPI network: In the left, an yeast PPI network is pruned with
EDGEGO algorithm, where 14,925 interactions are removed out of 37,209
interactions total. For each vertex, eight centrality measures are calculated
from the GO-pruned PPI, each of which is a feature of the protein node.
The imbalanced data set is under-sampled to form a balanced data set. . 122
Figure 6.2: The process of ING-GO extraction based on an integrated network and
BP GO and CC GO terms: An yeast PPI, transcriptional regulatory and
metabolic network is integrated into an integrated (INGI) network. 12
topological features are extracted from this INGI and 11 features are
ob-tained from biological process and cellular localization GO terms. Each
protein consists of 23 features and a balanced data set is also obtained with
undersampling. . . 123
Figure 6.3: Classifier by Kim et al, 2012: 7 decision-tree based algorithms, a support vector machine (SVM) and neural network method, to each of which
‘bag-ging’ is applied for variance reduce, are combined into a meta-classifier. 124
Figure 6.4: Classifier by Acencio and Lemke, 2009: 8 decision-tree based algorithms to each of which ‘bagging’ is applied for variance reduce, are combined
Figure 6.5: ROC curves of the ten balanced data sets with CENT-ING-GO features:
All 10 data sets have similar performances. . . 128
Figure 6.6: ROC curves for individual feature sets and CENT-GO: The prediction with
CENT-GO performs significantly better than with each individual measure.
We also notice that DCGO, MCGO, LACGO, and SoECCGO shows
rela-tively good scores which are characterized as local features. . . 129
Figure 6.7: PR curves for individual feature sets and CENT-GO: The prediction with
CENT-GO performs significantly better than with each individual
mea-sure. We also notice that DCGO, MCGO, LACGO, and SoECCGO show
relatively good scores which are characterized as local features. . . 130
Figure 6.8: ROC curves of ING-GO (Kim et al, 2012), CENT-GO (Acencio and
Lemke, 2009) and the CENT-ING-GO (CENT-GO + ING-GO): The
pre-diction performance improves significantly with the integral of the two sets
of features. . . 131
Figure 6.9: PR curves of ING-GO (Kim et al, 2012), CENT-GO (Acencio and Lemke,
2009) and the CENT-ING-GO (CENT-GO + ING-GO): The prediction
performance improves significantly with the integral of the two sets of
fea-tures. . . 132
Figure 6.10: ROC curves for the two classifiers are provided. Classifier by Kim et al.,
2012 is slightly better than Classifier by Acencio and Lemke, 2009. . . 133
Figure 6.11: PR curves for the two classifiers are provided. Classifier by Kim et al.,
Figure 6.12: Decision tree on the balanced dataset5 with CENT-GO features with 64
instances per leaf: The data set contains only CENT-GO features and the
tree algorithm generate a rule where “MCGO” as a root. The values are
normalized before running the algorithm, and it produces 72% of
accu-racy and the area under ROC is.734. The eclipses are the features and in this set, “MCGO” and “ECGO” are likely to determine the essentiality of
proteins. . . 137
Figure 6.13: Decision tree on the balanced dataset5 with combined features of
CENT-ING-GO with 64 instances per leaf: The data set contains 31 features and
the tree algorithm generate a rule where “MCGO” as a root. The values are
normalized before running the algorithm, and it produces73%of accuracy
and the area under ROC is .752. The eclipses are the features and in this set, “MCGO” and “ECGO”, “clustering coefficient (c)”, “nucleus” and
“endoplasmic reticulum (er)” are likely to determine the essentiality of
proteins. . . 138
Figure B.1: An example network G = (V, E)with |V| = 16,|E| = 19. This is an original network. . . 195
Figure B.2: After applying a clustering algorithm to the original network of Figure B.1.
Four edges are removed as a result. . . 196
Figure B.3: The process of recovering missing subgraphs from removed edges of
Fig-ure B.2 . . . 196
Figure B.4: After clustering, some clusters are isomorphic. For example, we obtain
three clusters with this type of subgraph after clustering. . . 197
LIST OF ABBREVIATIONS
• NMF - Nonnegative Matrix Factorization
• BMF - Bounded Matrix Factorization
• SNMF - Sparse NMF
• PPI - Protein-Protein Interaction
• GO - Gene Ontology
• BNM - Biological Network Motif
• TRN - Transcriptional Regulatory Network
• BP - Biological Process
• MF - Molecular Function
• CC - Cellular Component
• DC - Degree Centrality
• BC - Betweenness Centrality
• CC- Closeness Centrality
• SC- Subgraph Centrality
• EC- Eigenvector Centrality
• SoECC- Sum of Edge Clustering Coefficient
• LAC-Local Average Connectivity
• ROC- Receiver Operating Characteristic
• AUC- Area Under Curve
• PR - Precision Recall
• ACC- Accuracy
• TP - True positive
• FP - False positive
• TN - True negative
• FN - False negative
• SVM- Support Vector Machine
• NN- Neural Network
• NNLS - Nonnegative Least Square
• BLS - Bounded Least Square
• LSI - Least Squares with Inequality constraints
• LSE - Least Square Equality
• CSSLS - Combinatorial Subspace Least Squares
• MPI - Message Passing Interface
• LRE - List of Removed Edges
• RSRE - Recover Subgraphs from Removed Edges
Chapter 1
INTRODUCTION
1.1 Motivation
Biological motifs include sequence motifs and network motifs. Sequence motifs are short
substrings in DNA or in proteins that seem to occur more often than usual. On the other hand,
network motifs are subgraph patterns that occur frequently and uniquely in a network. Based
on this definition, network motifs are not limited to biological networks only, but can be applied
to any other networks. Network motifs are used to appreciate the structures of networks locally
and, surprisingly, in most cases the networks seem to be largely composed of these small connected
network motifs. Uri Alon et al. [16] used network motifs to describe functional building blocks in a
gene regulation network, followed by many applications of network motifs in biological networks.
In proteins, sequence motifs are discovered when a collection of diverse proteins share a
com-mon function or structure in a few comcom-mon residues. If the proteins are enzymes, the motifs are
involved in the chemical catalysis in the active site. Meanwhile, biological significance of
net-work motifs in a protein-protein interaction (PPI) netnet-works is unclear yet. Biological functions of
network motifs with small size have been studied mostly in gene regulation networks. Gene
regu-lation networks control the gene expression in response to biological signals in the cell, therefore
network motifs are defined as patterns of gene regulation. However, usages of network motifs in
PPI are limited to a few applications such as the relationship to evolutionary conservation or the
prediction of protein interactions. Still, the use of network motifs in PPI is focused more on their
structural properties than on biological functions.
Network motifs are developed to describe local properties of a network, with the advent of
other local computing algorithms including network clustering, network alignment and network
querying. The resulting sub-networks by network clustering can reveal specific local properties in
have been developed to deal with enormous data to discover a number of ‘intrinsic’ similarities in
clusters and ‘hidden’ difference between the clusters. Network clustering is an unsupervised
clas-sification as there is no prior clasclas-sification criteria, and an unsupervised non-predictive learning as
there is no trained characterization. Network alignment and network querying are also related with
network motifs, but their processes involve testing of biological similarities unlike network motifs.
Network motifs are unique among these local analyses in some extents as they are defined by their
topological properties only. As the search involves high computational challenges, computational
efficiency has the highest priority in most of motif search algorithms. There were exact counting
algorithms and approximation search algorithms.
Exhaustive recursive search (ERS) [16], enumerate subgraphs (ESU) [15] and compact
topo-logical motifs [17] are exact counting algorithms. However, because of the high computing
de-mands for exact counting, several approximation algorithms have been provided including search
based sampling (MFinder) [16]), randomized ESU (Rand-ESU) [18]) and NeMoFinder [19].
Al-though these approximation algorithms are feasible, false detection is highly possible. Therefore,
parallel algorithms have been developed for feasible exact counting of network motifs [20, 21].
There are many biological applications of network motifs as well. Network motifs were
initially introduced as functional building blocks in transcriptional regulatory networks [16, 22].
Distinct network motifs have provided information about typical patterns in different types of
bi-ological networks. Przulj et al. [23] used network motifs as a relative graphlet frequency distance
to compare various protein-protein interaction networks. Also motif frequencies are exploited as
classifiers for network model selection [24]. Milo et al. [25] studied that networks of different
biological and technological domains have been classified into different superfamilies on the bases
of motif significance profiles. Albert et al. [26] used network motifs successfully to predict protein
interactions. Network motifs are closely related to evolutionary conservation as well. In the study
by Conant and Wagner [27], network motifs in transcriptional regulatory networks are not
evolu-tionary conserved while network motifs in PPI networks are evoluevolu-tionary related. From this work,
it is concluded that groups of proteins are more evolutionary conserved than individual protein. On
specific functional property. The number of motif modes in the study [28] reaches up to a million,
which differentiated various evolutionary constraints. The motifs founded by LaMoFinder
algo-rithm [29] are similar to motif modes in a sense that they have topological and biological properties
as well. In LaMoFinder, network motifs are labeled according to the border informative functional
class (FC) of gene ontology (GO) terms. Border informative FC-GO terms are GO terms which
have at least30directly annotated proteins and their parents GO terms have less than 30 annotated
proteins. The labeling process involves a clustering task with informative FC-GO terms being
features for each network motif.
Through a number of network motif algorithms and applications in biological networks,
how-ever, we notice several problems. First, biological meanings of network motifs are not validated
thoroughly. Network motifs are selected only by their structural uniqueness and only small part
of motif instances are examined and utilized to some applications. We believe that
biologically-related evaluation methods should be provided as we are studying biological networks. Next, it is
possible that we waste most of computational time to count the instances of a particular network
motif which will be thrown away later. We should have a pre-filtering task which will help for
efficient search of biologically important motif instances. Also, non-network motifs (that is,
struc-turally insignificant subgraphs) have not been analyzed in any studies, which are filtered out before
applied to any applications. It is likely that we lose many biologically meaningful subgraphs by
ignoring non-network motifs. Another problem is that other than the traditional notion of network
motifs being functional building blocks, there may be other aspects that network motifs can
repre-sent. Besides, network motifs bear numerous issues such as an optimal size of network motifs and
additional knowledge for effective discovery, which will be potential research topics in the future.
This thesis is, therefore, dedicated to solve those problems in network motifs and, more
gen-erally, in biological motifs. For protein motifs, our analysis targets to obtain universally preserved
sequence patterns across protein family boundaries. We utilize clustering algorithms to analyze
the whole data set and evaluate its biological importance with their structural similarities. For
network motifs, we seek biological meanings of network motifs, with innovative algorithms and
asBiological Network Motifs. Biological network motifs are biologically significant small-size
of subgraphs regardless of its structure. These might not be exactly categorized into a number of
different classes, but some biological roles can be assigned to them. We emphasize that our work
is a preliminary work toward comprehensive researches on network motifs focusing on their
bio-logical usages and construction of network motif databases. We introduce a number of algorithms
for efficient searches of as many biological network motifs as possible, and design new
evalua-tion methods, which validate the biological quality of network motifs. Furthermore, we exploit
biological network motifs to the application of predicting essential proteins in a PPI network.
1.2 The Approaches
Biological motifs are mostly discovered through computational approaches, where the main
challenges occur by the followings reasons. First, there is no prior knowledge of how the motifs
look or how large they are. Second, the location of motifs is also unknown. Therefore, exact search
for biological motifs usually takes exponential time. In addition, the insertion or deletion in the
sequences alignment makes it more difficult to find sequence motifs. Although there is no
dele-tion nor inserdele-tion, detecdele-tion of network motifs has more computing challenges since the process
requires three-dimensional search, isomorphic testing which is NP-hard problem, and repeated
processes for uniqueness determination.
With all the above problems, however, we focus more on biological meanings of motifs.
Unlike traditional sequence motif search which is to find a consensus short-substring from a set of
functionally related sequences, we search protein sequence motifs which can describe universally
preserved sequence patterns across protein family boundaries. For efficient and better qualified
result, we make use of a clustering method, especially nonnegative matrix factorization. We also
show that an incorporation of Chou-Fasman parameter, which is a statistical information for protein
secondary structure of each amino acid, helps further improvements on the discovery of protein
motifs. The new algorithm is compared with an improved K-means algorithm by Zhong et al. [30],
(SSS) and structural DBI (sDBI) measure. In fact, the sDBI measure is developed in this work, to
qualify the clustering results with more weight on the structural properties.
For network motifs, we provide the following approaches;
• We define biological network motifs that emphasize more on biological significance rather
than topological significance.
• We introduce a number of algorithms for an efficient search of biological network motifs
using clustering analysis and additional biological information.
• Although biological functions of network motifs are not fully appreciated until now, we
design some evaluation measures that can measure biological values of network motifs with
limited sources.
• To see if biological network motifs can be practically applied to many applications, we
apply biological network motifs to essential protein discovery and prediction problems, and
provide experimental results.
The algorithms compete with existing algorithms and the performances are compared based
on the new measurements introduced in this work. The main strategy of efficient search is to
modify the original network by reducing a number of edges: We provide edge-removing algorithms
and clustering algorithms. After the modification, all algorithms produce a number of clusters and
a number of edges between clusters. They are computationally efficient algorithms because the
number of biological network motif search reduces in a great amount with the decrease of the
number of edges as shown in Figure 2.8. Through experiments with a couple ofS. cerevisiaePPI networks, we demonstrate that we can save the search time polynomially while preserving the
detection rate for different patterns. This explains that the algorithms can be used to traditional
network motif discovery as well.
To compare the performances, we develop three evaluation methods: motifs included in
protein complex, motifs included in functional module and GO Term clustering score.
MFinder [33]. Furthermore, we can parallelize the whole process using message passing interface
(MPI) as we obtain a number of disjoint sub-networks as the result of these algorithms. In addition
to the motif search in each sub-network, we can search the missing subgraphs from the removed
edges if we use an algorithm RSRE (Recover Subgraphs Form Removed Edges) at Appendix B,
and RSRE can be trivially parallelized as well.
Biological network motifs are applied to discover essential proteins in a PPI network. Many
existing centrality algorithms have been used to detect essential proteins and their performances
were compared in a number of studies. In this thesis, we develop a Motif Centrality with GO
(MCGO) [34] which uses network motifs for a more robust centrality algorithm and incorporates
biological information of gene ontology (GO) terms. We show that MCGO performs best in among
other centrality algorithms for the detection of essential proteins. Also, various biological centrality
algorithms, where biological pruning process preceded, are integrated to form a set of features to
be plugged into a machine learning algorithm to predict essential proteins. Previous study by
Acencio and Lemke [35] extracted a number of features from an integrated biological networks,
BP (biological process) and CC (cellular component) GO annotations. This feature set is referred
as ‘ING-GO’ (Acencio and Lemke, 2009) in this work. We show that our set of features with
biological centrality algorithms, named ‘CENT-GO’ (Kim et al., 2012), includes much less number
of features, but produces the almost same performance as that of ‘ING-GO’ (Acencio and Lemke,
2009). Also we improve the prediction rate significantly by integrating ‘CENT-GO’ (Kim et al.
2012) and ‘ING-GO’(Acencio and Lemke 2009).
1.3 Contribution
In this thesis, we utilize clustering algorithm for efficient biological motifs discovery
includ-ing protein sequence motifs and network motifs. However, to obtain biologically meaninclud-ingful
re-sults, we have to involve biological information in the algorithms and evaluate the results with
biological standards.
Overall, the work has three contributions to the study of biological motifs: 1) We used
information in the process. In fact, biological clusters and biological motifs are closely related.
As we do not have prior knowledge in motifs, clustering the data with intrinsic similarity helps
efficient discovery of motifs. 2) We raised various questions regarding biological motif
applica-tions and we specifically designed algorithms and evaluation methods based on the quesapplica-tions. We
designed a number of algorithms which combine the topological and biological information of
bio-logical data. Since most of the algorithms are based on biobio-logical and topobio-logical information, the
results are more consistent than existing algorithms which are based on random selections. We also
provided a number of evaluation measures which qualify biological importance of the biological
motifs. As we know of, this is the first attempt to suggest systematical evaluation measurements for
network motifs. 3) We show that biological network motifs are successfully applied to a practical
application, which is the prediction of essential proteins in a network. With these contributions,
we hope that our work gives a guideline for the researches in biological motifs.
1.4 Dissertation Road Map
The remaining part is organized as the followings. We review related literatures about
bio-logical motifs, biobio-logical networks and granular computing in Chapter 2. Protein sequence motifs
in a large-scale data set are discovered using clustering method combined with biological
infor-mation in Chapter 3. Definition of biological network motif, introduction of new algorithms and
evaluation methods are explained in chapter 4. We apply biological network motifs to identify or
predict essential proteins in Chapter 5 and Chapter 6, followed by a conclusion and future study in
Chapter 7. The detail of NMF algorithm with the Bounded Matrix Factorization (BMF) which is a
Chapter 2
LITERATURE REVIEW
We provide background information for biological motifs in this chapter. We review
bio-logical motifs such as sequence motifs and network motifs in Section 2.1, followed by biobio-logical
networks in Section 2.2. As biological data, in general, is huge, we utilize granular computing
strategy for efficient computation, which will be discussed in the following section. Through this
review, we will bring up some of issues regarding biological motifs and their meanings and provide
solutions in next chapters.
2.1 Biological Motif
Biological motifs are defined as recurring patterns in biological systems and they are
pre-sumed to have biologically important structures or functions. In DNA or RNA sequences, motifs
are nucleotide patterns that appear most frequently in a set of DNA or RNA sequences. They
im-ply sequence-specific binding sites for transcription factor proteins (TF) [36], or relate significant
RNA processes such as ribosome binding and transcription termination [37].
Protein sequence motifs, consisting of twenty amino-acids, have different definitions and
in-terpretations according to Bork and Koonin [38]; 1) They are short functional motifs which are
independently evolved from the surroundings. Examples include myristilation sites and
glycosyla-tion sites. 2) Some involve short structural motifs which are repeating super-secondary structures.
3) Others are functional motifs which do not involve invariant residues, rather involve sequence
level constraints, including transmembrane regions, signal sequences or cell sorting. 4) They are
discovered from a set of protein sequences with homology tests and reflect functional and
struc-tural constraints from the given set. In the past they are discovered through biological and chemical
days. In this thesis, we discuss only the last type of motifs which involve the concept of homology
and consensus.
Similar to sequence motifs, network motifs are frequent and unique patterns but discovered
from networks instead of sequences. While sequence motifs were first derived from applications
such as discovery of DNA binding sites or core functional subsequence in proteins, network motifs
were first introduced as structurally significant patterns in a network and a number of applications
are followed afterwards. Therefore, most of algorithms focus on finding structurally and
statis-tically significant patterns, but the biological meanings of the results are discussed only through
some applications. In fact, detecting network motifs requires high computational resources which
limits measuring the quality of network motifs in biological aspects.
For better understanding of the problems for biological motifs and the challenges, in this
sec-tion, we review biological motifs including sequence motifs and network motifs, introduce some
computational challenges for search, and examine the evaluation measures with various aspects.
2.1.1 Sequence Motif
Researches on sequence motifs were motivated from the discovery of DNA binding sites.
DNA binding sites are short subsequences in DNA which are bound by DNA-binding proteins.
The problem consists of two subproblems [39]: 1) Given a collection of known binding sites, find
a representation for prediction in a newly discovered sequence; 2) Given a set of sequences
con-taining binding sites for a common transcription factor, find the location and the representation.
The representation is expressed as a subsequence in the set, which is later defined as a sequence
motif. Through many technologies for DNA sequencing [40, 41], the amount of DNA sequences
to be analyzed has increased rapidly. Therefore, in parallel with experimental approaches such
as DNase footprinting, gel-shift or reporter construct assays [37], many computational algorithms
have been developed to discover DNA binding sites, and they are generalized for the task of
dis-covery of sequence motifs not only in DNA but also in RNA and protein sequences.
Protein sequence motifs are defined similarly, as particular amino acid sequences which are
DNA motifs and protein motifs can be related each other. For example, it is generally known that
if a sequence motif is detected in the exon of a gene, it is related to the structural motif of a protein.
If it is not in the exon, it can be regulatory sequence motif. Nevertheless, the problems for DNA
and protein motifs are generalized as sequence motif problems as the differences are mostly on the
bases in the sequence. Sequence motifs have various representations and different algorithms for
detection or prediction. Most algorithms are limited to specific type of representation, and a lot
of tools have been developed for detection. We review the diversity of motif representations and
many computational algorithms in this section.
2.1.1.1 Representation
Sequence patterns have been described in various ways [42], in order to summarize the
gath-ered information, usually after multiple sequence alignments. Since sequence motifs are short
patterns of sequences, the representations also follow these existing sequence representations.
Fer-reira and Azevedo [43] categorized those representations as deterministic and probabilistic
repre-sentations [44] and we will discuss them within this category.
Consensus sequence representation is an example of a deterministic representation. It is the
result of multiple sequence alignment and refers to the most common elements, which are
nu-cleotide or amino acid, at a specific location. PROSITE database [45] stores sequence motifs with
consensus sequence representation, where regular expression syntax is used for searching sequence
motifs represented in consensus sequence. Regular expression is a notational algebra describing
a string or a set of strings, and the rules are as the followings, details of which are also described
in [42].
• The standard one-letter codes for nucleotide or amino acids are used.
• ‘x’ is used for an arbitrary element.
• Multiple letters for one location are listed in square parentheses, [ ] .
• To separate the elements, ‘-’ is used.
• If an element is repeated, it is specified with a numerical value in parenthesis, (). For
exam-ple, x(3) means, x-x-x. x(1,3) means x, or x-x or x-x-x.
• For a pattern restricted to either N- or C-terminal, it starts with ‘<’, or ends with ‘>’.
• The pattern ends with a period.
For example, if a PROSITE pattern is “A-x-[ST](2) - x(0,1) - V-LI”, it means “Ala-any-[Ser
or Thr]-[Ser or Thr] - (any or none) - Val - (any but Leu, Ile)”. The deterministic representation is,
however, too rigid to represent the diversity of motifs in most cases. In addition, as motifs are very
short, the simple representation can lead many false positives in databases. Therefore, a number
of stochastic representations are introduced, including Position Weight Matrix(PWM), Profiles or
profile HMMs.
PWM, also called as a Position Specific Scoring Matrix (PSSM) or Position Specific Weight
Matrix (PSWM), is one of probabilistic motif representations. A PWM is constructed from
mul-tiple alignments of sequences and provide a weighted score representing the variation in each
column. A profile is a variation of PWM, but while PWM does not allow gaps, profile includes
gap penalties in the alignments. Figure 2.1 is an example of PWM, and profiles are in a similar
format.
Profiles can be represented as profile HMMs where the alignment results are represented as
hidden Markov models. Profile HMMs is another variation of PWM, but it is appropriate for
searching databases for remotely homologous sequences [46]. Profile HMMs representation was
first introduced in computational biology field by Churchill [47], which are used as profile models
by Krogh [3] later. An example of conversion from a DNA motif into a profile HMM representation
is shown in Figure 2.2. The conversion steps will not be described in this thesis, so readers are
[image:37.612.129.491.267.567.2]advised to refer [3] for more details.
Figure 2.2: An example of profile HMMs, from the paper [3]. A DNA motif at the top can be converted into a profile HMM at the bottom.
On the other hand, a sequence logo [4] is a graphical description of a profile, where the size of
a symbol indicates the frequency that a given base appears at the specific position in the sequence.
The letters at each location are sorted so that the most common element is on the top. Sequence
information content at each position, with graphical advantages. One example is shown in Figure
2.3. A web tool, or a WebLogo [48] is available to generate a sequence logo at the following site
[http://weblogo.threeplusone.com].
Figure 2.3: An example of a sequence logo, from the paper [4].
2.1.1.2 Algorithms
Sequence motifs, which had been discovered through biological and chemical experiments,
are now detected and predicted through various computational methods which are based on
se-quence alignment algorithms. Most algorithms are computationally very expensive with the
fol-lowing unknown factors: 1) what the motifs look like including the size and the composition, and
2) where they start.
Although, currently, more than a hundred publications of algorithms exist, there is no
compre-hensive benchmark to compare the algorithms. Only some surveys of the algorithms are available.
D’haeseleer [49] categorized the motif search algorithms into three approaches: enumeration,
de-terministic optimization and probabilistic optimization. In this thesis, we follow this category to
explain the existing algorithms and describe some of tools that implemented the algorithms.
Enumeration Enumeration algorithms exhaustively search for the location with all possible
avoid poor local optimum. Dictionary-based methods search all the possible cases in the
target set of sequences, while block-based methods search the space up to a given length
(YMF). WeeberWeb [50] allows some mismatches and uses an efficient suffix tree
repre-sentation to find motifs. Enumeration algorithms such as WeederWeb and YMF perform
especially well on eukaryotic sequence sets of known motifs in the study [51]. But as they
are computationally too expensive, only a small data set is feasible to be applied. The tools
include MITRA [52], Weeder [53] and YMF [54].
Deterministic Optimization Deterministic optimization algorithms simultaneously optimize a
motif, especially PWM format, through iteration steps. As one of deterministic
optimiza-tion method, expectaoptimiza-tion-maximizaoptimiza-tion (EM) has been used for the PWM data sets [37, 55].
In the algorithm, a PWM for a candidate motif is initialized, then in the expectation step
(E-step), the probability that it was generated by the motif is computed in each data. Then
we take a weighted average across the probabilities to refine a new motif model in the
max-imization step (M-step). The EM-steps are iterated until it converges to a maximum of the
log likelihood. MEME [56] is a variation of EM and performs one iteration of EM for each
n-mer subsequence from the data set, then selects the best motif to iterates only with the
selected one, which avoids a poor local optimal point. Improbizer [57], MEME [55] are
available tools which are based on these algorithms.
Probabilistic Optimization While deterministic optimization algorithms take a weighed average
across all n-mers, probabilistic optimization algorithms take a weighted sample from the
n-mers. Gibbs sampling algorithm [58] is the example. Gibbs sampling algorithm, as a
stochastic implementation of EM, initializes a motif with a number of randomly selected
subsets. Then all the subsequences in the data set is scored based on the initial model.
Through iterations, the model is refined by adding or removing a new subsequence, and the
binding probabilities are updated. Available tools of this method include AlignACE [59],
The judge about which algorithm is better highly depends on the settings, such as motif
repre-sentation, objective function and the number of data. Therefore, it is advised to combine the results
from multiple motif finding tools and decide the biological relevant with an appropriate evaluation
criterion.
2.1.1.3 Evaluation
Determining which algorithm to use for a specific application is practically important but
nontrivial as almost every algorithm uses a different measure to optimize or score motifs. An
important issue on motifs is that not all of the resulting motifs are useful and majority of them
arise by chance [62]. Consequently, evaluation measures to determine significant motifs have
been another major trends. The most obvious way of assessing the significance of the motifs
is to delegate the decision to the biologists or chemists. However, it is unrealistic as there are
vast amount of motifs to be evaluated. Alternatively, automatic evaluation measures have been
introduced with statistical and informative measures, although these methods do not guarantee the
biological significance [63]. We review some of automatic evaluation methods in this section.
For automatic evaluation, the problem tends to be restricted into a classification problem
where a set of positive and negative patterns are available. In general, a significance measure is
introduced [64] as a functionf(m, C) → R, where mis the motif being investigated and C is a set of background sequences or target family. The return value is a score of thembased onC. The target motifmis compared under theC. Therefore,C will be a positive set and the remaining set C is a negative set. Then the motifs are evaluated according to 1) the probabilities of matching a random sequence, 2) sensitivity and specificity, 3) information content and 4) minimum description
length, as Sagot suggested in [65].
The measures are also referred as class-based, theoretic-information or mixed measures in
[62]. Class-based measures include sensitivity, specificity, positive predictive value, F-measure
and discrimination power (Dp) [66]. Theoretic-information measures evaluate the degree of
in-formation in a motif. Inin-formation gain(IG) [67, 68], minimum description length (MDL) [69, 70],
J-measure [71] and mutual information (I–measure) [72,73] measures are provided as combination
measures of class-based and theoretic-information measures.
D’haeseleer provides more evaluation measures in his paper [49], such as, information content
[37], log likelihood and MAP score which are based on statistical models, to see how much a
motif deviates from a background distribution. Additional methods, including group specificity
(site specificity) [74], sequence specificity [50, 51], and positional bias [74, 75] or uniformity [51],
try to distinguish real motifs from spurious motifs.
However, we should note that different measures have different properties. Although these
measures are commonly used to evaluate motif search algorithms, none of them is sufficient to
distinguish the real motifs from false ones [51]. Hence, the best measure should be chosen based
on its applications. Ferreira and Azevedo [62] compared the evaluation measures with PROSITE
patterns and showed their relevances; some are closely related and others are very exclusive. For
other measures, Zhong et al. [76] developed a secondary structural similarity measures, Chen et
al. [32] proposed a HSSP-BLOOSUM62 measure to impose the chemical property of motifs and
Kim et al [77] introduced a structural DBI (sDBI) to emphasize the structural quality of motifs.
2.1.1.4 Applications
Other than the DNA binding sites, DNA sequence motifs are useful in defining genetic
regula-tory networks, deciphering the regularegula-tory program of individual genes or predicting regularegula-tory
net-works [37]. Protein sequence motifs also have many applications other than supporting proteins’
structure and functional information. For example, protein sequence motifs helped to discover
sub-families in large protein families [69]. In addition, many tasks for the family classification
used protein sequence motifs [78–84].
Regardless of the sources, however, sequence motifs are very useful to sequencing analysis
and the applications as well. For example, sequence motifs help to perform clustering task in [85].
Sequence clustering problem is usually challenged by the lack of efficient similarity measure,
for the sequence annotation or for the gene expression analysis. In addition, they are very useful
to detect any homology relations between sequences or larger structures.
2.1.2 Network Motif
Network motif is a subgraph pattern which appears more than usual in a network. Although
it is obvious that the definition of network motifs is derived from the concept of sequence motif,
the detection of network motifs does not involve alignment, instead it involves isomorphic testing,
which is NP-hard problem, and statistical evaluations such as Z-score or P-value for uniqueness
determination, which requires vast amount of repetitions. Therefore, most researches have focused
on fast revelation of network motifs as the process involves computationally challenging steps.
Identified network motifs are applied to many real-world problems including protein function
pre-diction, detecting evolutionary conservation and specific genes and so on. In this research, we
present a number of algorithms to find network motifs and many applications of network motifs.
We address some of issues in network motif and raise the need for biological network motif and
its systematic evaluation methods.
2.1.2.1 Network Motif and Beyond
Network motif is a repeated subgraph pattern in a network and it is identified by only its
topo-logical frequency and uniqueness [16, 87, 88]. On the other hand, network alignment and network
querying, which are similar to network motif, use both topological and biological information. In
this section, we first compare network motifs with sequence motifs, then review network alignment
and network querying. Network alignment and network querying is developed in the context of
biological networks, which will be covered in Section 2.2.
Sequence Motif and Network Motif A sequence motif is a repeated pattern that is
prevalent in a number of sequences, such as DNA/RNA or protein sequences. Sequence motifs are
known to have biological significance such as binding sites and conserved domains. If a motif is in
a unique element of the overall structure of a protein. With this property, sequence motifs can
predict other proteins’ structural or functional behaviors. Therefore, discovering sequence motifs
is a key task to comprehend the connection of sequences with their structures. PROSITE [45],
PRINTS [89] and BLOCKS [90, 91] are currently the most popular motif databases. There are
also many software programs for discovering one or more candidate motifs from a number of
nu-cleotide or protein sequences. These include PhyloGibbs [92], CisModule [93], WeederH [94], and
MEME [56]. For example, MEME utilizes hidden Markov models (HMM) to generate statistical
information for each candidate motif.
Network motif is defined as similar to a sequence motif, except it can be discovered in
net-works. Network motif is a subgraph which appears more than usual in a network and it is identified
with its topological uniqueness. While sequence motifs allow some variations in multiple
align-ment such as gabs or indels, network motifs allow no deviations in structures, and no alignalign-ment is
required. However, discovery of network motifs requires much higher computing resources as it
involves isomorphic testing and a number of random generations to determine its statistical
signif-icance. Furthermore, the biological roles of network motifs are still unclear whereas a number of
sequence motifs are proven to have clear biological functions and many motif databases categorize
the motifs based on their different roles.
Network Alignment Network alignment, along with network querying, belongs to
biological network comparison tasks. Network alignment requires both a scoring function and a
search procedure in the same way as sequence alignment. PATHBLAST for pairwise alignment is
first developed [5] and it is generalized to multiple alignments in Graemlin [6]. In [5], two
protein-protein interaction networks are aligned using interaction topology and protein-protein sequence similarity,
which identified conserved interaction pathways and complexes. Figure 2.4, by the courtesy of [5],
shows the processes and results.
Network alignment first merges the two networks according to protein sequence similarity
then connections are established based on the graph match. Like sequence alignment, network
net-Figure 2.4: Top-scoring pathway alignments between bacteria and yeast. (a) The protein-protein interaction networks ofH. pyloriandS. cerevisiaewere globally aligned to reveal conserved net-work regions through b-f processes. This figure is from [5].
work alignment is generalized to the multiple network alignment in Graemlin [6]. Figure 2.5
describes the Graemlin algorithm with four network examples, extracted from [6]. Graemlin
al-gorithm merges two networks into one aligned network for the next step. Therefore, the order of
alignment is important, which was selected by phylogenetic closeness. When align two networks,
each network produces a number of d-clusters. The clusters for two networks are paired and scored
using parsimonious ancestral history and BLAST score for proteins. The highest pair of d-clusters
are selected as a seed and it is extended using a greedy algorithm. The result of alignment of two
[image:44.612.127.487.78.443.2]networks. The three networks are moved to the next step to be compared with a new network.
Figure 2.5, extracted from [6], describes the procedure of Graemlin.
Network Querying Network Querying is another network comparison and it differs
from network alignment as it searches a part of network or sub-network from a given network.
PathMatch and GraphMatch are introduced in [7] for network querying. PathMatch finds a match
with a given linear path. GraphMatch search a matching subgraph using a score function. The
algorithms, however, have limitations as the scoring functions have unrealistic assumptions about
mismatch and indels. Figure 2.6 shows an example by PathMath algorithm [7].
2.1.2.2 Algorithms
Traditional process of network motif discovery is divided into three steps: 1) Find all
non-isomorphic subgraph patterns and record the frequency of each pattern in the target network. 2)
Generate a number of random graphs, typically more than 10,000 graphs, and count the frequencies
of each type. 3) Determine network motifs based on its statistical significance computed with the
result of 1) and 2). The first and second tasks involve graph isomorphic testing which sits between
P and NP-problem. Practical approach to the graph isomorphic problem is to label each subgraph
with canonical labeling technique. Several algorithms exploited McKay’s [2, 95]Nauty-algorithm for the labeling. Therefore, the main challenge of motif detection is to search all of the k-node
subgraphs in the original and generated graphs as the search increases exponentially with the size
of network as well as the size of subgraph. Previous algorithms present different approaches with
different categories. For example, the algorithms are divided into exact counting and sampling
algorithms, or, network-centric and motif-centric algorithms. To overcome computational
infeasi-bility and incorrect results, parallel or distributed search algorithms are also developed.
Exact counting algorithm Network motif was first introduced as a functional building
block in a transcriptional regulatory network by Milo et al. [16]. The authors fix the size of network
(Exhaustive Recursive Search) algorithm. It uses ann ×n adjacent matrix as a data for n-node network, then enumerate all nknumber ofk-size subgraphs. Because of the expensive computing time, the motif size should be limited as less than 5.
For more effective search, Wernicke [15] developed an ESU (Enumerate Subgraphs) by
build-ing a search tree where the leaves are all subgraphs of the given size. Each child node of the tree
is extended by adding one neighbor vertex to the set of vertices from the parent’s node. During
the search, it keeps an auxiliary dynamic list of nodes that are candidates for future additions. The
authors also presented a sampling algorithm, RAND-ESU, which skips random set of branches
in a tree during the search. Consequently, RAND-ESU improves the speed of search greatly and
increases the feasible motif size up to 14.
On the other hand, Parida [17] introduced a compact graph representation for the search of
k-node subgraphs. A compact graph representation is obtained by collecting an indistinguishable
set of nodes together, and a motif is defined as a subgraph which appears frequently in a given
threshold. The algorithm reduces the search time in a great amount as the number of representation
enumerated from this compact graph is much less than the number of all subgraphs.
All the aforementioned algorithms are network-centric methods as they search graphs in the
target network. On the contrary, Grochow and Kellis [96] presented a motif-centric method, which
first lists all the possible patterns of given size as a query set, then search isomorphic subgraphs
to each query in a network. This method was able to find up to 15-size motifs. However, the
motif-centric algorithm can be inefficient for larger size of motifs, since the number of all possible
query subgraph patterns increases exponentially with the size of motifs, which eventually results in
many redundant searches. Table 2.1 shows the number of non-isomorphic directed and undirected
graphs with up to 10 vertices, and we can see that the number of non-isomorphic graphs increases
exponentially as the size of vertices increases. For example, the motif-centric algorithm needs to
list 11,716,571 number of subgraph patterns in order to search for size 10 network motifs, and
![Figure 2.2: An example of profile HMMs, from the paper [3]. A DNA motif at the top can beconverted into a profile HMM at the bottom.](https://thumb-us.123doks.com/thumbv2/123dok_us/9227087.990523/37.612.129.491.267.567/figure-example-prole-hmms-paper-motif-beconverted-prole.webp)
![Figure 2.5: Outline of the Graemlin algorithm, by the courtesy of [6]. (A) Four networks withtheir phylogenetic relationships](https://thumb-us.123doks.com/thumbv2/123dok_us/9227087.990523/67.612.127.488.128.574/outline-graemlin-algorithm-courtesy-networks-withtheir-phylogenetic-relationships.webp)