www.hydrol-earth-syst-sci.net/16/1533/2012/ doi:10.5194/hess-16-1533-2012
© Author(s) 2012. CC Attribution 3.0 License.
Earth System
Sciences
A climate-flood link for the lower Mekong River
J. M. Delgado, B. Merz, and H. Apel
German Research Centre for Geosciences, Section 5.4, Hydrology, Potsdam, Germany
Correspondence to: J. M. Delgado ([email protected])
Received: 25 October 2011 – Published in Hydrol. Earth Syst. Sci. Discuss.: 16 November 2011 Revised: 9 March 2012 – Accepted: 2 May 2012 – Published: 29 May 2012
Abstract. The Mekong River in Southeast Asia thanks its regular annual flood to the southwest monsoon. At longer time scales, the monsoon is a spatially and temporally vari-able circulation, with different annual to millennial variation for different regions. In this paper, the Indian and the Western Pacific components of the monsoon were analyzed to draw a light on the interannual flood variability of the Mekong River. The focus is on the variance of flood season flows at 8 stations on the Mekong River, as well as on well-known cli-mate indexes that reflect the dynamics of the monsoon circu-lation and ocean temperature anomalies. An effort was made to identify the temporal resolution that contains most of the interannual variability of both flood regime of the Mekong and monsoon intensity.
We found a close connection between the Western Pacific monsoon and the discharge in Kratie and other stations in the Southern Mekong region. In the frequency domain, the inter-annual to decadal variance of the Mekong discharge closely follows that of the Western Pacific monsoon. More impor-tantly, the well-known regime shift of 1976 in the North Pa-cific is detectable in the frequency domain for flood discharge and monsoon intensity. This suggests a relationship between Pacific sea surface temperature and monsoon variance, which is a good predictor for flood variance. This dependence influ-ences the probability of occurrence of floods in the Mekong Delta.
1 Introduction
The Mekong River in Southeast Asia, one of the world’s ma-jor rivers, is dominated by the Asian monsoon in many as-pects. Sectors like inland fisheries, navigation, hydropower and agriculture depend directly or indirectly in the intensity and temporal/spatial distribution of monsoon rainfall over the
basin. They often conflict with each other (Grumbine and Xu, 2011; Bakker, 1999; K¨ak¨onen, 2008). The history of the re-gion is also closely related to the variability of its climate, as it contributed to the birth and fall of civilizations (Cook et al., 2010; Buckley et al., 2010).
The link between monsoon intensity and the flood regime of the Mekong River is at first sight a direct one. The clear division of the year between a dry and a wet season leaves no room for other main sources of precipitation in the region. Indeed, the monsoon months (approx. from May to October) account for 80 to 90 % of the discharge in the lower Mekong. Other sources are snow melt from the Tibetan Plateau and localized tropical storms, which are also related to the peri-odicity of monsoon circulation.
The importance of the monsoon to the peoples of South and Southeast Asia is not matched by our skill to predict the intensity or understand its variability (Shukla, 2007). The skill of modeling the mechanisms that force monsoon pre-cipitation in the Asian-Pacific region is still moderate to poor over land masses (Wang, 2005). Making things more compli-cated, the Mekong River is located between two components of the monsoon. These are forced by two different oceans that condition the variability of the monsoon: the Indian and the Pacific Ocean.
Indian monsoon approx. extent
East Asian monsoon approx. extent
Pacific Ocean
Indian Ocean
[image:2.595.128.470.62.258.2]1 2 3 4 5 6
Fig. 1. Asian monsoon regions. Mekong River, its basin and the location of the gauging stations used in this study are shown. The approximate
East Asia-Western North Pacific monsoon and Indian monsoon extents were taken from Holmes et al. (2009). The stations used in this study were Vientiane (1), Thakhek (2), Mukdahan (3), Pakse (4), Stung Treng (5) and Kratie (6).
Western Pacific. These flows finally generate convectional in-stability over the Asian continent and produce a large amount of rainfall.
The Mekong River is located in a region affected by a mixed Indian and Western North-Pacific monsoon (Fig. 1). Precipitation from the IM is forced by the convective heat source over the Bay of Bengal, whereas precipitation from the WNPM is forced by the convective heat source over the South China Sea and the Southeast Asian Archipelagos. Wang et al. (2001) showed that in years of strong WNPM, the low level cross-equatorial jet west of Sumatra has a positive anomaly, contributing to the also positive anomaly of west-ward wind over the lower Mekong basin. The 2011 strong monsoon season over the lower Mekong basin and South-ern Thailand had its origin in the mentioned positive WNPM anomaly (NCEP-CDAS, 2011).
Different periods of enhanced variability have been shown to occur in both monsoons (Wang et al., 2001). The reason for that is the greater response of the Western Pacific mon-soon to thermal conditions in the Pacific, of which ENSO plays a crucial role. Wang et al. (2001) showed that the East Asian, Indian and Western Pacific components have differ-ent patterns of interannual variability and geographical ex-tent. This is mainly due to geographic boundary conditions of very different nature: the Indian Ocean is land-bounded to the North and West, while the Western Pacific has a predomi-nant East-West arrangement of land and ocean. Additionally, the two components of the monsoon interact differently with El Ni˜no/Southern Oscillation (ENSO) – both phenomena are coupled to the ENSO cycles, but the strength of the coupling has changed over time (Lau and Wang, 2006) – and with the Australian monsoon.
The extratropical Pacific ocean also plays a role in the strength of the ENSO’s influence in the monsoon. Krishnan and Sugi (2003) and Chan (2005) point to a stronger positive monsoon-ENSO interaction when the Pacifid Decadal Oscil-lation is in phase with the ENSO. This would mean dryer than usual monsoons occur for positive PDO and El Ni˜nos, while wetter than usual monsoons would be more likely for a negative PDO and a La Ni˜na event.
The Mekong basin covers mainly tropical and sub-tropical latitudes with tropical monsoon in the south to humid con-tinental climate in the north according to the K¨oppen clas-sification (Peel et al., 2007). Thus the interannual variability patterns of streamflow are expected to be distinct. Recently, Xue et al. (2011) revealed a spatial evolution of the power spectrum of discharge along the river, which was related to atmospheric circulation. By estimating different trends in the second moment of the distribution of annual maximum daily discharge, Delgado et al. (2010) showed that a changing flood variability pattern could be identified along the river.
whether or not similar variability changes are observed in the monsoon circulation appears as natural.
We intend to quantify changes in monsoon intensity and variability that affect the flood regime of the Mekong River. We focus especially on changes in the variance of monsoon intensity, essencially because changes in the flood regime of the same kind have been reported in the literature (Delgado et al., 2010; Wang et al., 2001). Further, we examine the link-ages between the two monsoon components that affect the variability of floods in the region. The area of interest is the region upstream of the station of Kratie, i.e. excluding the Mekong Delta. Downstream of this point, the flood propa-gation follows a complex dynamics, due to topography (the delta system and the reversed flow of the Tonle Sap) and land use changes. The discharge downstream of this point is also significantly affected by tides, storm surges and sea level rise (Dung et al., 2011).
The quantification of the variability of the Asian monsoon at the continental scale was mainly accomplished within the last two decades (Wang et al., 2001). Before that, studies fo-cused mostly on the local/national scale. A simple way of quantifying and predicting the interannual variability of the Asian monsoon at a continental scale is to derive a measur-able varimeasur-able representative of the physical processes. Wang and Fan (1999) reviewed the most important measures of monsoon intensity. More recently, many authors used these indexes for different purposes, such has characterizing the monsoon variability (Goswami, 2006), evaluating and val-idating model predictions (Paeth et al., 2008; Cherchi and Navarra, 2003) or investigating trends in monsoon intensity (Chase et al., 2003).
The correlation between monsoon and flood frequency can be quantified statistically, by plotting the cross wavelet spectrum of annual maximum discharge and a monsoon in-dex. If there is a consistent phase relationship between the two, it is likely that one of the monsoon components forces the interannual variability of floods in the Mekong. The pe-riodicity of this interaction can be observed in the cross-wavelet spectrum, the relevant modes extracted and its vari-ance quantified.
2 Data and methods
In this work we applied the continuous wavelet transform (CWT) for visually examining changes and enhancements in variability. The significance of these changes is later tested based on the discrete wavelet transform. The contin-uous wavelet transform is a time-frequency transformation of a time series. By convolving a certain type of function (defined in the literature) with the data, it is possible to esti-mate the power of each frequency for the requested time and frequency resolution. A simple analogy can be made with a Fourier transform, with the only difference being the defini-tion in time: the wave virtually slides over all time steps to
produce a time-frequecy spectrum. A review of the method-ology can be read in Torrence and Compo (1998) and Grin-sted et al. (2004).
The discrete wavelet transform (DWT) is a special case of the continuous wavelet transform, where the frequency space is discrete and covers only diadic scales, i.e. scales equal to powers of 2. It has been shown that this transformation does not destroy the long-term memory of the data and that it effectively decomposes the variance of the time series into a number of chosen modes, which are related to a given fre-quency (Percival and Walden, 2000). The main advantage of the CWT over the DWT is its smoothing capacity and flexi-bility in the choice of frequencies for visualization purposes; however, the DWT is less redundant and therefore more used among the signal processing community.
The DWT was used to detect step changes in the variance of the flood discharge at different frequency levels. The time series of sizeNis convolved with the wavelet filters to obtain the wavelet and scale coefficients. To calculate the wavelet variance as a function of time, the wavelet coefficients are not downsampled (as would happen in a standard DWT), but kept with sizeN. This is called a maximal overlap DWT and allows the direct estimation of the wavelet variance from the wavelet coefficients. The step change in variance can be de-tected by maximizing the ratio between the cumulative sum of squares and the sum of squares of the wavelet coeffi-cients (Whitcher et al., 2002). Percival (1995) provides sev-eral ways of estimating the confidence interval (CI) of level
αfor the estimation of the wavelet variance; here the most conservative of them was used. If, for a given step change, the CIs of the variance before and after the change intersect, the step change cannot be considered statistically significant. Otherwise, the step change is statistically significant to the 1-αlevel.
It is generally accepted that the distribution of geophysi-cal data can be skewed and must be transformed or handled accordingly. In this paper, we drew on previous knowledge about the data (Delgado et al., 2010; Dung, 2011) to conclude that the variables used are not normally distributed. For cer-tain statistical tests, the mismatch between data and statistical model can lead to wrong confidence intervals. The data must be transformed whenever the methods used assume normally distributed data. We therefore standardized the hydrological and climatic data based on a 3 parameter lognormal distri-bution (parameterized as in Hosking and Wallis, 1997). The
Z-scores obtained from this transformation were then used to produce all the results discussed in this paper.
0 0.3 0.7
0 0.3 0.7
0 0.3 0.6
0 0.4 0.9
0 0.4 0.8
0 0.6 1.1
normalized
subdecadal
variance
Vientiane
Thakhek
Mukdahan
Pakse
Stung Treng
Kratie
1920 1940 1960 1980 2000
4 6 9
6 11 15
7 12 16
10 15 20
12 20 27
12 19 26
JJASON average discharge [m /s]
[image:4.595.101.499.62.273.2]3
Fig. 2. Dots represent JJASON (June to November) discharge averages (left axis). The shaded areas show the subdecadal variability of the
transformed discharge estimated with the Morlet wavelet (right axis). Lower stations show a later enhancement in variance.
were our indicators of choice. The flood season was consid-ered to last until November in order to include late flood peaks in the downstream stations, due to the superposition of upstream floodwave and typhoon landfall.
Both JJASON average discharge and annual maximum discharge were used in this study. The former is an important indicator of flood intensity in Southern Vietnam and Cambo-dia. A part of the flood volume is stored in the floodplains of Cambodia and in the lake Tonle Sap, but the remaining flows to inundate the Mekong delta. The duration of high water levels is critical for flood damage in the region and is mainly determined by the flood volume during JJASON. The annual maximum discharge, also used in this study, is necessary for any flood hazard assessment in the delta: Dung (2011) utilized both annual maximum discharge and JJASON aver-age discharge for generating synthetic hydrographs based on a nonstationary approach. In this study, both variables will be analyzed.
In Fig. 2 the JJASON discharge for the stations Kratie, Stung Treng, Pakse, Mukdahan, Thakhek and Vientiane on the Mekong River is shown. These are the longest available quality checked time series for the Mekong basin. The dis-charge data was received from the Mekong River Commis-sion (MRC) and the Southern Institute for Water Resources Research (SIWRR). The time series were trimmed to com-mon lengths of 1924–2001 to avoid inconsistencies due to possible extreme events at both ends of the time series.
Relevant climate indexes were used that describe Pacific sea surface temperature (SST), like the ENSO and the Pa-cific Decadal Oscillation (PDO) (Mantua et al., 1997) and monsoon dynamics (WNPM index and IM index) (Wang et al., 2001). Some of these indexes have a seasonal expres-sion: ENSO positive events, called El Ni˜nos, are a positive
departure from the average termal conditions in the East-ern Pacific that occurs around Christmas (Oliver, 2005) with a variable interannual periodicity; the monsoon indexes are mostly relevant during the summer months. Others, like the PDO, remain longer on a given mode. For the WNPM, IM and ENSO, boreal summer and winter averages were used, while for the PDO the monthly time series was used. The intensity of the monsoon is represented by the difference be-tween 850 hPa zonal wind velocities averaged over defined regions during June, July, August and September of each year (Wang et al., 2001). For the IM, these regions are located be-tween Somalia and Sri Lanka and in Northern India. For the WNPM, they comprise an area between Southern Indochina and Southern Philipinnes and Southern China and Southern East China Sea.
3 Results and discussion
Time series of JJASON average discharge for the gauges with the longest records in the Mekong are given in Fig. 2. In the background of each panel, the average subdecadal variance computed from the wavelet power spectrum is shown. The average subdecadal variance is defined as the variance of all scales lower than 10 yr averaged over the frequency domain. For more details see Torrence and Compo (1998). Two main features in the data are evident: the first is the enhancement in variance after 1970 in the three downstream stations; the second is the earlier enhancement in variance (1960) in the three upstream stations. This indicates that a north-south spa-tial pattern in interannual variability within the basin exists.
Vientiane (1967)
Thakhek (1971)
Mukdahan (1962)
Pakse (1976)
Stung Treng (1976)
Kratie (1976)
106
108
106
107
106
107
scale = 2 years scale = 4 years scale = 8 years
V
ariance (m /s)
3
[image:5.595.101.499.66.231.2]2
Fig. 3. Discrete wavelet variance estimated for the stations depicted in Fig. 1. Step changes in variance were detected with a statistic based
on the cumulative squared variance. The variance of the signal before and after the change is shown with confidence intervals. In the southernmost stations, this change occured in 1976. The changes are significant for confidence intervals that do not intersect.
WNPMI
Annual maximum discharge at Kratie
Subdecadal variance
Period
(a) Western North-Pacific monsoon variance (b) Indian monsoon variance
ISMI Annual maximum discharge at Kratie
4
8
16
0 0.5 1 1.5
−2 0 2
Intensity [m/s]
1950 1960 1970 1980 1990 2000 1950 1960 1970 1980 1990 2000
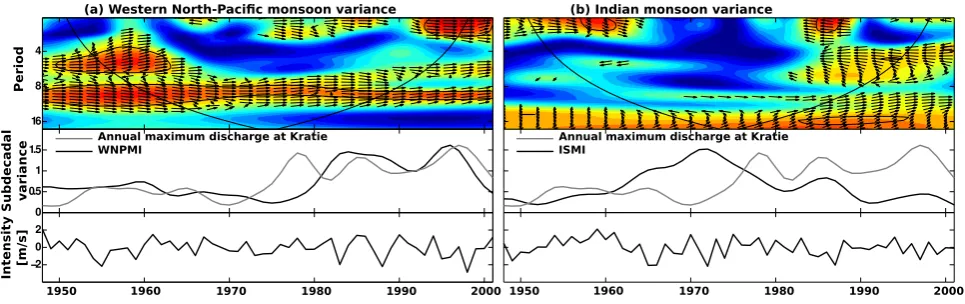
Fig. 4. (a) Phase coherence between the WNPM index and annual maximum discharge at Kratie (top). The y-axis shows the period of
the oscillation and the x-axis the year. Warm colors represent high coherence between the two signals. Significant periods and years are surrounded by a black contour. The arrows show the phase between the two signals: arrow pointing to the right means 0◦. The centre panel shows the 1 to 10 yr moving variance as given by the Morlet wavelet for the same variables. The lower panel is the monsoon index time series. (b) Same as in (a), but for the IM index.
squares of the DWT variance. For the three downstream sta-tions of Pakse, Stung Treng and Kratie, the step change oc-curred in 1976, as seen in Fig. 3. In 1976, a regime shift in the SST and sea level pressure of the extratropical Pacific Ocean has been detected by several authors (Kerr, 1992; Percival et al., 2001). This change is towards an enhanced variance in the 2 and 4 yr scales. Greater scales did not show any change in variance. In such a short time series, a change in the vari-ance of a scale of, say, 16 yr, could be interpreted as a local trend and not as a change in variance.
Further upstream in Mukdahan, Thakhek and Vientiane, some changes are still significant, but occur earlier in time (1962, 1971 and 1967, respectively). The subdecadal vari-ance in Fig. 2 indicates the same, with upstream stations suf-fering an increase in variance earlier in the century. These re-sults suggest (a) a nonstationary flood regime based on step
changes and (b) a possible relationship of the flood regime with the Pacific Ocean regime shift. The detection of a vari-ance change with the DWT in the annual maximum discharge time series did not yield statistically significant results; nei-ther was nei-there a clear pattern in the location and direction of the step changes.
[image:5.595.56.539.287.439.2]30N
20N
10N
100E
0 250 500
kilometers
−0.4 −0.2 0.0 0.2 0.4
30N
20N
10N
100E
0 250 500
kilometers
[image:6.595.66.266.62.218.2](a) (b)
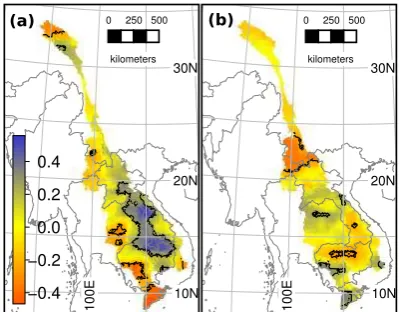
Fig. 5. Pearson correlation between GPCC precipitation over the
Mekong basin and (a) WNPMI and (b) ISMI. Regions where the statistical significance was greater that 95 % are enclosed by a black contour line.
Western Pacific Summer monsoon during the last quarter of the 20th century. Equivalent results were also obtained with different methods by Wang et al. (2001).
The upper panel of Fig. 4 shows the wavelet coherence spectrum between a monsoon index and the annual maxi-mum discharge at Kratie. The WNPM index and annual max-imum discharge are significantly in phase between the peri-ods of 8 to 12 yr. In this kind of plot, arrows show the angle between the two periodic signals (arrow to the right means 0 radian; thick black contours enclose times and frequen-cies with significant phase coherence). In the first and last ten years of the timeseries, the phase agreement spans from periods of 2 to 12 yr. In contrast, the IM index hardly shows any frequency coherent regions with phase locking.
Further, as seen in the middle panel, the variance of the WNPM index modulates approximately the variance of the annual maximum discharge at Kratie at subdecadal scales. The JJASON average discharge presents a weaker phase locking during the whole time domain, but the same en-hanced periods during the first and last ten years of the time series. This means that for decades with greater variance there is a stronger correlation between both indexes (Delgado et al., 2012), supporting the hypothesis that the enhance-ments of variance are a key to understand the link between the monsoon and the Mekong flood regime.
To validate the results obtained for discharge, precipitation from the GPCC dataset was used to compute a correlation between summer rainfall and the two monsoon indexes. As seen in Fig. 5a, the Western Pacific circulation is responsi-ble for forcing rainfall over the area that contributes most to the discharge in the Mekong delta. This region, identified in MRC (2005) as the subbasins draining the region along the border between Laos and Vietnam, generate monthly runoffs that have been estimated to be as high as 400 mm month−1 in July and August (Costa-Cabral et al., 2007); MRC (2005)
Vientiane
Thakhek
Mukdahan
Pakse
Stung Treng
Kratie
Correlation (WNPMI and JJASON discharge)
0.1 0.2 0.3 0.4 0.5 0.6
Fig. 6. The line shows the north-south evolution of the Pearson
cor-relation between the JJASON average discharge and the WNPM index.
places this value at more than 2500 mm yr−1. Enhancements in either the intensity of the circulation or in its interannual variance are thus likely to have consequences for the flood hazard.
The influence of the Indian monsoon component in precip-itation is less homogeneous and confined to certain regions like upstream of the border between China and Laos (Fig. 5b) or a smaller region confined to the Tonle Sap basin (central Cambodia). In these regions the correlation of precipitation with the ISM is shown to be strongly negative. Other smaller regions, like the southeastern edge of the basin or the south-western part of the Mekong delta, present a strong positive correlation. However, uncertainty in the precipitation dataset is high, due to a very heterogenous and sparse distribution of rainfall gages. In this sense, using discharge data along the river is preferred. To find out if the north-south spatial pattern described affects the correlation between the WNPM inten-sity and the JJASON average discharge, the Pearson correla-tion between the two variables was calculated.
The result is plotted in Fig. 6 and reveals an increasing cor-relation from north to south, althought the best corcor-relation is still lower than 0.6 (significant at the 99 % level down-stream of Mukdahan). This corroborates the hypothesis of the Mekong basin being a transition zone between two dif-ferent monsoon regions, which is also suggested by Wang (2002). It was not possible to correlate the IM index with dis-charge. The correlation levels were below 0.1, which reveals that the interannual variability of floods in the lower Mekong is not modulated by the Indian Ocean monsoon circulation.
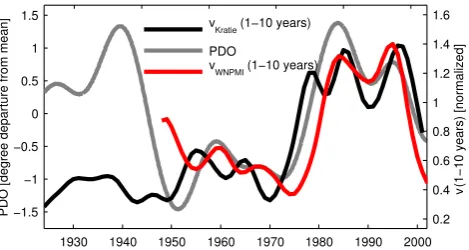
[image:6.595.328.526.65.177.2]The mechanism suggested by Chan (2005), by which a combination of the PDO and ENSO modulates precipita-tion in Southern China during the monsoon months could not be found when using the WNPMI or discharge in the Mekong. The relationship in the case of the Mekong may be more complex, due to its location in a transition zone be-tween two monsoon circulations (McGregor and Nieuwolt, 1998). We found, however, a relationship between the sub-decadal variance of the WNPMI and the PDO intensity that has important consequences for flood hazard in the Mekong, which is seen in Fig. 7.
In the second half of the 20th century, Fig. 7 shows that the WNPMI subdecadal variance enhancements followed closely the PDO (here a lowpass filter was applied to the PDO). This could mean that the regime shift introduced by the PDO may be also present in the monsoon. In fact, sev-eral authors have argued in favor of this monsoon shift. In this paper, we showed that this shift is present not only in the monsoon index but also in the discharge time series of the Mekong (Fig. 3). The shift disappears in the upstream part of the basin, confirming the hypothesis that the precipitation regime in this area is mostly dominated by circulation pat-terns other than the WNPM.
The hypothesis that a part of the discharge variability may be explained by a measurable large-scale climate index is a very useful result for estimating flood hazard. The relation-ship should be kept in mind in future investigations: a val-idation of this hypothesis is still necessary and could only be achieved with longer time series, for example from proxy records and climate modeling.
Other atmospheric and oceanic circulations interact with the intensity of rainfall over the Mekong basin. Years of en-hanced WNP monsoon show a similar wind anomaly to a positive Indian Ocean Dipole (IOD) oscillation in the region west of Sumatra (Saji et al., 1999; Wang et al., 2001). The years of exceptional anomalies of the two circulations do not completely match, though. As an example, 1961, 1978 or 1990 were years of increased strength of the WNP mon-soon (Fig. 4), but no significant event on the IOD.
The correlations found are not enough to create a re-gressive model of annual maximum discharge in the lower Mekong River. However, in the frequency domain, the link between the WNPMI and the annual maximum discharge is significant on the decadal scale, as seen in Fig. 4. Enhance-ments in the variance of both signals occur in the 1970s and remain for the rest of the 20th century. Other drivers for the enhancements in variance cannot be ruled out completely: Lacombe et al. (2010) showed that the massive deforesta-tion in Southern Laos during the Vietnam War (caused by bombing between 1965 and 1973) was a driver for increas-ing runoff yields. Dam construction in the upper Mekong basin could have had important effects on the flood regime, although it is unlikely that they would have affected down-stream stations like Kratie during the flood season (Lu and Siew, 2006), and moreover, dam construction would tend to
1930 1940 1950 1960 1970 1980 1990 2000 −1.5
−1 −0.5 0 0.5 1 1.5
PD
O
[degree departure
from mean]
0.2 0.4 0.6 0.8 1 1.2 1.4 1.6
v
(1−10 years) [normalized]
vKratie(1−10 years)
PDO
[image:7.595.311.546.62.187.2]vWNPMI(1−10 years)
Fig. 7. The interdecadal mode of the Pacific Decadal Oscillation
resembles the enhancements of the WNPMI subdecadal variance. The famous 1976 regime shift is also detectable in the JJASON dis-charge at Kratie, as depicted in the figure.
decrease the variability of flood magnitude. New dams are already planned for the lower Mekong River (Grumbine and Xu, 2011). A conclusive process based study about the ef-fects of these drivers in the Mekong flood regime is still necessary.
4 Conclusions
In this paper, a link between monsoon variance and flood variance in the lower Mekong river was quantified. The spec-tra of both interannual monsoon and flood peak was shown to be phase coherent in the subdecadal scale. By locating and quantifying variance enhancements in the flood discharge time series, it was possible to relate flood variance with the interannual variability of the Western North Pacific mon-soon. The variability of the Indian monsoon was found to have less influence on the interannual flood regime of the lower Mekong than its Western Pacific counterpart. In the northern part of the basin, the ISM showed a stronger signa-ture in the summer precipitation. The mechanism by which a strong ISM reduces summer precipitation in this confined re-gion is still not clear. In the southern and eastern parts of the Mekong basin a clear influence of the Western Pacific mon-soon was identified. The adjacent Western Pacific circulation forces a moist surface level flow from the Indian Ocean and maritime continent that contributes to most of the summer rainfall in this region.
Additionally, the hypothesis that the Pacific Decadal Os-cillation plays a role in enhancing the interannual variabil-ity of the WNPM was strengthened. During the last 50 yr of the 20th century, the WNPM has been more variable during warm phases of the PDO. Further model based investigations are necessary to clarify the phenomenon.
of stationarity in flood hazard assessment. A climate-driven nonstationary flood frequency model is therefore necessary, especially when the future development of flood hazard is to be estimated.
Longer measured time series are needed to better define the linkages between the Western Pacific monsoon and flood variability. In the absence of sufficient data, the method of choice is to model the physical processes and from long model runs to identify the interactions between the large scale processes. An alternative is to use available proxy datasets that represent past climates. Both directions will in the future likely open new perspectives in the hydrology of this region.
Acknowledgements. This work was financed by the
WIS-DOM project, a german-vietnamese initiative (http: //www.wisdom.caf.dlr.de) and the Fundac¸˜ao para a Ciˆencia e Tecnologia of the portuguese ministry of Education and Science. We acknowledge the Mekong River Commission for providing data on discharge and precipitation in the basin.
Edited by: L. A. Swatuk
References
Bakker, K.: The politics of hydropower: developing the Mekong, Polit. Geogr., 18, 209–232, 1999.
Buckley, B. M., Anchukaitis, K. J., Penny, D., Fletcher, R., Cook, E. R., Sano, M., Nam, L. C., Wichienkeeo, A., Minh, T. T., and Hong, T. M.: Climate as a contributing factor in the demise of Angkor, Cambodia, Proceedings of the National Academy of Sciences, 107, 6748–6752, doi:10.1073/pnas.0910827107, 2010. Campbell, I.: Perceptions, data, and river management: Lessons from the Mekong River, Water Resour. Res., 43, W02407, doi:10.1029/2006WR005130, 2007.
Chan, J. C. L.: PDO, ENSO and the early summer mon-soon rainfall over south China, Geophys. Res. Lett., 32, 1–5, doi:10.1029/2004GL022015, 2005.
Chase, T. N., Knaff, J. A., and Kalnay, E.: Changes in Global Mon-soon Circulations Since 1950, Nat. Hazards, 29, 229–254, 2003. Cherchi, A. and Navarra, A.: Reproducibility and predictability of the Asian summer monsoon in the ECHAM4-GCM, Clim. Dy-nam., 20, 365–379, doi:10.1007/s00382-002-0280-6, 2003. Cook, E. R., Anchukaitis, K. J., Buckley, B. M., D’Arrigo, R.,
Ja-coby, G. C., and Wright, W. E.: Asian Monsoon Failure and Megadrought During the Last Millennium, Science, 328, 486– 489, doi:10.1126/science.1185188, 2010.
Costa-Cabral, M. C., Richey, J. E., Goteti, G., Lettenmaier, D. P., Feldkoetter, C., and Snidvongs, A.: Landscape structure and use, climate, and water movement in the Mekong River basin, Hydrol. Process., 22, 1731–1746, 2007.
Delgado, J. M., Apel, H., and Merz, B.: Flood trends and variabil-ity in the Mekong river, Hydrol. Earth Syst. Sci., 14, 407–418, doi:10.5194/hess-14-407-2010, 2010.
Delgado, J. M., Merz, B., and Apel, H.: Monsoon variability and the Mekong flood regime (accepted), in: The Mekong Delta System – Interdisciplinary Analysis of a River Delta, edited by: Renaud,
F. and K¨unzer, C., chap. 7, Springer, Berlin, Heidelberg, Ger-many, 2012.
Dung, N. V.: Multi-objective automatic calibration of hydrody-namic models – development of the concept and an application in the Mekong Delta, Ph.D. thesis, University of Stuttgart, Stuttgart, Germany, 2011.
Dung, N. V., Merz, B., B´ardossy, A., Thang, T. D., and Apel, H.: Multi-objective automatic calibration of hydrodynamic models utilizing inundation maps and gauge data, Hydrol. Earth Syst. Sci., 15, 1339–1354, doi:10.5194/hess-15-1339-2011, 2011. Goswami, B. N.: The Asian monsoon: Interdecadal variability, in:
The Asian Monsoon, edited by Wang, B., chap. 7, Springer, Berlin, Heidelberg, Germany, 295–327, 2006.
Grinsted, A., Moore, J. C., and Jevrejeva, S.: Application of the cross wavelet transform and wavelet coherence to geophys-ical time series, Nonlin. Processes Geophys., 11, 561–566, doi:10.5194/npg-11-561-2004, 2004.
Grumbine, R. E. and Xu, J.: Mekong Hydropower Development, Science, 332, 178–179, 2011.
Holmes, J. A., Cook, E. R., and Yang, B.: Climate change over the past 2000 years in Western China, Quatern. Int., 194, 91–107, doi:10.1016/j.quaint.2007.10.013, 2009.
Hosking, J. R. M. and Wallis, J. R.: Regional frequency analysis, Cambridge University Press, Cambridge, 1997.
K¨ak¨onen, M.: Mekong Delta at the Crossroads: More Control or Adaptation, Ambio, 37, 205–212, 2008.
Kerr, R. A.: Unmasking a shifty climate system., Science, 255, 1508–1510, 1992.
Krishnan, R. and Sugi, M.: Pacific decadal oscillation and variabil-ity of the Indian summer monsoon rainfall, Clim. Dynam., 21, 233–242, doi:10.1007/s00382-003-0330-8, 2003.
Lacombe, G., Pierret, A., Hoanh, C. T., Sengtaheuanghoung, O., and Noble, A. D.: Conflict, migration and land-cover changes in Indochina: a hydrological assessment, Ecohydrology, 3, 382– 391, doi:10.1002/eco.166, 2010.
Lau, N.-C. and Wang, B.: Interactions between the Asian monsoon and the El Ni˜no/Southern Oscillation, in: The Asian Monsoon, edited by: Wang, B., chap. 12, Springer, Berlin, Heidelberg, 479– 512, 2006.
Lu, X. X. and Siew, R. Y.: Water discharge and sediment flux changes over the past decades in the Lower Mekong River: pos-sible impacts of the Chinese dams, Hydrol. Earth Syst. Sci., 10, 181–195, doi:10.5194/hess-10-181-2006, 2006.
Mantua, N. J., Hare, S. R., Zhang, Y., Wallace, J. M., and Francis, R. C.: A Pacific Interdecadal Climate Oscillation with Impacts on Salmon Production, B. Am. Meteorol. Soc., 78, 1069–1079, doi:10.1175/1520-0477(1997)078<1069:APICOW>2.0.CO;2, 1997.
McGregor, G. R. and Nieuwolt, S.: Tropical climatology: an intro-duction to the climates of the low latitudes, Wiley, 1998. MRC: Overview of the Hydrology of the Mekong Basin, Tech. rep.,
Mekong River Commission, Vientiane, 2005.
NCEP-CDAS: Winds & Water Vapor Flux and Divergence, http://www.cpc.ncep.noaa.gov/products/Global Monsoons/ Asian Monsoons/circulation monitoring.shtml, last access: 11 October 2011.
Paeth, H., Scholten, A., Friedricjs, P., and Hense, A.: Uncertainties in climate change prediction: El Ni{˜n}o-Southern Oscillation and monsoons, Global Planet. Change, 60, 265–288, 2008.
Peel, M. C., Finlayson, B. L., and McMahon, T. A.: Updated world map of the K¨oppen-Geiger climate classification, Hy-drol. Earth Syst. Sci., 11, 1633–1644, doi:10.5194/hess-11-1633-2007, 2007.
Percival, D. B.: On estimation of the wavelet variance, Biometrika, 3, 619–631, 1995.
Percival, D. B. and Walden, A. T.: Wavelet Methods for Time series Analysis, Cambridge University Press, Cambridge, 2000. Percival, D. B., Overland, J. E., and Mofjeld, H. O.: Interpretation
of North Pacific variability as a short- and long-memory process, J. Climate, 14, 4545–4559, 2001.
Saji, N. H., Goswami, B. N., Vinayachandran, P. N., and Yamagata, T.: A dipole mode in the tropical Indian Ocean., Nature, 401, 360–363, doi:10.1038/43854, 1999.
Shukla, J.: Monsoon mysteries., Science, 318, 204–205, doi:10.1126/science.1150045, 2007.
Torrence, C. and Compo, G. P.: A practical guide to wavelet analy-sis, B. Am. Meteorol. Soc., 79, 61–78, 1998.
Wang, B.: Rainy Season of the Asian–Pacific Summer Monsoon, J. Climate, 15, 386–398, doi:10.1175/1520-0442(2002)015<0386:RSOTAP>2.0.CO;2, 2002.
Wang, B.: Fundamental challenge in simulation and prediction of summer monsoon rainfall, Geophys. Res. Lett., 32, 2–5, doi:10.1029/2005GL022734, 2005.
Wang, B. and Fan, Z.: Choice of South Asian Summer Monsoon Indices, B. Am. Meteorol. Soc., 80, 629–638, 1999.
Wang, B., Wu, R., and Lau, K.-M.: Interannual Variability of the Asian Summer Monsoon: Contrasts between the Indian and the Western North Pacific-East Asian Monsoons, J. Climate, 14, 4073–4090, 2001.
Whitcher, B., Byers, S. D., Guttorp, P., and Percival, D. B.: Test-ing for homogeneity of variance in time series: Long memory, wavelets, and the Nile River, Water Resour. Res., 38, 1054–1069, doi:10.1029/2001WR000509, 2002.