BFSSGA: Enhancing the Performance of Genetic
Algorithm using Boosted Filtering Approach
Shaikh Jeeshan Kabeer
Moin Mahmud Tanvee
Mohammad Arifur
Rahman
Abdul Mottalib
Md. Hasanul Kabir
Department of Computer Science and Engineering Islamic University of Technology
Gazipur, Bangladesh
ABSTRACT
Modern microarray chips can hold gene information from thousands of genes and hundreds of individuals and the main challenge of an effective feature selection method is to identify most useful genes from the whole dataset. Removal of less informative genes helps to alleviate the effects of noise and redundancy and simplifies the task of disease classification and prediction of medical conditions such as cancer. Genetic Algorithm (GA) based wrapper model performs well but suffers from over-fitting problem and the initial population is large and random. Traditional approaches use a filter based preprocessing step to reduce the dimension of the data on which GA operates and as filtering methods on its own has shown to introduce redundant features, in this paper Boosted Feature Subset Selection (BFSS) which is a boosted t-score filter method, is used as a preprocessing step. The gene subset provided by BFSS is fed to a Genetic Algorithm which reduces the feature subset in smaller numbers and helps to generate a better optimal subset of genes. The proposed hybrid approach is applied on leukemia, colon and lung cancer benchmarked datasets and have shown better results than other well-known approaches.
General Terms
Pattern Recognition, Feature Selection, Microarray Data Analysis, Evolutionary Algorithm.
Keywords
Microarray, Feature Selection, Hybrid, GA, BFSS.
1.
INTRODUCTION
Microarray technology enables representation of expression value from thousands of genes. The challenge is to identify relevant bio markers using appropriate feature selection techniques from the vast array of data to evaluate the medical condition of an individual i.e sample [1]. In the collection of expression values also termed as datasets, number of genes usually ranges in the thousands while the number of samples are in the low hundreds if not less making the task of analysis and recognition more challenging [2] since number of samples for testing and training becomes constrained. Irrelevant data needs to be removed from the dataset to alleviate the negative effects of noise and redundancy, which has adverse effects on the classification accuracy [3-4].
In microarray gene analysis feature selection can be divided into three broad approaches: filtering, wrapper model and embedded method. Filtering techniques associate parametric
or nonparametric scores to each feature [5] and the selection process is based on the ranking of the scores. The features or genes with appropriate scores are selected which is independent of the classification process and does not consider the interaction existing among the features. Wrapper methods on the other hand search through the feature space and selects features based on the selection algorithm. The selections are evaluated collectively against a classifier built into the wrapper model and selections are modified in iteratively until the required accuracy has been attained [6, 7]. As the selection process is based on the performance of the features selected on the classifier, features with higher classification accuracies can be selected and thus can take into consideration and allows the interaction existing among the genes to be taken into consideration. In embedded method the searching and evaluation of the selections are not distinct and are combined into the classifier construction [8].
Filter methods are easier and simpler to implement but they do not consider the combined classification power resulting from gene interactions. Interactions among genes are an important consideration as biological states of individuals can be influenced by the interaction taking place inside the body. Wrapper methods on the other hand takes the relationship existing among genes into consideration but it suffers from overfitting problem; a condition where the classification model does not perform well for novel patterns [8]. Hybrid frameworks combining both filter and wrapper methods are thus becoming popular as it is able to harness the advantage that each approach provides. An example is [9] which uses filtering as the preprocessor for partial feature elimination and a Genetic Algorithm (GA) based wrapper model traverses through the remaining features to give the final gene subset. Traditional filtering preprocessing step eliminates features but filtering on its own shows some problems. It does not consider the correlation existing among genes and often includes noisy or redundant genes in its selection. The remaining features which serves as the initial population for GA is thus noisy, redundant and large. The final gene subset that will be given by GA will therefore not be able to provide the optimum classification accuracy.
related works. Section 3 illustrates the proposed framework in detail. Section 4 shows the results of the proposed framework on ALL, Lung and Colon cancer datasets while Section 5 concludes the study with future scopes and conclusion.
2.
RELATED WORK
Genetic Algorithm (GA) falls under the category of Evolutionary Algorithm (EA) and is inspired by the evolution theory of Charles Darwin. GA starts with an initial population of candidate solutions and it progresses through a series of operators per iteration, generating a new solution in each pass. The generations are modified by the operators in the subsequent iteration gradually guiding towards the optimal solution [10]. The operators allow GA to heuristically traverse the solution space and in light of the wrapper model the solution space is the feature space consisting of genes from the dataset. Non heuristic brute force approach would require that the entire feature space be traversed on a “one by one” basis resulting in high space and time complexity.
GA fosters an environment which is defined by the parameters of the problem domain [11]. For microarray data analysis the problem space will be the set of all genes from the dataset. GA would initially select multiple solutions randomly from the feature space to create a population. Each solution is termed as a chromosome or string, which is composed of a series of genes selected from the geneset. Each chromosome or string S is represented as
1 2 3
{ ,
,
.... }
nS
s s
s
s
, where eachs
i represents a gene selected from the dataset. The population contains a number of such strings and each is evaluated against a fitness function to determine solutions are to be retained in the population and which to be discarded [12]. The fitness function ensures that only the stronger genes are retained while the weaker ones are discarded. The retained chromosomes are subjected to the genetic operators which generates new chromosomes from the retained chromosomes. This replenishes the population to the previous state before the weak chromosomes were discarded [10]. This population or generation is forwarded to the next cycle where the entire procedure is repeated and in this manner the iterations proceed until the termination condition is reached.Many GA based wrapper models are in use, the most popular of which is the GASVM method which uses GA to select genes and SVM to evaluate goodness of the selection as done in [13]. Reference [14] simultaneously optimized genes and parameters in their approach. Another methodology implemented in [15] reduced feature dimension by a preprocessing step. However these versions of GA could not efficiently produce an optimal subset of informative genes and suffer from over fitting problem as stated in the review paper [1]. Because GA based wrapper models are inherently computationally expensive primarily due to the large and random initial population, a lightweight preprocessing step is likely to provide more efficient results. Hence filter based method is an ideal choice for any hybrid framework. An approach is proposed by [16], where gain ratio (GR) or information gain (IG) has been proposed. However the filter based preprocessing step does not consider the correlation between genes being selected into the subset from the original dataset. The inclusion of noisy and redundant data would reduce the accuracy of the results and decrease the probability of finding an optimal small subset of features as the initial population of GA would contain noisy and redundant data.
Coupled with the random, noisy and redundant initial population problem, binary chromosome representation in traditional GA limited the feature space that could be traversed and posed an overfitting issue. Using integer chromosome representation, selecting appropriate genetic operators and by developing a proper fitness function these problems may be overcome.
Hence in the approach proposed here filter and wrapper methods have been combined into a hybrid framework where the above problems are addressed. BFSS which would be used as a partial feature elimination step would ensure that the initial population contains genes which have been selected based on their interaction and also noisy and redundant features have been removed. However BFSS cannot fully remove all the noisy and irrelevant genes present in the dataset which is common to all filter based selection techniques [9], in addition it does not consider the classification accuracy of its selection and cannot fully utilize the predictive power of a combination of genes. Therefore final subset of genes would be obtained using the GA implemented with appropriate genetic operators and fitness functions. The detail of the proposed framework BFSSGA is elaborated in the next section.
3.
PROPOSED METHOD
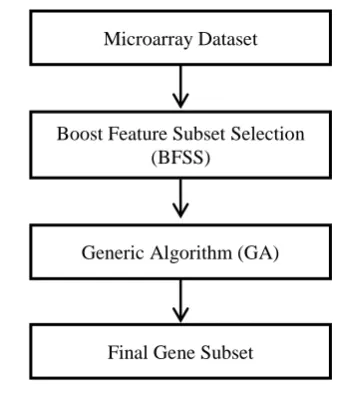
In this section the proposed hybrid framework which has been named BFSSGA will be elaborated. Fig 1 shows the overall methodology. From the entire geneset BFSS will output roughly 30% of the “good” genes. GA will then use the output of BFSS to generate the final subset of genes.
3.1
BFSS (Boost Feature Subset Selection)
Microarray datasetE
as( , , , )
E
G S L E
(1)
where
G
{ ,
g g
1 2
g
n}
is the set of all genes,1 2
{
m}
S
s s
s
is the set of all samples and1 2
{ ,
l}
[image:2.595.327.496.510.711.2]L
l l
l
is the set of all class labels of the dataset.Fig 1: BFSSGA Flowchart
L
is a functionS
L
such that fors
S L
, s
L
is the class label for s andE
is a functionG
X
S
R
, whereR
Microarray Dataset
Boost Feature Subset Selection (BFSS)
Generic Algorithm (GA)
is the set of all real numbers and for
s
S
and, ( , )
g
G E g s
is the expression value of geneg
in sample . Boost Feature Subset Selection (BFSS) algorithm beginsby generating sample set called the bootstrap sample set of size , which is a multiset of samples obtained by
random sampling with replacement from , which means
that the same sample may appear more than once in The probability of each sample being sampled is
( )
( ).
s S
b M S
P S m
(2)where
M S s
( ),
S
is the multiplicity of items, which isinitialized as
1/
m
. UsingS
M the bootstrapB
is generated by random sampling usingp s
( )
, where( ,
M, L, E)
B
G S
(3)
F score is calculated on bootstrap
B
where the best score is marked asF
'
and the top ranked geneg
corresponding toF' is added toG
'
, whereG
'
is the set of genes selected by BFSS. Next, the set of samples for whichg
does not perform well i.e the worst set of samplesS
worstfor the currently selected geneg
is identified.S
worstof size
with respect toB
and single gene based score F is defined as the muliset
and
arg m x
a
,
MM
S S S
F E g S
S
(4)
where
S
M
S
indicates a set by removingS
fromS
Mwhich can also be referred to as the best set of samples. The probability of the remaining set of samples i.e the best set of samples are reduced to allow subsequent iterations to select genes which performs well on the current worst set of samples.
g
is marked as selected and not evaluated again by the algorithm. BFSS continues to iterate in a similar manner until about 30% ofG
have been selected.3.2
Genetic Algorithm (GA)
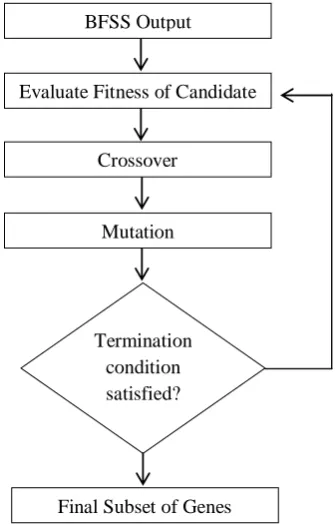
After BFSS has produced its output GA will start execution as illustrated in Fig 2.GA works in an iterative manner until a required number of genes have been found. GA begins execution using
G
'
as its initial population. The population is divided into chromosomes and GA traverses through the initial population in cycle c to generates a potential subset of genesP
,1 2 3
{
g,
g,
g gn}
P
P
P
P
P
(5)
where
P
gi
G
'
. FromP
GA selectsS
number of genes such thatS
P
, to be used in the next cycle
c
1
where the selection process is based on the fitness function (6). In (6) x represents the chromosome under consideration, is the classification accuracy of chromosome, is the total number of genes in the dataset and is the number of genes in chromosome. An important point to stress here is that GA selects those chromosomes among the potential subsets which provide higher accuracy values using fewer genes asillustrated by the fitness function which has been used in the hybrid framework.
*((
( )) /
)
f x
A x
M
R x
M
(6)
The chromosomewhich GA evaluates is an integer chromosome representation because in binary representation the size of the chromosomex is defined by the total number of genes in the dataset as well as other problems as stated in [9]. Integer chromosome representation can overcome this problem as the size is independent of the total number of genes. Hence the chromosome representation is as follows
1, 1
[image:3.595.344.512.275.538.2][g g gn] where each
g
j is an integer value representing a gene index in the original dataset, jis the index of the gene index in the chromosome andn represents the number of genes selected from. In this implementation the two point crossover method is used and the mutation process is random.Fig 2: GA Flowchart
4.
EXPERIMENTAL ANALYSIS
4.1
Dataset Details
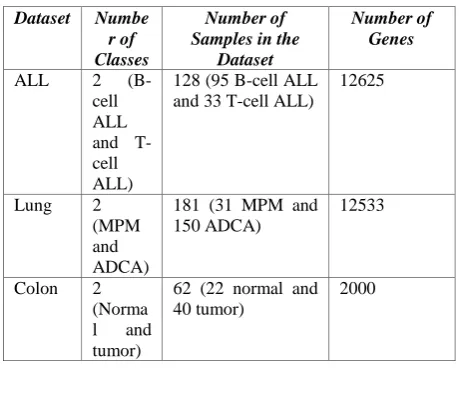
For The proposed BFSSGA framework was applied on Acute Lymphoblastic leukemia cancer (ALL), Lung cancer and Colon cancer datasets. ALL dataset contains 12625 genes representing 128 tissue samples (95 B-cell and 33 T-cell). In the Lung cancer dataset there are 181 tissue samples (31 MPM and 150 ADCA) and each sample is described by 12533 genes. Colon Cancer dataset contains 62 samples among which are 40 tumor biopsies (labeled as "negative") and 22 normal biopsies (labeled as "positive"). 2000 out of around 6500 genes were selected for sample representation based on the confidence in the measured expression levels. Table I shows the details of the three datasets under consideration.
4.2
Performance Analysis
The main purpose of using BFSS is to provide a better initial population to Genetic Algorithm rather than generating it on s
M
S
b
m
S
.
MS
s
S
BFSS Output
Evaluate Fitness of Candidate solution
Crossover
Mutation
Termination condition satisfied?
randomly. This will help to avoid early convergence and over-fitting problems. In this implementation of BFSS, t-Score is used to rank genes for a particular sample.
Table II shows BFSS provided 4000, 4000 and 1500 genes for Leukemia, Lung and Colon cancer datasets respectively. These genes are neither generated randomly nor completely based on ranking methods rather they are generated by BFSS algorithm where correlations between genes are considered which in turn results in better initial population to be used by GA in next phase. Two classifiers namely KNN and SVM has been integrated with BFSSGA framework in order to exploit diversity of the outcomes. The Genetic Algorithm then operates on the initial population which is the BFSS output for each of the datasets.
Table 1.number of genes in datasets
Dataset Numbe
r of Classes
Number of Samples in the
Dataset
Number of Genes
ALL 2
(B-cell ALL and T-cell ALL)
128 (95 B-cell ALL and 33 T-cell ALL)
12625
Lung 2 (MPM and ADCA)
181 (31 MPM and 150 ADCA)
12533
Colon 2 (Norma l and tumor)
62 (22 normal and 40 tumor)
[image:4.595.52.282.250.452.2]2000
Table 2. BFSS OUTPUT
Datasets Original Number
Of Genes
BFSS Output Leukemia
(ALL) Cancer
12625 4000
Lung Cancer 12533 4000
Colon 2000 1500
The termination criteria was set to a specific number of genes as the final output which means GA will continue to generate new generations through the process of selection, crossover and mutation until the total number of genes is reduced to or less the number set as the termination criterion. Both BFSSGA and traditional GA were run ten different times with distinct termination conditions which were kept same for both to ensure proper comparison ground.
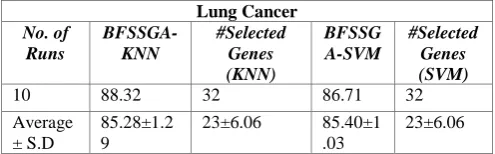
Table III, IV and V shows the performance of BFSSGA on Leukemia, Colon and Lung Cancer dataset where the average and standard deviation of the results are stated. Table III shows the best result is given by BFSSGA-KNN with 88.26% classification accuracy with only 30 genes. On the other hand better average accuracy was given by BFSSGA-SVM which is 85.91% with standard deviation of 0.96. Table IV and Table V show the result for Lung and Colon cancer datasets respectively. Table IV shows 88.32% classification accuracy with only 32 genes, the best result for Lung cancer dataset. Table V shows the best result of 87.54% with only 22 genes for Colon cancer dataset.
5.
COMPARATIVE ANALYSIS
[image:4.595.304.553.298.529.2]In this section comparison of Boost Feature Subset Selection Genetic Algorithm (BFSSGA) with other evolutionary approaches of traditional Genetic Algorithm (GA), Ant Colony Optimization (ACO) and Particle Swarm Optimization (PSO) is done. In each of the evolutionary the results for Leukemia (ALL), Lung and Colon cancer datasets are analyzed and compared. Table 6 represents the tabular form of the comparison which includes the average classification accuracy values, standard deviation from average values and the highest classification accuracy values. From Table 6 shows that the proposed approach BFSSGA provides both the highest classification accuracies and better average classification accuracies for all the three cancer datasets. A simple observation of Table 6 states that BFSSGA-KNN provides highest values for Leukemia (ALL) and Lung Cancer datasets but BFSSGA-SVM not only provides the highest accuracy value for Colon cancer dataset but also better average accuracy values for all three datasets.
Table 3.Classification Accuracies (%) and Number of Genes Selected by Boost Feature Subset Selection Genetic
Algorithm (BFSSGA) For Leukemia (ALL) Cancer Dataset.
Leukemia Cancer No. of
Runs
BFSSGA-KNN
#Selected Genes (KNN)
BFSSG A-SVM
#Selected Genes (SVM)
1 82.93 14 84.19 14
2 84.79 16 85.37 16
3 85.17 18 86.91 18
4 87.21 20 86.31 20
5 86.13 22 85.13 22
6 84.49 24 86.41 24
7 86.57 26 85.93 26
8 86.59 28 86.31 28
9 88.26 30 87.47 30
10 85.41 32 85.19 32
Average ± S.D
85.76±1.5 4
23±6.06 85.91±0 .96
23±6.06
Table 4. Classification Accuracies (%) and Number of Genes Selected by Boost Feature Subset Selection Genetic
Algorithm (BFSSGA) For Lung Cancer Dataset.
Lung Cancer No. of
Runs
BFSSGA-KNN
#Selected Genes (KNN)
BFSSG A-SVM
#Selected Genes (SVM)
1 85.39 14 85.51 14
2 84.16 16 86.64 16
3 85.27 18 85.32 18
4 84.96 20 83.69 20
5 86.49 22 84.43 22
6 84.31 24 86.12 24
7 84.78 26 84.28 26
8 83.96 28 85.16 28
[image:4.595.302.553.312.533.2]Lung Cancer No. of
Runs
BFSSGA-KNN
#Selected Genes (KNN)
BFSSG A-SVM
#Selected Genes (SVM)
10 88.32 32 86.71 32
Average ± S.D
85.28±1.2 9
23±6.06 85.40±1 .03
23±6.06
[image:5.595.43.291.72.149.2]To make the process of comparison easier a graph based comparison is done. The comparison among different methods is graphically represented in Fig. 3, Fig 4. and Fig. 5 for leukemia, lung and colon cancer datasets respectively where X-axis represents number of selected genes and Y-axis represent accuracies (%). Each of the plotted points represents result of separate runs which are independent of each other thus it will be difficult to find any specific pattern within the graphs. From each of these graphs it can be easily depicted that for most of the cases both the BFSSGA-KNN and BFSSGA-SVM provides better accuracies comparing with traditional GA for the same number of selected genes on same dataset.
Table 5.Classification Accuracies (%) and Number of Genes Selected by Boost Feature Subset Selection Genetic
Algorithm (BFSSGA) For Colon Cancer Dataset.
Lung Cancer No. of
Runs
BFSSGA-KNN
#Selected Genes (KNN)
BFSSG A-SVM
#Selected Genes (SVM)
1 83.73 14 84.83 14
2 84.43 16 83.93 16
3 83.98 18 85.49 18
4 85.94 20 86.31 20
5 85.54 22 87.54 22
6 86.32 24 86.89 24
7 87.27 26 86.93 26
8 86.64 28 85.82 28
9 85.81 30 85.37 30
10 85.91 32 86.51 32
Average ± S.D
85.56±1.1 6
23±6.06 85.96±1 .09
[image:5.595.326.535.247.354.2]23±6.06
Table 6.Comparison of accuracies (%) obtained by Boosted Cyclic GA and other related previous methods.
Dataset ACO PSO
GA-SVM
BFSS GA-KNN
BFSSG A-SVM
Leukemia (Average ±SD; The Best)
83.89 ----
84.22 ----
83.80± 2.14; 88.24
85.76± 1.54; 88.26
85.91± 0.96; 87.47 Colon
(Average ±SD; The Best)
76.87 ----
79.69 ----
83.48± 1.77; 86.27
85.56± 1.16; 87.27
85.96± 1.09; 87.54 Lung
(Average ±SD; The Best)
79.76 ----
80.09 ----
84.85± 1.54; 87.92
85.28± 1.29; 88.32
85.40± 1.03; 86.71
6.
CONCLUSION & FUTURE WORK
As the results show the proposed approach performs better than existing implementations of GA. The hybrid framework using BFSS provides GA with the appropriate initial population which aided with the proper GA parameters including the fitness function provided better results. The classification accuracy greatly improved as noisy and redundant genes was successfully removed. For future research, BFSSGA could be applied on other datasets and can be modified to be used in other fields of computing which deals with vast volumes of data. For further performance analysis the framework may be integrated with additional classifiers such as C4.5, Bayesian and others.Fig 3: Comparison Graph for Leukemia (ALL) Cancer Dataset
Fig 4:Comparison Graph for Lung Cancer Dataset
Fig 5:Comparison Graph for Colon Cancer Dataset 80
85 90
14 19 24 29
A
cc
u
rac
y
Number of Selected Genes
Lukemia Cancer
BFSSGA-KNN
BFSSGA-SVM
GA-SVM
82 84 86 88 90
14 19 24 29
A
cc
u
rac
y
Number of Selected Genes
Lung Cancer
BFSSGA-KNN
BFSSGA-SVM
GA-SVM
80 85 90
14 19 24 29
A
cc
u
rac
y
Number of Selected Genes
Colon Cancer
BFSSGA-KNN
BFSSGA-SVM
[image:5.595.43.292.379.585.2]7.
REFERENCES
[1] Li L, Jiang W, Li X, Moser KL, Guo Z, Du L, Wang Q, Topol EJ, Wang Q, Rao S, “A robust hybrid between genetic algorithm and support vector machine for extracting an optimal feature gene subset”, Genomics, vol 85, pp 16-23, 2005.
[2] XianXu, Aidong Zhang, “Boost Feature Subset Selection: A New Gene Selection Algorithm for Microarray Dataset”, International Conference on Computational Science 2006 (ICCS 2006), Lecture Notes in Computer Science, vol. 3992/2006, pp 670-677, 2006.
[3] T.R.Golub, D.K.Slonim, P.Tamayo, C.Huard, M.GaasenBeek, J.P.Mesirov, H.Coller, M.L.Loh, J.R.Downing, M.A.Caligiuri, C.D.Blomfield, E.S.Lander, “Molecular classification of cancer: class discovery and class prediction by gene-expression monitoring, Science”, vol. 286, 531–537, 1999.
[4] Shital Shah, Andrew Kusiak, “Cancer gene search with data-mining and genetic algorithms”, Computers in Biology and Medicine, vol. 37, pp 251-261, 2007.
[5] P.J.Park, M.Pagano, M.Bonetti, “A nonparametric scoring algorithm for identifying informative genes from microarray data”, Pac. Symp. Biocomput. , pp 52–63, 2001.
[6] T.Jirapech-Umpai, S.Aitken “Feature selection and classification for microarray data analysis: evolutionary methods for identifying predictive genes”, BMC Bioinformatics, vol. 6, 2005.
[7] L. Li, C.Weinberg,T.Darden, L.Pedersen, “Gene selection for sample classification based on gene expression data : study of sensitivity to choice of parameters of the GA/KNN method”, Bioinformatics, vol. 17 pp 1131–1142, 2001.
[8] YvanSaeys, I˜nakiInza and Pedro Larra˜naga, “A review of feature selection techniques in bioinformatics”, Oxford Journals – Bioformatics, vol. 23, pp 2507-2517, June 2007.
[9] MohdSaberiMohamad, SigeruOmatu, SafaaiDeris, Michifumi Yoshioka, “Selecting Informative Genes from Microarray Data by Using a Cyclic GA-based Method”, 2010 International Conference on Intelligent Systems, Modelling and Simulation, pp 15-20, Kuala Lampur, Jan 2010.
[10]Mitchell Melanie, “An Introduction to Genetic Algorithms”, MIT Press, 1999.
[11]Haupt,R.L. and Haupt,S.E, “Practical Genetic Algorithms”, Wiley, 1998.
[12]Ooi CH, Tan P, “Genetic algorithms applied to multi-class prediction for the analysis of gene expression data”, Oxford University Press, vol. 19 no 1, pp 37-44, 2003.
[13]G M. S. Mohamad, S. Omatu, S. Deris, M. F. Misman, and M. Yoshioka, “A Multi-objective Strategy in Genetic Algorithm for Gene Selection of Gene Expression Data,” International Journal of Artificial Life & Robotics, vol. 13, no. 2, pp. 410-413, 2009.
[14]H. L. Huang, F. L. Chang, “ESVM: Evolutionary Support Vector Machine for Automatic Feature Selection and Classification of Microarray Data,” Biosystems, vol. 90, pp. 516-528, 2007.
[15]S. Peng, Q. Xu, X. B. Ling, X. Peng, W. Du, and L. Chen, “Molecular Classification of Cancer Types from Microarray Data Using the Combination of Genetic Algorithms and Support Vector Machines,” FEBS Letters, vol. 555, pp. 358-362, 2003.
[16]Huijuan Lu, Wutao Chen, Xiaoping Ma, Mingyi Wang, Jinwei Zhang , "Model-free Gene Selection Using Genetic Algorithms ", JDCTA: International Journal of Digital Content Technology and its Applications, Vol. 5, No. 1, pp. 195-203, 2011.
[17]Feng Tan, Xuezheng Fu, Yanqing Zhang AnuG. Bourgeois, “A genetic algorithm-based method for feature subset selection”, Soft Computing - A Fusion of Foundations, Methodologies and Applications, Volume 12, pp 111-120, September 2007.
[18]LaetitiaJourdan, Clarisse Dhaenens, El-GhazaliTalbi, “ A Genetic Algorithm for Feature Selection in Data-Mining for Genetics”, 4th Metaheuristics International Conference [MIC'2001 Porto], Portugal, July 2001.
[19]Chien-Pang Lee,YunghoLeu, “A novel hybrid feature selection method for microarray data analysis”, Applied Soft Computing, vol. 11, pp 208–213, 2009.
[20]Isabelle Guyon, Andr´ eElisseeff, “An Introduction to Variable and Feature Selection”, Journal of Machine Learning Research, vol. 3, pp 1157-1182, 2003.
[21]K. E. Parsopoulos, D. K. Tasoulis, N. G. Pavlidis, V. P. Plagianakos and M. N. Vrahatis, “Vector evaluated differential evolution for multiobjective optimization”, In Congress on Evolutionary Computation (CEC 2004), Portland, Oregon, pp. 204-211, 2004.
[22]Rich Caruana, Virginia R. de Sa, “Benefitting from the Variables that Variable Selection Discards”, Journal of Machine Learning Research, vol. 3, pp 1245-1264, 2003.