Study of Meta,
Naïve
Bayes and Decision Tree
based Classifiers
Abhinay Bishnoi1, Deepak Sinwar2
1
M.Tech Scholar, 2Assistant Professor, Department of Computer Science & Engineering BRCM College of Engineering & Technology, Bahal
Abstract—Classification deals with the kind of data mining problem which are concerned with prediction. Its main task is to classify the data in order to make predictions about new data. In general Classification can be viewed as the action or process of classifying something. In Data mining one of the most common tasks is to build models for the prediction of the class of an object on the basis of its attributes. This paper has made a comparative study of various classification algorithms viz. Meta Classifiers, NaïveBayes and Decision Tree Based Classifiers. An experiment has been set up using different kinds of classification algorithms to test their performance. Theoretical analysis and experimental results will show that
‘Classification via Regression’ method has correctly classify all the instances, minimum errors are produced by ‘Decision Tree based Classifiers’, whereas ‘Naïve Bayes’ has classified all the instances in minimum time span.
Keywords-Classification, Meta Classifiers, NaïveBayes, Decision Tree, Datasets
I. INTRODUCTION
Classification is one of the best applications of machine learning algorithms, which applies to the general problem of supervised learning where a given set of training datasets is classified to one or more predefined categories. The main aim of classification is to classify the datasets; even when the class label of the dataset is unknown. This process can be related with the similar one i.e. prediction. As we know there are several applications of prediction i.e. weather forecasting. In prediction classification is used to predict the class of a particular instance of a dataset. We may use Clustering and Regression at some places to do the same task. As we know that Data mining is one of the essential step of the "Knowledge Discovery from Databases (KDD)" process, a pretty young and interdisciplinary field of computer science, is the process that attempts to discover interesting yet hidden patterns in large data sets. It utilizes methods at the intersection of artificial intelligence, machine learning, statistics, and database systems. The overall goal of the data mining process is to extract information from a data set and transform it into an understandable structure for further use. Aside from the raw analysis step, it involves database and data management ways, data processing, model and inference
considerations, complexity considerations, post processing of discovered structures, visualization, and online updating. Commonly used data mining tasks [1] are classified as:
Classification– is the task of generalizing well-known structure to apply to new data for which no classification is present. For example, classification of records on the bases of
the ‘class’ attribute. Prediction and Regression are also
information for marketing purposes. This is sometimes referred to as market basket analysis.
Meta-learning focuses on predicting the right algorithm for a particular problem based on characteristics of the dataset or on the basis of the performance of other learning algorithms. We may view such type of classification approaches in Meta-classification as Base Classifiers and Meta-level Classifiers.
Plenty of research has been done in the area of classification as well as in clustering, but the proposed work will study the best classification approach among Meta Classifiers (Classification via Clustering, Classification via
Regression, Filtered Classifiers), Naïve Bayes and Decision
Tree based Classifiers in terms of their efficiency. Now a day Meta classifiers are used mostly in practice because of their multifunctional nature. Meta classifiers may have the following types: Attribute Selected Classifier, Classification via Regression, Multiclass Classifiers, Random Subspace Classifier and Filtered Classifiers. Filtered classifiers may use different types of filters that can be supervised as well as unsupervised. One may classify filters on the bases of database as attribute based filters and instance based filters. The proposed work will include only attribute based supervised filter towards Meta classification of the datasets.
On the other hand Naïve Bayes classifiers are the example of Bayesian classifiers. Two popular classed of Bayesian
classifiers are BayesNet and Naïve Bayes. We may discuss
each of the classifiers in details in the subsequent chapters. As we know if we have to classify anything the best way is to do by Trees. Trees are the best representatives of the different classes. Some of the popular decision tree approaches are J48, Decision Stump, Random Forest, Random Tree and REPTree. We may prefer to use the J48 method, which is widely accepted. The work embodied in this paper will study the performance of following classification strategies:
1. Classification via Clustering
2. Classification via Regression
3. Naïve Bayes Classifiers
4. Decision Tree based Classifiers; and
5. Filtered Classifiers
The next section describes the background work related to the various classification algorithms whereas section III will
elaborate the experimental work and conclusion with future work will be discussed in section IV.
II. BACKGROUND WORK
Several classification algorithms have been emerged in over the years on how to achieve eminence results from Classification systems. Some of them are NaïveBayes (NBs), Bayesian Networks, Neural Networks (NNs), Decision Trees (DTs), Support Vector Machines (SVMs) etc. This paper will only focus on the three popular classification approaches viz. NBs, DTs and Meta Classification. Regardless of the benefits of other approaches, our research is in association with a miniature organisation. Naïve Bayes Classifier - A Naïve Bayes classifier is a simple probabilistic classifier based on applying Bayes' theorem [4, 9, 13]. Naïve Bayes classifier assumes all features are conditionally independent given the
class label. An advantage of the Naïve Bayes classifier is that
it only requires a small amount of training data to estimate the parameters i.e. the means and variances of the variables, necessary for classification. Because independent variables are assumed, only the variances of the variables for each class need to be determined. A Decision Treeis a decision support tool that uses a tree-like graph or model of decisions and their possible consequences, including chance event outcomes, resource costs, and utility. It is one way to display an algorithm [Wiki]. Some of the work related with tree based classifiers can be found in [7 and 12]. In Meta Classification, we have used the concept of Classification via Clustering, Classification via Regression and filtered classification approaches.
III. EXPERIMENTAL WORK
A series of experiments has been setup in order to validate the study of various classifiers. Four real world datasets viz. Diabetes, Vote, Glass and Weather from the weka [3] repository has been used in all experiments. The details of the datasets are given in Table 1. All the experiments were
performed on Intel® CoreTM
i3-370M, with 2GB DDR3 Memory. We have used WEKA 3.7.10 as our development tool for clustering of data items. During the experimental setup, we have tested aforesaid algorithms of classification on these four datasets. Five basic parameters have been recorded during the overall experiment which is given below:
1. Correctly classified instances
3. Kappa statistic
4. Mean absolute error; and
[image:4.612.58.547.160.681.2]5. Root mean squared error
Table 1: Characteristics of various datasets that are used during this work
Relation Name Number of Instances Type of Data
Weather 14 Nominal
Vote 435 Nominal
Diabetes 768 Numeric
Glass 214 Numeric
A summary of all the experiments is shown in figure 1. The values provided against each classifier in figure 1are average of all the values obtained from 4 datasets. For example the value of Classification via Clustering under correctly classified instances is 61.8025, which is the average of all the correctly classified instances of all 4 data sets. Classification via clustering algorithm has classified 57.14 % of all the
instances of ‘Weather’ dataset, 85.05 % of ‘Vote’ dataset, 40.18 % of ‘Glass’ dataset and 64.84 % of ‘Diabetes’ dataset.
The average value of all these values is 61.80 which are mentioned in the figure 1.
Figure 1: Average values of each parameter by five different classification algorithms on four real datasets
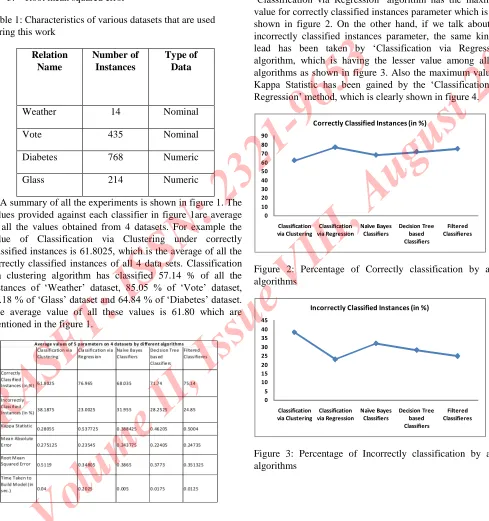
After analysing all the values of figure 1, we can say that
‘Classification via Regression’ algorithm has the maximum value for correctly classified instances parameter which is also shown in figure 2. On the other hand, if we talk about the incorrectly classified instances parameter, the same kind of lead has been taken by ‘Classification via Regression’ algorithm, which is having the lesser value among all the algorithms as shown in figure 3. Also the maximum value of
Kappa Statistic has been gained by the ‘Classification via Regression’ method, which is clearly shown in figure 4.
0 10 20 30 40 50 60 70 80 90 Classification via Clustering Classification via Regression Naïve Bayes Classifiers Decision Tree based Classifiers Filtered Classifieres
Correctly Classified Instances (in %)
Figure 2: Percentage of Correctly classification by all 5 algorithms 0 5 10 15 20 25 30 35 40 45 Classification
via Clustering via RegressionClassification Naïve Bayes Classifiers Decision Tree based Classifiers
Filtered Classifieres
Incorrectly Classified Instances (in %)
0 0 .1 0 .2 0 .3 0 .4 0 .5 0 .6 Classification
via Cluste ring via Re gre ssionC lassification N aïve Baye s Classifie rs De cision Tre e base d Classifie rs
Filte re d C lassifie re s
Kap p a Statistic
Figure 4: Kappa statistic value of all the 5 algorithms on 4 datasets
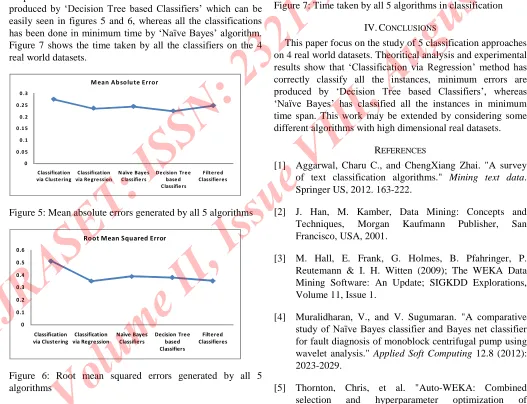
As per the errors are concerned the minimum errors has been
produced by ‘Decision Tree based Classifiers’ which can be
easily seen in figures 5 and 6, whereas all the classifications
has been done in minimum time by ‘Naïve Bayes’ algorithm.
Figure 7 shows the time taken by all the classifiers on the 4 real world datasets.
0 0.0 5 0 .1 0.1 5 0 .2 0.2 5 0 .3 Classification
via Clustering via Re gressionClassification N aïve Bayes Classifie rs Decision Tree based Classifiers
Filtered Classifieres
Mean Absolute Error
Figure 5: Mean absolute errors generated by all 5 algorithms
0 0.1 0.2 0.3 0.4 0.5 0.6 Classification
via Clustering via RegressionClassification Naïve Bayes Classifiers Decision Tree based Classifiers
Filtered Classifieres
Root Mean Squared Error
Figure 6: Root mean squared errors generated by all 5 algorithms 0 0.05 0.1 0.15 0.2 0.25 Classification
via Clustering via RegressionClassification Naïve Bayes Classifiers Decision Tree based Classifiers
Filtered Classifieres
[image:5.612.47.284.105.225.2]Time Taken to Build Model
Figure 7: Time taken by all 5 algorithms in classification
IV. CONCLUSIONS
This paper focus on the study of 5 classification approaches on 4 real world datasets. Theoritical analysis and experimental
results show that ‘Classification via Regression’ method has
correctly classify all the instances, minimum errors are
produced by ‘Decision Tree based Classifiers’, whereas ‘Naïve Bayes’ has classified all the instances in minimum time span. This work may be extended by considering some different algorithms with high dimensional real datasets.
REFERENCES
[1] Aggarwal, Charu C., and ChengXiang Zhai. "A survey of text classification algorithms." Mining text data. Springer US, 2012. 163-222.
[2] J. Han, M. Kamber, Data Mining: Concepts and Techniques, Morgan Kaufmann Publisher, San Francisco, USA, 2001.
[3] M. Hall, E. Frank, G. Holmes, B. Pfahringer, P. Reutemann & I. H. Witten (2009); The WEKA Data Mining Software: An Update; SIGKDD Explorations, Volume 11, Issue 1.
[4] Muralidharan, V., and V. Sugumaran. "A comparative
study of Naïve Bayes classifier and Bayes net classifier
for fault diagnosis of monoblock centrifugal pump using wavelet analysis." Applied Soft Computing 12.8 (2012): 2023-2029.
[image:5.612.38.565.280.684.2]classification algorithms." Proceedings of the 19th ACM SIGKDD international conference on Knowledge discovery and data mining. ACM, 2013.
[6] Kou, Gang, et al. "Evaluation of classification algorithms using MCDM and rank correlation." International Journal of Information Technology & Decision Making
11.01 (2012): 197-225.
[7] Kotsiantis, Sotiris B. "Decision trees: a recent overview."
Artificial Intelligence Review39.4 (2013): 261-283.
[8] Fernández-Blanco, Enrique, et al. "Random Forest classification based on star graph topological indices for antioxidant proteins." Journal of theoretical biology317 (2013): 331-337.
[9] Sharma, Sanjay Kumar, et al. "An improved network intrusion detection technique based on k-means
clustering via Naïve bayes classification." Advances in Engineering, Science and Management (ICAESM), 2012 International Conference on. IEEE, 2012.
[10] Barnaghi, Peiman Mamani, Vahid Alizadeh Sahzabi, and Azuraliza Abu Bakar. "A comparative study for various methods of classification." Int. Conference on Information and Computer Networks (ICICN 2012). IPCSIT. Vol. 27. 2012.
[11] Wang, Xi-Zhao, Ling-Cai Dong, and Jian-Hui Yan. "Maximum ambiguity-based sample selection in fuzzy decision tree induction." Knowledge and Data Engineering, IEEE Transactions on 24.8 (2012): 1491-1505.
[12] Kalpana, Saravanan and Vivekanandan, “ A Two-Stage Tree based Meta-Classifier using Stack-Generalization”, International Journal of Computer Applications (0975 – 8887), Volume 36–No.3, December 2011, pp. 25-28.
[13] Daniela, Christopher and Roger, “ Naïve Bayes vs. Decision Trees vs. Neural Networks in the Classification
of Web Pages”, IJCSI International Journal of Computer