Six Sigma Methodologies: A Review Case Study
Hartaj Singh
#1, Neeraj Pandita*
2, Pardeep Singh
#3, Kapil Singh
#4#
Department of Mechanical Engineering Arni University, (H.P), India. *Department of Mechanical Engineering
Yogananda College of Engineering & Technology, Jammu
Abstract: Six Sigma process methodologies that focuses on quantitatively measuring a process in order to control and improve upon it and strives for 3.4 defects per million opportunities (DPMO) so that it is within six standard deviations of the mean. However, the term in practice is used to denote more than simply counting defects. Six Sigma can imply a whole culture of strategies, tools, and statistical methodologies to improve the bottom line of companies. In all, six sigma, scrupulous analytical process for anticipating and solving problems. The objective of Six Sigma is to improve profits through variability and defect reduction, yield improvement, improved consumer satisfaction and best-in-class product and process performance. It is a new-fangled way of doing production that would eliminate the existing defects efficiently and would prevent defects from occurring. This paper deals with the implementation of process-level Six Sigma in an automotive component manufacturing plant. The objective for presenting case studies here is to review the importance of Six Sigma strategies in Indian manufacturing companies. The details of Six Sigma methodology and principles are presented here. The case studies mentioned as spot welding, its weld defect due to hold time operation for a product in an automobile component manufacturing company, Anand Motor Products Ltd., an MNC. And accomplished accurate implementation of the proposed corrective plan by using root cause analysis intent the present rejection rate from 3.51% to 1.55%.
Keywords:Six sigma, Process methodologies, Root cause analysis.
I. INTRODUCTION
Six Sigma is authoritative approach to achieve infiltrate improvements in manufacturing,
engineering and business process. The approach relies greatly on advanced statistical methods that balance the process and product knowledge to condense variation in process. This methodology used to improve production processes not merely shows the present state of the process counting effectiveness and efficiency, but points towards an aligned with the organizations strategy. It has been capable of incorporating problem contention, root cause analysis, corrective actions, and preventive actions. It is essential for the industry to create a
practical application to solve the current problem and to enhance its present condition by improving customer satisfaction. All this means that companies have to deliver products, which are free from at all defects [1]-[2]. The bottom line is that companies must delight customers and insistently look for new ways to exceed their customer’s expectations. To accomplish this, it is imperative that six sigma qualities becomes a part of mutual or corporate culture. Presently, in India the companies who installed six sigma as Motorola, Dow chemical, Allied signal, Sara lee,
impact on the bottom line, and impact on customer satisfaction. Six Sigma is viewed as a systematic, scientific, statistical and smarter (4S) approach for executive innovation which is quite suitable for use in knowledge based information humanity. The essence of Six Sigma is the integration of four elements as customer, process, manpower, and strategy to provide organization novelty [3]-[4]. The aim of this study is to obtain a better understanding of the influence of process parameters likewise, weld time, hold time, electrode diameter, and sheet thickness as figure1. In Resistance spot welding (RSW) is widely utilized as a joining technique for automobile structure due to flexibility, strength and high-speed of process combining with very high quality joints at very low cost. Spot welding is one form of resistance welding, which is a method of welding two or more metal sheets together without using any filler material by applying pressure and heat to the area to be welded. The process is used for joining sheet materials and uses shaped copper alloy electrodes to apply pressure and convey the electrical current through the work pieces. In all forms of resistance welding, the parts are locally heated. The material between the electrodes yields and is squeezed together. And then melts, destroying the interface between the parts. Spot welding is depends on the number and size of the welds. It is used in a wide choice of industries but surprisingly for the assembly of sheet steel vehicle bodies. Resistant spot welding (RSW) is a fusion welding process that requires the application of both heat and pressure to achieve the sound joint by clamping two or more overlapping sheets between two electrodes. Figure1. Principle of Spot welding process melting occurs, a weld nugget is formed and an autogenously fusion weld is made between the plates. The heat generated depends upon the current, the time and current is passed and the resistance at the interfaces.
Fig.1
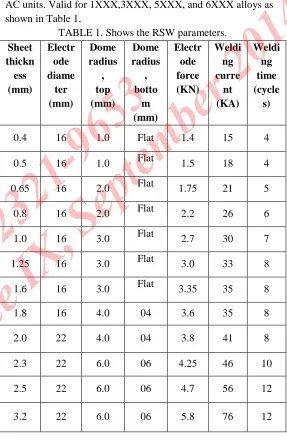
Typical welding parameters for 50 Hz equipment single phase AC units. Valid for 1XXX,3XXX, 5XXX, and 6XXX alloys as shown in Table 1.
TABLE 1. Shows the RSW parameters.
Sheet thickn ess (mm) Electr ode diame ter (mm) Dome radius , top (mm) Dome radius , botto m (mm) Electr ode force (KN) Weldi ng curre nt (KA) Weldi ng time (cycle s)
0.4 16 1.0 Flat 1.4 15 4
0.5 16 1.0 Flat 1.5 18 4
0.65 16 2.0 Flat 1.75 21 5
0.8 16 2.0 Flat 2.2 26 6
1.0 16 3.0 Flat 2.7 30 7
1.25 16 3.0 Flat 3.0 33 8
1.6 16 3.0 Flat 3.35 35 8
1.8 16 4.0 04 3.6 35 8
2.0 22 4.0 04 3.8 41 8
2.3 22 6.0 06 4.25 46 10
2.5 22 6.0 06 4.7 56 12
3.2 22 6.0 06 5.8 76 12
[image:3.612.289.576.152.592.2]used extensively in the automobile industry, albeit mostly for the joining of steel and in the aerospace industry for airframe components in aluminum alloy [5]-[6].
II. COURSE LEVELS AND BELT FOR SIX SIGMA TRAINING SCHEME
Champions are high level executives, including General Managers, Who communicate the business case for the initiatives, and provide the motivation necessary to sustain it. Master black belts are change agents who lead the initiative in each major division or function of the company. Their primary role is to train and support the Black belts who will be leading major projects. Black belts are full time resources who are dedicated to leading major Six Sigma projects for a period of 18-24 months. Green belts are resources who are trained on the concepts of Six Sigma and support the black belts in projects involving their own functional areas and also lead one or more small projects each year [7]-[8].
TABLE 2. Course levels and belts for Six Sigma training scheme.
III. SIX SEGMA METHODOLODY
The existing products and process, the DMAIC methodology applies and for new products and process, the DMADV methodology applies.
(a) Define: Identify the project goals and objectives. Create a team charter that lists the roles and responsibilities of the team members including, of course, the customer. Define the boundaries of the project, including the products and processes
to be examined by the mean of benchmarking, process flow mapping, flow charts [9].
(b) Measure: Select the characteristics of the product or process to be measured. Make a sequential flow of process including; Value stream map, Cause and effect, defect metrics, data collection plan likewise: Run Charts, Time series charts, Time value charts, Pareto charts, and sampling is to be scrutiny [10].
(c) Analyze: Establish the capability of the current product or process in statistical terms. Find out related quality specifications through quality mechanism developing failure analysis, root cause analysis, Analysis of variance (ANOVA), and Scatter plots of key quality mechanism [11].
(d) Improve: Confirm and test the statistical solution by using factorial models such as
Modeling, Tolerance control, Defect control, Design changes, Piloting, and Best practices.
Fig. 2
(e) Control: Perform a measurement system analysis to determine the capability of all
measuring devices to accurately measure the inputs [12]. Implement statistical process control measures on the inputs by the mean of SPC charts, Performance metrics, Multiple regression, Train to ensure that they remain within acceptable operating tolerances.
Course Levels Belts
Overall Vision Champion
Most Comprehensive Master Black Belt
Comprehensive Black Belt
Median Green Belt
TABLE 3. DMAIC Methodology.
Strategic
Steps Deliverables Toole Used
Define Project Charter Flow Chart, Gantt Chart, Process Map, Time Line.
Measure Base Line Figures
SIPOC (Supplier, Inputs, Process, Outputs and
Customers).
Analyze Identified Root Causes
Cause and Effect Diagram, Scatter Diagram, ANOVA.
Improve
Implementation of Plan
Design of Experiment, Orthogonal Array, FMEA.
Control Corrective Actions
Controls Charts, Poka-Yokes, Standardization,
Documentation, Final Report, Presentation.
The first three steps in each case are similar, Define, Measure, and Analyze and for DMAIC, the last two steps focus on improving and controlling existing product and process inputs. For DMADV, the final steps focus on Designing and Validation the future product or process inputs [13]-[15]. The DMAIC methodology for existing product and processes consists of the following steps and the DMADV methodology consists of the following activities:
(f) Design: Generate and verify system and/or subsystem models, allocations and transfer functions and optimize through statistical analysis of variance drivers.
(g) Validation: Statistically confirm that product/processes match predictions. Develop manufacturing and supplier control plans. Document product/process capabilities and transition to full production rates. Each step in the DMAIC and DMADV
methodology requires the use of specific skills and tools to achieve the desired results [16]-[17].
IV. DESIGN OF EXPERIMENT
Design of experiment includes multiple levels and multiple factors simultaneously and makes decisions at which the levels of the factors will optimize the output.
A statistics based approach to designed experiments.
A methodology to achieve a predictive knowledge of a complex, multiple variable
processes with the fewest trails possible.
An optimization of the experimental process itself.
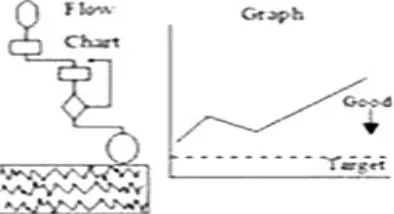
4.1 Processing steps for spot welding using flow chart Step 1: Define (Problem Formulate/Identified)
Fig. 3 Flow chart used to define the process.
[image:5.612.337.534.544.651.2]To enhance the process capability by reducing the rework cost and it can be controlled but it’s quite difficult to optimize the whole process. And, only focused on the root cause parameters which may impart rejection or rework rate [18].
Step 2: Measure (Data Collection and Summarized)
The pulsed welding current based schedule is sometimes recommended for heavy gauge and stack-up assembly cases associated with some welding signal modification in order to improve weld-ability and mechanical properties of spot weld [19]-[21]. The pulse current used can be medium
Fig. 5 The Process with inputs and outputs.
frequency director alternating current pulse [22]-[23]. Other adapted current signal such as down sloping, quenching or post-heating can be also introduced to a required welding current signal. These modifications become a common convenient technique for the improvement of weld mechanicalmetallurgical properties in high strength steel joining [24].
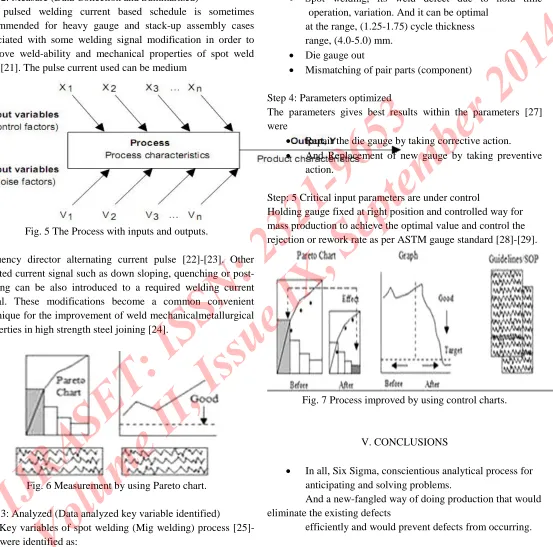
Fig. 6 Measurement by using Pareto chart.
Step 3: Analyzed (Data analyzed key variable identified)
The Key variables of spot welding (Mig welding) process [25]-[26] were identified as:
Spot welding, its weld defect due to hold time operation, variation. And it can be optimal
at the range, (1.25-1.75) cycle thickness range, (4.0-5.0) mm.
Die gauge out
Mismatching of pair parts (component)
Step 4: Parameters optimized
The parameters gives best results within the parameters [27] were
Repair the die gauge by taking corrective action.
And Replacement of new gauge by taking preventive action.
Step: 5 Critical input parameters are under control
[image:6.612.27.580.131.678.2]Holding gauge fixed at right position and controlled way for mass production to achieve the optimal value and control the rejection or rework rate as per ASTM gauge standard [28]-[29].
Fig. 7 Process improved by using control charts.
V. CONCLUSIONS
In all, Six Sigma, conscientious analytical process for anticipating and solving problems.
And a new-fangled way of doing production that would eliminate the existing defects
This paper deals with the implementation of process break in steps for presenting case
studies here is to review the details of Six Sigma methodology and principles are
presented here. The holding time duration range, (1.25-1.75) cycle thickness range,
(4.0-5.0) mm.
The case studies mentioned as spot welding, its weld defect due to hold time operation
for a product, corrective actions and preventive actions by using root cause analysis and
the rejection rate can be reduced up to 1.55%.
VI. RECOMMENDATIONS
Some of the worthwhile investigating parameters:
Study the measure defect rates in all processes and uses quality level in measuring
process capability.
Study the Business strategy Management philosophy and competitive price of product
and it relate with the industrial practice which gives the best results.
Using Six Sigma to gain a competitive edge in quality, cost and customer satisfaction and
Including the key considerations such as: short cycle instance, scheduled or on time
delivery, low service worth, better communication, and product consistency.
REFERENCES
[1] Maslow, A.H (1954) ‘Motivation to personality’, New York: Harper Row Inc.
[2] Herzberg, F.B., Mausner, and Synderman, B (1959) ‘The motivation to work’, John Wilet and Sons, Inc.
[3] Garvin (1987)“Competing on the eight dimensions of quality”, Harvard Business Review, pp. 43-51.
[4] Taguchi, G.E., Elsayed, A., and Hsiang, T.C(1989) ‘Quality engineering in production Systems’,New York: McGraw Hill.
[5] DeVellis, R.F (1991) ‘Scale Development Theory and Applications’London: SAGE.
[6] Pande, P.S (2000), “The Six Sigma way”, New York: McGraw Hill.
[7] Pyzdek, T (2001) ‘The Six Sigma Handbook’ New York: McGraw Hill.
[8] Mantgomery, D.C (2001) “Induction to statistical quality control”, 4th edition. John Wiley Sons, Inc.
[9] George, M.L (2002) ‘Lean Six Sigma’, New York: McGraw-Hill.
[10] Amundson, S. D (1998)‘Relationships between theory-driven empirical research in operations management and other disciplines’Journal of Operations Management, vol.16 pp. 341-359.
[11] Bacharach, S. B (1989)‘Organizational theories: Some criteria for evaluation’ Academy of Management Review, vol. 14(4), pp. 496-515.
[12] Bohn, R. (1994) ‘Measuring and managing technological knowledge’Sloan Management Review; vol. 36(1) pp. 61-73.
[13] Crosby, P. B (1979) ‘Quality is Free’, New York: McGraw-Hill.
[14] de Treville, S., Edelson, N. M., and Watson, R (1995) ‘Getting Six Sigma back to basics, Quality Digest’ vol. 15 pp. 42-47.
[15] Hackman, J. R., and Oldham, G. R (1976) ‘Motivation through the design of work Test of a theory Organizational Behavior and Human Performance’, vol.16, pp. 250-279.
[16] Locke, E. A., and Latham, G. P (2004)‘What should we do about motivation theory’, Six recommendations for the twenty-first century. Academy of Management Review; vol.29, pp.388-403.
[18] Osigweh, C. A. B (1989) ‘Concept fallibility in organizational science’, Academy of Management Review, vol. 14(4), pp. 579-594.
[19] Rousseau, D. M., and Fried, Y (2001) ‘Location: Contextualizing organizational research’ Journal of Operational Behavior, vol.22 pp.1-13.
[20] Schmenner, R. W., and Swink, M. L (1998), ‘On theory and operations management’, Journal of Operations Management, vol.17 pp. 97-113.
[21] Banuelas, R., and Antony, J (2004) ‘Six Sigma or design for Six Sigma’, The TQM Magazine, Vol. 2(3), pp. 29-33. [22] Harry, M., and Schroeder, R (2000) ‘Six Sigma: The Breakthrough Management Strategy Revolutionizing’
Doubleday, New York.
[23] Goh, T., and Xie, M (2004) ‘Improving on the Six Sigma Paradigm’, The TQM Magazine, vol. 16(4), pp. 235-240. [24] Kuei, C., and Madu, C (2003) ‘Customer- Centric Six Sigma Quality & Reliability Management’, International Journal of Quality & Reliability Management, vol. 20 (8), pp. 954-964.
[25] Darshan D Patel, K.R. Gawande “Productivity improvement through six sigma methodology in bearing manufacturing”, International Journal for Research in Applied Science and Engineering Technology (IJRASET), Volume 2 Issue V, May 2014, Page No: 233-239
[26] Snee, R (2004) ‘Six Sigma: The Evolution of 100 years of Business Improvement Methodology’, International Journal of Six Sigma and Competitive Advantage,vol.1(1), pp. 4-20. [27] Shi, G (2003) Westgate, 'Resistance spot welding of high strength steels' Conference on Joining of Materials, (JOM 11), Helsingor , Denmark.
[28]Cretteur, L., Koruk A.L., and Tosal-martinez, L (2002), 'Improvement of weldability of TRIP steels by use of in-process pre- and post-heat treatments', Proc. Int. Conf. on TRIP-Aided High Strength Ferrous Alloys, Ghent, Belgium, 19-21 June, pp.353-358.
[29] Mr. Shah Krunal, Asst. Prof Ankita Pathak “Reduction of Non Conformative Rate of Bearing Rings Using Six Sigma Methodology”, International Journal for Research in Applied Science and Engineering Technology (IJRASET), Volume 2 Issue V, May 2014, Page No: 532-539.