ssue V, May 2014
653
E N C E
excitation
diatomic potential of the title system were re-While plots of the different diatomic potentials g to somewhat different classification of trajectories in classical trajectory (QCT) treatment. Different dynamical features, like the excitation functions for exchange and by Aquilanti et al.
branching ratio (Γ). Nevertheless, some quantitative discrepancies remained in respect of some of the experimental results [22, 23], notably
= 0, QCT theory values at low energies,
QCT results agree with those of Turner et al. [17] in
tot = 5.0 eV,
starts decaying, (iii) for v= 1 to 4, of CRB and Lee et al. agree only at
Three sources of discrepancies were pointed out:
he QCT approach may not be rigorously valid,
PES might not be sufficiently
mic ion-molecule
Vol. 2 Issue V, May 2014
ISSN: 2321-9653
A L J O U R N A L F O R R E S E A R C H I N A P P L I E D S C I E N C E
D E N G I N E E R I N G T E C H N O L O G Y (I J R A S E T)
the competing endothermic collision induced
+ H + He, ΔHII = 2.651 eV, were studied at low collision energies by CRB (Chupka, Berkowitz, and Russell [5-7]) despite the difficulties related to the positive charge of one of the reactants, using ionization technique. They obtained scattering cross
) for dissociative and σR
(Etrans) for exchange
reactions as functions of translational energy, Etrans, for v= 0 to 5. While the excitation function σR
(Etrans) have a
pronounced peak near threshold, the other excitation function, ) increased steadily from the dissociation threshold ); and channel (2) dominated over channel (1) at Etrans
. It was also found that vibrational energy Evib is
trans in promoting both the
Around 1987, Govers et al. (GG) experimentally investigated reactions (1) and (2), using the threshold–
ion coincidence (TPEPICO) technique [19]. They studied the vibrational-energy dependence of σR
for the reactions (1) and (2) at Etrans= 3.1 ± 0.7 eV for
= 0 to 6, and reported vibrational enhancements of magnitude comparable with that of other experiments. They also found that the branching ratio remains approximately
≤ 3 and rises through 1.3 for higher ’s. Both the reactions involve hard-type collisions resulting in
Tang et al. [20] have measured translational energy
dependence of cross sections (σR
) using a pulsed-field ionization–photoelectron-secondary ion coincidence (PFI-PESICO) approach for higher vibrational levels at translational energies of 0.6 and 3.1 eV.
Theoretically, some improvements have been made in the meanwhile. An accurate PES has been proposed by Aquilanti et al. (AEA) [25], based on ab initio energy points calculated at MRCI level, using diatomic PE of Aguado and Paniagua [26], and a triatomic polynomial of 6th order. They also used a 12thorder polynomial PES [27], but unfortunately, later reported it to be incorrect [28].
Using QCT program and this 12th order PES (polynomial) of Palmieri et al. [27] Tang et al. [20] calculated
the proton transfer cross section (σR
) as well as the cross
section (σD) for reaction (2). Their experimental values of σR
are higher than those of QCT at low collision energies. However, the inaccuracy of the fit might have rendered the PES not offer a reliable result. Also, the features like the sharp peaks for lower vibrational state and decay of the excitation functions could not be reproduced in the work of AEA [25] or Maiti et al. [29].
Therefore, in this paper our aim is to examine analytical properties of the 6th order PES of Aquilanti et al. and compare it with that of the MTJS surface as it relates to the classification of the trajectories, and to investigate the accuracy of the surfaces with respect to the excitation functions as compared to experiment.
II. METHODOLOGY
FORTRAN 77 codes were written for the 6th order polynomial PES of the titled system described by AEA [25]. From these codes the following values were obtained for the energies of the reactants, linear intermediate and products after adding energy of the dissociation state. They are -3.506053, -3.518587 and -3.478171 hartree which may be compared with the corresponding values of -3.505776, -3.518181 and -3.478190 hartree obtained by AEA themselves. The diatomic part of the potential was then calculated for H2
+
and HeH+. This was compared with that calculated from JS and MT data. All the three plots were found to match exactly from rAB= 0 to 10 Ǻ (not shown here).
The first and second derivatives of the diatomic potential functions for the potentials of AEA for H2+ and HeH+ were also programmed in FORTRAN 77 (the derivatives for MTJS surface could be extracted from the trajectory program of JS [22]). Both the derivatives were plotted against diatomic distances, rABin eV/Ǻ (electron volt per angstrom) and eV/Ǻ2(electron volt per square angstrom), rABwas varied from zero to 10 Ǻ.
Dynamical attributes of both the exchange and CID reactions (1) and (2) were calculated using the QCT theory, the details of which are described in literature [30-33]. For our calculations, we used REACTS Program of Schreiber [34]. The diatomic vibrational energy levels were determined as discussed in Ref. [21]. The initial separation of the atom He from the diatom H2
+ was set at 6.0 Å, where interaction
energy was almost zero. The impact parameter b was chosen
by stratified sampling at intervals of 0.5 Å, and 2000
www.ijraset.com Vol. 2 Issue V, May 2014
ISSN: 2321-9653
I N T E R N A T I O N A L J O U R N A L F O R R E S E A R C H I N A P P L I E D S C I E N C E
AN D E N G I N E E R I N G T E C H N O L O G Y (I J R A S E T)
Hamilton's equations were solved numerically using the fifth-order predictor-sixth fifth-order corrector Adams-Moulton method. The accuracy of the integration was checked from conservation of energy and angular momentum. Energy conservation was better than 10 -5 eV.
www.ijraset.com Vol. 2 Issue V, May 2014
ISSN: 2321-9653
I N T E R N A T I O N A L J O U R N A L F O R R E S E A R C H I N A P P L I E D S C I E N C E
AN D E N G I N E E R I N G T E C H N O L O G Y (I J R A S E T)
B. Figure Captions
Figure 1 (a). The first derivatives of diatomic potentials of AEA and JS for H2
+
(v = 1-3, j =1) against interatomic distance rAB.
Figure 1 (b): The 2nd derivatives of diatomic potentials of AEA and JS for H2
+
(v = 1-3, j =1) against interatomic distance rAB.
Figure 1 (c): The first derivatives of diatomic potentials of AEA and JS for HeH+ (v = 1-3, j =1) against interatomic distance rAB.
Figure 1 (d): The 2nd derivatives of diatomic potentials of AEA and JS for HeH+ (v = 1-3, j =1) against interatomic distance rAB.
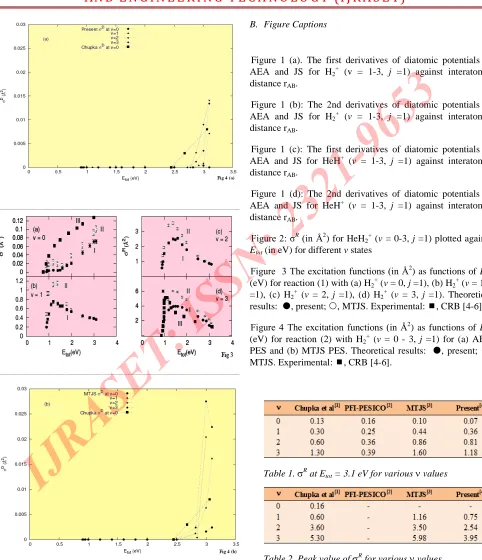
Figure 2: σR(in Å2
) for HeH2 +
(v= 0-3, j=1) plotted against Etot(in eV) for different v states
Figure 3 The excitation functions (in Å2
) as functions of Etot
(eV) for reaction (1) with (a) H2 +
(v= 0, j=1), (b) H2 +
(v= 1, j =1), (c) H2
+
(v = 2, j=1), (d) H2 +
(v = 3, j =1). Theoretical results: , present; , MTJS. Experimental: , CRB [4-6].
Figure 4 The excitation functions (in Å2
) as functions of Etot
(eV) for reaction (2) with H2 +
(v = 0 - 3, j =1) for (a) AEA PES and (b) MTJS PES. Theoretical results: , present; , MTJS. Experimental: , CRB [4-6].
[image:5.612.78.560.116.676.2]Table 1. Rat Etot= 3.1 eV for various values
[image:5.612.70.321.126.671.2]www.ijraset.com Vol. 2 Issue V, May 2014
ISSN: 2321-9653
I N T E R N A T I O N A L J O U R N A L F O R R E S E A R C H I N A P P L I E D S C I E N C E
AN D E N G I N E E R I N G T E C H N O L O G Y (I J R A S E T)
1
Reference [4-5]; σRat Etot= 3.1 eV
1Reference [19]; σR
at Etot= 3.1 eV
1
These values as calculated here are slightly different from those of References [22, 24]
1
After AEA [25, 27]
III. RESULTS AND DISCUSSIONS
T Asymptotic behaviour of the potential derivatives
Figure 1(a) shows the first derivatives of diatomic potentials of JS and AEA for H2
+
plotted against interatomic distances rAB, while Figure 1(c) shows them for HeH
+ . As expected, in both H2
+
and HeH+ cases the maxima occur at different rAB and have different values, the AEA (HeH+) potential maximum being about 1.3 eV lower while that for H2
+
being about 0.9 eV lower than the corresponding MTJS value. Both the derivatives for both H2
+
and HeH+ behave smoothly and the plot for HeH+shows a maximum at around
1.0 Å and has zero value at the crossing seam at about 0.8 Å.
The latter is the equilibrium distance and is thus predicted equally by both JS and AEA potentials. Then the derivatives
decay to about zero value at around 3.0 Å. The H2 +
derivatives have zero value at the crossing seam at about 1.0
Å [Figure 1(a)], which is the equilibrium distance here and show a maximum at around 1.6 Å and then they smoothly change to zero value at around 5.0 Å. Both the derivatives
behave similarly at critical points and so the diatomic potentials are equally good representations at these points. However, they have slightly different analytical properties as shown above, at intermediate points and these can only affect
the Hamilton’s solutions. This affects the trajectory classification so much so that the values of cross sections, as we shall see below for reactions (1) and (2), are obtained sometimes on either side of the experimental plot.
Figure 1(b) shows the smooth variation of 2nd derivatives of diatomic potentials of JS and AEA for H2
+ .
Here a minimum occurs at about 1.2 Å which is about 2.7 eV
lower for MTJS surface. While Figure 1(c) shows that for HeH+at about.2.3 Å and MTJS’s minimum is located 0.8 eV
lower than AEA’s one. The crossing seam can be seen at
around 0.0 eV at about 1.0 Å. Here also the distance
dependence behaviour of the two derivatives is more or less alike, but analytical properties differ as in the case of 1st derivatives. Thus the classification of trajectories and hence the excitation function is expected to be different in two cases.
Excitation functions (σRand σD )
We have investigated the reaction (1) on the surface of AEA and examined the variations of scattering cross
sections (σR
) for first four vibrational states (Evib = 0.14323, 0.41835, 0.67836 and 0.92325 eV) over a wide range of Etrans such that
0.9 ≤ Etot≤ 3.1 eV (3)
as shown in Figure 2 where we have also given selective
Chupka’s values of σR
for v=0 and v=3. The equality or inequality restriction (3) arises from the covered energy range of 3.15 eV in generating the fit V06, to the ab initio points [27].
Basic feature of the excitation function σR
namely: (i)
The vibrational enhancement, (ii) The decay of σR
with Etot,
(iii) The peaks of the excitation functions and (iv) the
magnitudes of σR
for different v states, all agree with experiment fairly. To compare the relative accuracy of the AEA and JS surfaces we have tried to reproduce the results of JS [22] at the same energies so as to compare the values of σR
obtained by the two surfaces. These σR
values are plotted in Figures from 3(a) to 3(d) for v=0 to v=3 respectively. The two surfaces are not of equal accuracy when compared to experiment. Sometimes one is more accurate than the other in a different vibrational state.
The surface of AEA was used also to study reaction (2). We examined the variations of scattering cross sections
(σD
) for the four vibrational states as noted above, over the same range of Etotas shown in Figure 4(a) and have tried to
reproduce the results of KS [24] at the same energies so as to
compare the values of σD
www.ijraset.com Vol. 2 Issue V, May 2014
ISSN: 2321-9653
I N T E R N A T I O N A L J O U R N A L F O R R E S E A R C H I N A P P L I E D S C I E N C E
AN D E N G I N E E R I N G T E C H N O L O G Y (I J R A S E T)
We have investigated the reaction (1) on the surface of AEA
and examined the variations of scattering cross sections (σR
) for first four vibrational states (Evib = 0.14323, 0.41835,
0.67836 and 0.92325 eV) over a wide range of Etotsuch that
0.9 ≤ Etot≤ 3.1 eVas shown in Figures from 2(a) to 2(d) and
have tried to reproduce the results of JS [22] at the same
energies so as to compare the values of σR
obtained by the two surfaces. For comparison, we have also given selective
Chupka’s values of σR
for v=0 and v=3 in Figures 2(a) and 2(d) respectively.
The surface of AEA was used also to study reaction (2). We examined the variations of scattering cross sections
(σD
) for the four vibrational states as noted above, over the same range of Etotas shown in Figure 3(a) and have tried to
reproduce the results of KS [24] at the same energies so as to
compare the values of σRand σD
obtained by the two surfaces. The results obtained from MTJS surface are shown in Figure 3(b).
IV. CONCLUSIONS
Based on electronic structure of the title system, the authors have examined the analytical behaviour of its potential functions and first and second derivatives of PE of MTJS and AEA for the diatomics H2
+
(v, j =1) and HeH+. It has been observed that the diatomic potential energy obtained by the three methods match exactly. But their derivatives have somewhat different analytical properties as discussed above. Thus despite all the progress that has been made, the need for a re-parameterization of the potential polynomials is still there.
MTJS, sixth order polynomial PES of AEA and the QCT method were used to study reactions (1) and (2) in terms
of cross sections σRand σD
. The results are generally in fair agreement with experiment.
ACKNOWLEDGMENT
The authors are thankful to Professor N. Sathyamurthy of IIT Kanpur for suggesting the problem and valuable discussions on the project. J. R. Ansari is also thankful to the Vice Chancellor and HOD (Physics) of Singhania University, Jhunjhunu, India for their support. W.H. Ansari is thankful to the management of the Gold Field Institute of Technology & Management, Faridabad, India for their kind support.
REFERENCES
[1] M. Kimura and N. F. Lane 1991 Phys. Rev. A44259.
[2] V. W. Kaul, V. Literacy and R. Taubert 1961 Z. Naturforsch 16a624.
[3] H. von Koch and L. Friedman 1963 J. Chem. Phys.38, 1115
[4] T. F. Moran and L. Friedman 1963 J. Chem. Phys. 39, 2491
[5] W. A. Chupka and M. E. Russell 1968 J. Chem. Phys. 49, 5426
[6] W.A. Chupka, J. Berkowitz, and M. E. Russell 1969 in Sixth International Conference on Physics of Electronic and Atomic Collisions(MIT, Cambridge) p. 71
[7] W. A. Chupka 1972 in Ion-Molecule Reactions(eds) by J. L. Franklin (Plenum, New York) Vol. 2 Chap. 3 p. 72
[8] J. J. Leventhal 1971 J. Chem. Phys.54, 3279
[9] J. A. Rutherford and D. A. Vroom 1973 J. Chem. Phys. 58, 4076
[10] R. H. Neynaber and G.D. Magnuson 1973 J. Chem. Phys.59, 825
[11] F. Schneider, U. Havemann, and L. Zülicke 1975 Z. Phys. Chem. 256773
[12] F. Schneider, U. Havemann, L. Zülicke, V. Pacák, K. Birkinshaw, and Z. Herman 1976 Chem. Phys. Lett.37 323
[13] V. Pacák, U. Havemann, Z. Herman, F. Schneider and
L. Zülicke 1977 Chem. Phys. Lett.49273
[14] U. Havemann, V. Pacák, Z. Herman, F. Schneider, C.
Zuhrt, and L. Zülicke 1978 Chem. Phys.28, 147
[15] D. Van Pijkeren, J. Van Eck, and A. Niehaus 1983 Chem. Phys. Lett.9620
www.ijraset.com Vol. 2 Issue V, May 2014
ISSN: 2321-9653
I N T E R N A T I O N A L J O U R N A L F O R R E S E A R C H I N A P P L I E D S C I E N C E
AN D E N G I N E E R I N G T E C H N O L O G Y (I J R A S E T)
[17] T. Turner, O. Dutuit, and Y. T. Lee 1984 J. Chem. Phys. 813475
[18] M. Baer, S. Suzuki, K. Tanaka, K. Tanaka, I. Koyano, H. Nakamura, Z. Herman, and D. J. Kouri 1986 Phys. Rev. A34 1748
[19] T. R. Govers and P. -M. Guyon 1987 Chem. Phys. 113 425
[20] X. N. Tang, H. Xu, T. Zhang, Y. Hou, C. Chang, C Y. Ng, Y. Chiu, R. A.
Dressler and D.J. Levandier 2005 J. Chem. Phys. 122 164301
[21] (a) Tian-Shu Chu, Rui-Feng Lu, and Ke-Li Hana, X.-N.Tang, H.-F. Xu, and C. Y. Ngb 2005 J. Chem. Phys
122244322
(b) Kolakkandy Sujitha, Giri, K. and N. Sthyamurthy, 2012 J. Chem. Phys. 136244312
(c) W. Xu and P. Zhang, 2013 J. Phys. Chem. 1171406
[22] J. L. Schreiber 1973 Ph. D. thesis (University of Toronto, Canada)
[23] (a) T. Joseph and N. Sathyamurthy 1984 J. Chem. Phys. 805332
(b) T. Joseph and N. Sathyamurthy 1987 J. Chem. Phys. 86704
[24] D. R. McLaughlin and D. L. Thomson 1979 J. Chem. Phys. 702748
[25] S. Kumar and N. Sathyamurthy 1989 Chem. Phys. 137 25
[26] V. Aquilanti, G. Capecchi, S. Cavalli, D. De Fazio, P. Palmieri, C. Puzzarini, A. Aguilar, X. Gimenez, J. M. Lucas 2000 Chem. Phys. Lett. 318619
[27] A. Aguado and M. Paniagua 1992 J. Chem. Phys. 96 1265
[28] P. Palmieri, C. Puzzarini, V. Aquilanti, G. Capecchi, S. Cavalli, D. De Fazio, A. Aguilar, X. Gimenez, J. M. Lucas 2000 Mol. Phys. 98 1835
[29] D. De Fazio 2005 private communication(A. N. Panda of Indian Institute of Technology, Kanpur, India)
[30] B. Maiti, S. Mahapatra, and N. Sathyamurthy 2000 J. Chem. Phys. 113 59
[31] J. C. Polanyi and J. L. Schreiber 1974 in Physical Chemistry (eds) by H. Eyring, R. Henderson and W. Jost (Academic, New York) Vol. 6ACh. 6.
[32] D. G. Truhlar and J. T. Muckerman 1982 in Chemical Dynamics via Molecular Beam and Laser Techniques (Oxford University Press, New York) Ch. 16.
[33] 1979 Atom-Molecule Collision Theory : A Guide for Experimentalist, (eds) by R. B. Bernstein (Plenum: New York).
[34] D. L. Thompson and L. M. Raff 1985 in (Theory of Chemical Reaction Dynamics) Vol. 3, (eds) by M. Baer (CRC Press, Boca Raton) Ch. 1.