On the Long-Range Dependent Behaviour of
Unidirectional Packet Delay of Wireless Traffic
Dimitrios P. Pezaros, Manolis Sifalakis, and David Hutchison Computing Department, Infolab21
Lancaster University Lancaster, UK
{dp, mjs, dh}@comp.lancs.ac.uk
Abstract— In contrast to aggregate inter-packet metrics that
quantify the arrival processes of aggregate traffic at a single point in the network, intraflow end-to-end per-packet performance metrics assess the level of service quality experienced by certain traffic types while routed over a network path. Consequently, while the former is influenced by the superimposition of a large number of concurrent ON/OFF sources, the latter mainly depends on the specific transport mechanisms employed by individual flows in conjunction with the temporal resource contention along the end-to-end path. In this paper, we have used a ubiquitous measurement technique to assess the unidirectional end-to-end delay characteristics experienced by diverse sets of IPv6 flows routed over heterogeneous wireless network configurations. We analysed numerous traces to find that, when viewed as time series data, often exhibit long-range dependence manifested by Hurst parameter estimates greater than 0.5. Our results suggest that the end-to-end packet delay can be bursty across multiple time scales even at the microflow level, implying high performance variability during sufficiently long-lived application sessions. We anticipate that the quantification of such intraflow phenomena can enable applications to optimise and adjust their operation in the face of potential performance degradation.
Keywords- long-range dependence; autocorrelation; self-similarity; unidirectional delay; IPv6
I. INTRODUCTION
Self-similarity and Long-Range Dependence (LRD) have become widely accepted characteristics of facets of network traffic for more than a decade. Studies in LAN [11], WAN [15], and transport/application-specific traffic [6] have advocated its bursty behaviour not being flattened when averaged over long time scales, hence challenging the commonly assumed Poisson or Markovian arrival processes to model network traffic. Research has primarily focused on long-term aggregate traffic characteristics, such as packet and session arrivals, to emphasise the importance of these “burstiness” preservation properties and their implications on the design, control, and analysis of high-speed networks. The LRD properties of aggregate network traffic have been linked to heavy-tailed, infinite variance phenomena at the level of individual source-destination pairs, represented by ON/OFF sources and packet trains models whereby a source alternates between active (ON-period) and idle (OFF-period) states [19].
However, not many studies have focused on investigating the existence (or otherwise) of LRD within finer-grained end-to-end performance metrics at the level of individual flows. A few studies have reported non-stationary LRD in round-trip delay of synthetic UDP traffic [3], and in aggregate NTP/UDP flows [12], yet the burstiness preservation implications on the different transport mechanisms, the diverse physical infrastructures, and the unidirectional contributors of the per-packet end-to-end delay of individual flows have not been investigated, partly due to the absence of adequate and ubiquitous instrumentation mechanisms. The dynamic operation of transport-level flow control algorithms and the temporal resource contention that can result in congestion and packet loss along the end-to-end path are among the primary parameters influencing the unidirectional delay behaviour and imposing high variability, ultimately affecting the applications throughput. Presence of LRD in intraflow packet delay would imply bursty and unpredictably variable end-to-end performance. At the same time, the increasing popularity of wireless local and wide area network technologies can itself introduce highly variant performance. Fluctuations in radio channel quality of W-LANs as well as the link-layer reliability mechanisms employed by W-WANs have already been reported as factors of increased variability in end-to-end packet delay [5][9]. Therefore, quantifying the intensity and longevity of such burstiness can prove useful for models capturing application behaviour that can then take this phenomenon into consideration while optimising application-level performance parameters.
In this paper we have used in-line measurement to instrument operational IPv6 microflows delivered by reliable and unreliable transport mechanisms over mixed wired and wireless network configurations. We have analysed unidirectional delay traces and found evidence of Long-Range Dependence in delays experienced by both TCP and UDP microflows, manifesting itself through Hurst parameter estimates greater than 0.5. We compare and contrast the existence and intensity of the phenomenon between different types of unidirectional flows and two different wireless technologies. We empirically assess the relevance and accuracy of the most commonly used LRD estimators and we comment on the tail behaviour of the unidirectional delay distributions. Section II describes the measurement methodology and the experimental environment. In section III we provide a brief
definition and explanation of Long-Range Dependence and we outline the different time and frequency-domain methods used in our traces to obtain the Hurst parameter estimates. Section IV presents results obtained by the statistical analysis of our time series data supporting the case that unidirectional delay of IPv6 microflows can exhibit LRD characteristics. In Section V we discuss the accuracy and relevance of the revealed LRD behaviour in unidirectional delay, and we comment on the distributional characteristics of our time series data. Section VI concludes the paper.
II. MEASUREMENT METHODOLOGY
A. In-line Measurement Technique
In-line measurement [16] is a two-point technique that exploits the concept of piggybacking per-packet, minimal measurement indicators within the payload datagrams, in order to reveal how actual traffic is routed between two nodes in the network. By exploiting the native extensibility features of IPv6, measurement data such as timestamps and packet counters are encoded in Type-Length-Value (TLV) structures and encapsulated within an IPv6 destination options extension header. The IPv6 specification provides the space for special-purpose data to be encoded as a native part of the network-layer header, hence making any mechanism that exploits this feature applicable to all traffic types carried over the IPv6 Internet infrastructure. Destination options extension headers in particular, are only processed at the (ultimate) destination node identified in the destination address field of the main IPv6 header. Hence, they can be defined and realistically deployed only at the edges of the network, without their presence negatively impacting the option-bearing datagrams at the intermediate forwarding nodes (a well-identified problem in IPv4). Unidirectional delay measurement has been implemented as a set of Linux kernel modules that timestamp time TA immediately before a packet is serialised at the NIC of
the source IPv6 node, and time TB as soon as the packet arrives
in the destination IPv6 node’s OS kernel. Unidirectional packet delay is then calculated as D = TB – TA.
B. Measurement Environment
End-to-end unidirectional delay measurements have been conducted over two diverse wireless service networks of the Mobile IPv6 Systems Research Laboratory (MSRL) infrastructure [13]. MSRL includes a wireless cellular network as well as a combination of 802.11 technologies and it comprises a real service infrastructure. The measurements were carried out between a host machine connected to MSRL’s wired backbone network (Linux 2.4.18; Intel 100BaseT adapter) and a host machine with multiple wireless interfaces (Linux 2.4.19; NOKIA D211 combo PCMCIA 802.11b/GPRS adapter), connected through the 802.11b/g campus-wide network and through the GPRS/GSM W-WAN network.
The W-LAN infrastructure is part of Lancaster University campus wireless network, and includes 802.11b and 802.11g. Although the nominal speed for 802.11b is 11Mb/s, it has been observed that due to interference with other appliances operating at the same frequency band (2.4 GHz), the cards often fall-back to 5.5, 2, and 1 Mb/s. The W-WAN network is
the Orange UK GPRS/GSM service network, practically allowing for speeds of up to 20/50 Kb/s (up/downlink), due to asymmetric slot allocation. Connectivity between Orange UK and the MSRL backbone is served by a 2 Mb/s wireless Frame Relay point-to-point link.
III. LONG-RANGE DEPENDENCE (LRD)ESTIMATION
A stochastic process or time series Y(t) in continuous time
t∈\ is self-similar with self-similarity (Hurst) parameter
0<H<1, if for all α >0 and t≥0,
( ) H ( ).
d
Y t = a Y− αt
Self-similarity describes the phenomenon of a time series and its time-scaled version following the same distribution after normalizing by α-H. This implies that the autocorrelation
function (ACF) of the stationary increment process
( ) ( ) ( 1)
X t =Y t −Y t− at lag k is given by
2 2 2
1
( ) (( 1) 2 ( 1) ), 1.
2
H H H
k k k k k
ρ = + − + − ≥
In addition, for 0 1, , 1
2
H H
< < ≠ it can be shown [2][14] that lim ( ) (2 1) 2H 2,
k ρ k H H k
−
→∞ = − and in particular for the case
0.5<H<1, ρ(k) asymptotically behaves as ck−β for
0< <β 1, where c>0 is a constant, β = −2 2 .H Therefore, the ACF decays hyperbolically which is the essential property that constitutes it not summable:
1 ( ) .
k ρ k
∞
= = ∞
∑
When such condition holds, the corresponding stationary process X(t) is said to be Long-Range Dependent (LRD). Intuitively, this property implies that the process has infinite memory for 0.5 < H < 1, meaning that the individually small high-lag correlations have an important cumulative effect. This is in contrast to conventional short-range dependent processes which are characterised by an exponential decay of the autocorrelations resulting in a summable ACF. In the context of intraflow packet delay, presence of LRD indicates that unidirectional delay remains bursty over a wide range of timescales for potentially infinitely long traffic flows.
A. Time-domain estimators
We have employed the aggregated variance and the
rescaled adjusted range (R/S) estimators. The former examines the decay of the sample variance at increasing time aggregation levels which, for LRD time series, is slower than the reciprocal of the sample size. The R/S method examines the growth in the rescaled range of partial sums of deviations of the time series from its mean, as a function of the number of points in the time-aggregated series.
B. Frequency-domain estimators
The periodogram method is based on the discrete Fourier transform and is an estimate of the power spectral density of a discrete process which, for LRD series, should exhibit power-law behaviour for frequencies (~10%) close to the origin. The
Whittle estimator is a maximum likelihood type estimate which is applied to the periodogram of the time series and minimises the flowing function Q:
( )
( )( ) : , ;
I
Q d
f
π π
λ
η λ
λ η
− =
∫
where ( )I λ is the periodogram, f
( )
λ η; is the spectral density at frequency λ, and η is the value that minimizes the function Q.The aggregated variance, R/S, and periodogram are heuristic, graphical methods that estimate the Hurst parameter by examining the slope of the line fitted to a log-log plot of the corresponding quantity of interest. On the other hand, Whittle provides an asymptotically exact estimate of H and a confidence interval. However, Whittle requires the empirical series to be consistent with a specific process whose underlying form must be provided. It can hence be applied to processes that have already been shown to exhibit LRD by other means. Previous studies have reported that Internet delay will not easily fit the fractional ARIMA model [3], hence fGN has been used as the underlying model for Whittle in this study.
IV. UNIDIRECTIONAL DELAY ANALYSIS
End-to-end unidirectional delay measurements were taken as part of a broader measurement experiment over the two wireless infrastructures during November 2005 [17]. Two representative types of applications were instrumented, bulk TCP and CBR UDP flows streamed to the wireless clients over the W-LAN and W-WAN environments. For bulk TCP transfers, the forward and reverse paths were simultaneously instrumented. Throughout the experiments, communication ends synchronised using the Network Time Protocol (NTP) with a common stratum 1 server through additional high-speed wired network interfaces, in order to avoid having NTP messages competing with the instrumented traffic over the bottleneck wireless links. The NTP daemon was allowed sufficient time to synchronise prior to the experiments until it reached a large polling interval. The offset reported by NTP was always on the order of 10-3 or less, with respect to the
minimum one-way delay observed. All the delay traces were empirically examined against negative values as well as against linear alteration (either increase or decrease) of the minimum
delay over time. None of these offset/skew phenomena were experienced.
Delay measurements were taken upon arrival of each packet to its destination, hence at irregular time instants. In order to convert the traces to time series data, they were discretised into equally sized bins based on the packet arrival time. Delays of multiple packets arriving within each bin were averaged, and the mean delay was considered for the time series. Although this process inevitably smooths out short-term variations in packet delay, bin size was carefully selected to contain as few packets as possible, while at the same time avoiding empty bins.
The totally different characteristics of traffic between the two directions of TCP bulk transfers and the UDP streaming flows constitute their simultaneous examination particularly interesting. Figure 1 indicatively shows the burstiness preservation of the unidirectional delay experienced by the data path of a TCP flow over the W-LAN topology at varying time scales, demonstrating the absence of a characteristic size of a burst. The upper left plot shows a complete presentation of the unidirectional delay time series using one-second bins. Then, the bottom left plot shows the same time series whose first 3-second interval is “blown up” by a factor of ten, and the truncated time series has time granularity of 100 ms. Likewise, the rightmost plots show parts of the time series with an equivalent number of samples for time granularities of 500 and 50 ms, respectively. Overall, the plots show significant bursts in intraflow one-way delay at different levels spanning almost three orders of magnitude.
All LRD estimators are sensitive to phenomena such as periodicity, short-term correlations and non-stationarity in the time series and can be misled to inaccurate Hurst estimates or even to reporting LRD to non-LRD series [10]. In order to refine the LRD estimation process, we have employed a number of calibration techniques to remove and minimise the effect of such caveats. The traces have been empirically examined to ensure the absence of trends and non-stationarity such as long plateaus of high delay values. We have also used methods of controlled randomisation [8] to remove short-term correlations and periodicities that can be mistaken for LRD. Furthermore, the modified periodogram estimator has been applied on our delay traces to initially determine whether the time series agrees with a noise (rather than a motion) [4] and choose the appropriate methods for estimating H reliably. This method estimates the power spectrum of the signal by dividing the frequencies into logarithmically equally-spaced boxes and averaging the corresponding periodogram values inside each box [18]. For our traces, the slope of the resulting power spectral density plot assumed values 1− < <β 1, implying the series can be categorised as fGn, and therefore aggregate variance, R/S, and periodogram can reliably estimate H [4].
0 5 10 15 20 25 30
10
0
20
0
300
400
500
60
0
Normalised Time (Slots of 1 sec)
U
ni
di
re
ct
ion
al
D
el
ay
(
m
s)
0 5 10 15
10
0
300
500
70
0
Normalised Time (Slots of 0.5 sec)
U
ni
di
re
ct
ion
al
D
el
ay
(
m
s)
0.0 0.5 1.0 1.5 2.0 2.5 3.0
0
200
40
0
600
80
0
Normalised Time (Slots of 0.1 sec)
U
ni
di
rec
tio
nal
D
el
ay
(
m
s)
0.0 0.5 1.0 1.5
0
20
0
40
0
600
800
Normalised Time (Slots of 0.05 sec)
U
ni
di
rec
tio
nal
D
el
ay
(
m
[image:4.595.38.281.68.311.2]s)
Figure 1. Stochastic Self-Similarity – burstiness preservation across time scales of 50 ms, 100 ms, 500 ms, and 1000 ms for the bulk TCP data path over
the W-LAN network
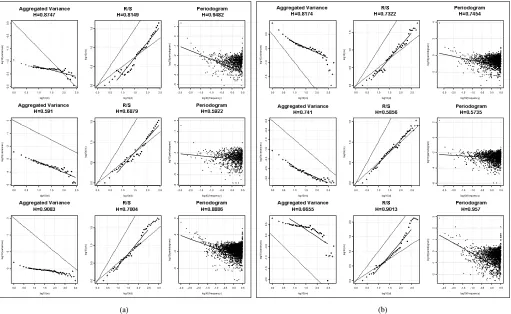
Within each group, each row-triplet shows the graphical output in log-log scale of the aggregated variance, R/S and periodogram estimation methods for the TCP data, reverse and UDP flows, respectively. All the three graphical estimation methods indicate presence of LRD in all three types of flows examined, at different intensities, suggesting that unidirectional delay exhibits long memory characteristics irrespective of the individual transport mechanisms employed. However, all graphical estimators converge to similar values of LRD intensity for unidirectional flows of the same type. On the contrary, although the W-LAN and W-WAN infrastructures assume very different modes of operation, they do not seem to contribute themselves to massively different LRD intensity, i.e. flows of the same type routed over the two different networks exhibit in most cases similar-intensity LRD. The two time-domain methods (aggregated variance and R/S) produce very similar estimates of LRD intensity greater than 0.8 for the end-to-end packet delay of the TCP data flow over the W-LAN topology. The periodogram method suggests even stronger intensity (~0.95). For the TCP data flow routed over the W-WAN network, LRD intensity is estimated between 0.7 and 0.8 by all three methods. In this case, there is a greater divergence between the estimates produced by the two time-domain methods (~0.1), and the periodogram estimate lies between the other two. For both networks, the data path of the bulk TCP transfers seem to exhibit quite strong LRD (>0.73) as this is indicated by all three graphical estimation methods. Regarding the packet delay of the TCP acknowledgment path flows over both wireless networks, all three methods agree on much more conservative LRD estimates. Over W-LAN, the Hurst exponent is estimated between 0.59 and 0.68, with the aggregated variance and periodogram methods converging at the lower boundary. Likewise, marginal-to-moderate LRD is estimated
for the TCP reverse path delay over W-WAN. The three estimators agree on H values between 0.57 and 0.67 with the periodogram estimate lying approximately in the middle between the estimates of the two time-domain methods. There is a greater diversity in the LRD estimates produced by the three graphical methods for the end-to-end delay experienced by the CBR UDP flows over the two wireless topologies. Over W-LAN, the R/S method estimates the Hurst exponent at 0.71, whereas the aggregated variance and the periodogram methods agree on much stronger LRD (>0.9). Over W-WAN, the aggregated variance method suggests moderate LRD (~0.67) whereas the R/S and the periodogram agree on much greater H
estimates (>0.9). After all the delay series being found to exhibit LRD by the three ‘detection’ estimators, Whittle was subsequently employed and the corresponding H estimates are shown in table I. With the single exception of the UDP streaming flow over the W-WAN topology, the Whittle method produces more conservative Hurst exponent estimates than the three graphical estimators. For the TCP data path flows, it suggests stronger intensity for the W-LAN traffic (>0.7) and moderate intensity for the W-WAN flows. The marginal-to-moderate intensity for the TCP reverse path flows is also supported by Whittle which produces H estimates just above 0.5 (<0.56). For the UDP flows, Whittle suggests moderate-to-strong LRD intensity assuming H values of ~0.69 and ~0.74 for traffic routed over the W-LAN and the W-WAN topologies, respectively. With two exceptions, the 95% C.I. is less than or equal to 0.03. For the delays experienced by the TCP data path and the UDP streaming flow over the W-WAN topology, the 95% C.I. reaches 0.14 and a 0.2, respectively.
V. DISCUSSION
Although all four estimators report LRD in the unidirectional delay experienced by all flows routed over the two wireless networks, there is certain diversity regarding the intensity of LRD between the different estimators. Whittle, in most cases provides a narrow 95% C.I. which suffice to characterise weak, moderate and strong LRD. Additional methods based on wavelets have also been developed [1] for LRD estimation, yet lately a consistent overestimation of the Hurst parameter on synthesized LRD series has been reported [10]. What is indisputable, however, are computed sample statistics such as ACF which exhibit nontrivial correlations at large lags.
0.0 0.5 1.0 1.5 2.0 2.5 -2 .5 -2 .0 -1 .5 -1 .0 -0 .5 0 .0 log10(m) log10( va ri anc es )
Aggregated Variance Method H = 0.8747
0.0 0.5 1.0 1.5 2.0 2.5
0. 0 0 .5 1.0 1 .5 log10(d) log10( r/ s ) R/S Method H = 0.8149
-2.5 -2.0 -1.5 -1.0 -0.5 0.0 0.5
-5 -4 -3 -2 -1 0 1 log10(frequency) log10 (per io dogr am) Periodogram Method H = 0.9482
0.0 0.5 1.0 1.5 2.0 2.5
-5 -4 -3 -2 -1 0 log10(m) log1 0( v a ri an c e s )
Aggregated Variance Method H = 0.591
0.0 0.5 1.0 1.5 2.0 2.5
0.0 0 .5 1.0 1 .5 log10(d) log1 0( r/ s ) R/S Method H = 0.6879
-2.5 -2.0 -1.5 -1.0 -0.5 0.0 0.5
-6 -5 -4 -3 -2 -1 0 log10(frequency) log10( pe ri odogr am ) Periodogram Method H = 0.5922
0.0 0.5 1.0 1.5 2.0 2.5 3.0
-3 -2 -1 0 log10(m) log1 0( v a ri an c e s )
Aggregated Variance Method H = 0.9083
0.0 0.5 1.0 1.5 2.0 2.5 3.0
0.0 0 .5 1.0 1 .5 log10(d) log1 0( r/ s ) R/S Method H = 0.7004
-3.0 -2.5 -2.0 -1.5 -1.0 -0.5 0.0 0.5
-6 -4 -2 0 log10(frequency) log10( pe ri odogr am ) Periodogram Method H = 0.8886
0.0 0.5 1.0 1.5 2.0 2.5
-1 .5 -1 .0 -0 .5 0. 0 log10(m) log10( va ri anc es )
Aggregated Variance Method H = 0.8174
0.0 0.5 1.0 1.5 2.0 2.5
0. 0 0.5 1. 0 1 .5 log10(d) log10( r/ s ) R/S Method H = 0.7322
-2.5 -2.0 -1.5 -1.0 -0.5 0.0 0.5
-2024 log10(frequency) log10 (per io dogr am) Periodogram Method H = 0.7454
0.0 0.5 1.0 1.5 2.0 2.5
-3 .0 -2 .5 -2 .0 -1 .5 -1 .0 -0 .5 0 .0 log10(m) log1 0( v a ri an c e s )
Aggregated Variance Method H = 0.741
0.0 0.5 1.0 1.5 2.0 2.5
0.0 0 .5 1.0 1 .5 log10(d) log1 0( r/ s ) R/S Method H = 0.5856
-2.5 -2.0 -1.5 -1.0 -0.5 0.0 0.5
-6 -4 -2 0 2 log10(frequency) log10( pe ri odogr am ) Periodogram Method H = 0.5735
0.0 0.5 1.0 1.5 2.0 2.5
-2 .0 -1 .5 -1 .0 -0 .5 0.0 0 .5 log10(m) log1 0( v a ri an c e s )
Aggregated Variance Method H = 0.6655
0.0 0.5 1.0 1.5 2.0 2.5
0.0 0 .5 1. 0 1 .5 2. 0 log10(d) log1 0( r/ s ) R/S Method H = 0.9013
-2.5 -2.0 -1.5 -1.0 -0.5 0.0 0.5
[image:5.595.44.555.53.367.2]-2 -1 0 1 2 3 log10(frequency) log10( pe ri odogr am ) Periodogram Method H = 0.957
Figure 2. The three graphical LRD estimation methods applied to the three different flow types routed over the (a) W-LAN and (b) W-WAN configurations, respectively. (Upper row): TCP data path. (Middle row): TCP reverse path. (Lower row): CBR UDP streaming flow. In each row triplet:- (Leftmost plot):
[image:5.595.44.285.449.576.2]Aggregated Variance method. (Middle plot): R/S method. (Rightmost plot): Periodogram method.
TABLE I. HURST EXPONENT ESTIMATES USING THE WHITTLE METHOD
Whittle Estimator Microflow
H estimate & 95% C.I.
TCP data path [W-LAN] 0.7386717 ± 0.025
TCP data path [W-WAN] 0.599419 ± 0.15
TCP reverse path [W-LAN] 0.5523367 ± 0.007
TCP reverse path [W-WAN] 0.5282069 ± 0.014
CBR UDP [W-LAN] 0.6865489 ± 0.003
CBR UDP [W-WAN] 0.741881 ± 0.20
Figure 4 shows the LLCD plots of the unidirectional flows with moderate-to-strong LRD over the two wireless media. Each plot also includes the LLCD of an analogous rate (1/mean) and size exponential distribution. It can be seen that, mainly, the tails of the distributions decay at a sub-exponential rate. For the UDP flow over the W-LAN network, the tail, although heavier than exponential, has an index greater than 2. Hence the distribution is not considered as heavy-tailed in the traditional infinite variance sense. The non-heavy-tailness of the distributions is consistent with fGn. However, LRD behaviour exhibited by packet delay over all wireless paths can have an intimate relationship with other, heavy-tailed network
phenomena at the level of individual store-and-forward engines, queues, and transport-layer mechanisms.
VI. CONCLUSION
We have examined the unidirectional delay behaviour of different traffic types routed over diverse wireless topologies, which admittedly suffer from disproportionally large and variable delays with respect to wired network infrastructures. After rigorous analysis we found clear LRD behaviour in the packet delay of bulk TCP data path and UDP traffic, implying highly variable delays for arbitrary long time intervals. This result can hence have a significant impact on the design of packetisation mechanisms towards improving the end-to-end network service delivery.
Accurate estimation of LRD intensity proved rather challenging. Nevertheless, estimators seem to all agree on a coarser classification of weak-moderate-strong LRD.
0 5 10 15 20 25 30
0.
0
0.
2
0.
4
0.
6
0.
8
1.
0
Lag
AC
F
TCP Data Path
0 5 10 15 20 25 30
0.
0
0.
2
0.
4
0.
6
0.
8
1.
0
Lag
AC
F
TCP Reverse Path
0 5 10 15 20 25 30 35
0.
0
0.
2
0.
4
0.
6
0.
8
1.
0
Lag
AC
F
[image:6.595.80.513.57.202.2]CBR UDP
Figure 3. Autocorrelation function (ACF) of the packet delay time series over the W-LAN network. (Left): TCP data path. (Middle): TCP reverse path. (Right): CBR UDP streaming flow
1 2 3 4 5 6 7
-7
-6
-5
-4
-3
-2
-1
0
TCP Data Flow - WLAN
Log10(One-Way Delay in ms)
Log10
(P
[X>
x])
OWD Process Exponential Process
6 7 8 9
-6
-4
-2
0
TCP Data Flow - WWAN
Log10(One-Way Delay in ms)
Log10
(P
[X>
x])
OWD Process Exponential Process
1 2 3 4 5 6
-8
-6
-4
-2
0
CBR UDP Flow - WLAN
Log10(One-Way Delay in ms)
Log10
(P
[X>
x])
OWD Process Exponential Process
6.0 6.5 7.0 7.5 8.0 8.5 9.0
-7
-6
-5
-4
-3
-2
-1
CBR UDP Flow - WWAN
Log10(One-Way Delay in ms)
Log10
(P
[X>
x])
OWD Process Exponential Process
Figure 4. LLCD plots of the unidirectional delay time series data
Future work will focus on the comparative delay analysis of very-long-lived flows routed over wired and wireless infrastructures, and on the relation between LRD behaviour in delay and other network and transport-layer phenomena.
REFERENCES
[1] P. Abry and D. Veitch. Wavelet Analysis of Long-Range Dependence
Traffic. In IEEE Transactions on Information Theory, 1998.
[2] J. Beran, Statistics for Long-Memory Processes. Monographs on
Statistics and Applied Probability, Chapman and Hall, NY, 1994
[3] M. S. Borella and G. B. Brewster, Measurement and Analysis of
Long-Range Dependent Behaviour of Internet Packet Delay, Proceedings, IEEE Infocom '98, pp. 497-504, Apr. 1998
[4] M. J. Cannon, D. B. Percival, D. C. Caccia, G. M. Raymond, J. B.
Bassingthwaighte, Evaluating scaled windowed variance methods for estimating the Hurst coefficient of time series. Physica A, 241, 1997
[5] R. Chakravorty, J. Cartwright, I. Pratt, Practical experience with TCP
over GPRS, in Proceedings of the IEEE GLOBECOM’02, Taiwan, 2002
[6] M. E. Crovella and A. Bestavros, Self-similarity in World Wide Web
traffic: Evidence and possible causes, IEEE/ACM Trans. on Net., 5(6):835 - 846, 1997
[7] D. Delignieres, S. Ramdani, L. Lemoine, K. Torre, M. Fortes, G. Ninot, Fractal analyses for ‘short’ time series : a re-assessment of classical methods, Journal of Mathematical Psychology, Vol. 50:525-544, 2006
[8] E. Erramilli, O. Narayan, W. Willinger, Experimental queuing analysis
with long-range dependent packet traffic, IEEE/ACM Transactions of Networking, 4(2):209-223, 1996
[9] G. Fotiadis, V. Siris, Improving TCP throughput in 802.11 WLANs with
high delay variability”. In Proc. ISWCS’05, Italy, September 2005.
[10] T. Karagiannis, M. Molle, M. Faloutsos, Understanding the limitations
of estimation methods for long-range dependence, Technical Report, University of California, Riverside, TR UCR-CS-2006-10245, 2006
[11] W. E. Leland, M. Taqqu, W. Willinger, D. V. Wilson, On the
Self-Similar Nature of Ethernet Traffic (extended version), IEEE/ACM Transactions on Networking (TON), Vol. 2 (1), pp. 1 – 15, 1994
[12] Q. Li and D. L. Mills. On the long-range dependence of packet
round-trip delays in internet. In Proceedings of IEEE ICC'98, Atlanta, 1998
[13] Mobile IPv6 Systems Research Laboratory (MSRL), on-line resource,
available at: http://www.mobileipv6.net/
[14] K. Park and W. Willinger (eds.), Self-Similar Network Traffic and
Performance Evaluation. John Wiley & Sons, NY, USA, 2000
[15] V. Paxson and S. Floyd, Wide-area traffic: The failure of Poisson
modelling, IEEE/ACM Trans. on Networking, 3(3):226--244, 1994. [16] D. P. Pezaros, D. Hutchison, F. J. Garcia, R. D. Gardner, J. S. Sventek,
In-line Service Measurements: An IPv6-based Framework for Traffic Evaluation and Network Operations, in Proc. NOMS’04, Seoul, Korea, April 19-23, 2004
[17] D. P. Pezaros, M. Sifalakis, D. Hutchison, End-To-End Microflow
Performance Measurement of IPv6 Traffic Over Diverse Wireless Topologies, in Proc. WICON'06, Boston, MA, August 2-5, 2006
[18] M. S. Taqqu, V. Teverovsky, and W. Willinger, Estimators for
long-range dependence: An empirical study. Fractals 3(4):785—798, 1995
[19] W. Willinger, V. Paxson, and M. S. Taqqu, Self-similarity and heavy
[image:6.595.57.539.256.393.2]