http://dx.doi.org/10.4236/ajps.2014.52029
Soil Temperature and Phosphorus Supply Interactively
Affect Physiological Responses of White Birch to CO
2
Elevation
Gabriel Danyagri, Qing-Lai Dang*
Faculty of Natural Resources Management, Lakehead University, Thunder Bay, Ontario, Canada. Email: *[email protected]
Received November 8th, 2013; revised December 12th, 2013; accepted January 8th, 2014
Copyright © 2014 Gabriel Danyagri, Qing-Lai Dang. This is an open access article distributed under the Creative Commons Attribu-tion License, which permits unrestricted use, distribuAttribu-tion, and reproducAttribu-tion in any medium, provided the original work is properly cited. In accordance of the Creative Commons Attribution License all Copyrights © 2014 are reserved for SCIRP and the owner of the intellectual property Gabriel Danyagri, Qing-Lai Dang. All Copyright © 2014 are guarded by low and by SCIRP as a guardian.
ABSTRACT
Phosphorus (P) is a common limiting nutrient element to plants and its supply and uptake by plants are strongly influenced by soil temperature. However, the interactive effects of the two factors on the physiological responses of plants to global change are poorly understood. In this study, we examined how P supply and Tsoil interacted in
affecting physiological responses in white birch (Betula papyrifera) to [CO2]. We exposed seedlings to 7˚C, 17˚C
and 27˚C Tsoil, 0.1479, 0.3029 and 0.5847 mM P2O5, and 360 and 720 µmol∙mol−1 [CO2] for four months. We have
found that both the low soil temperature and CO2 elevation resulted in photosynthetic down regulation but the
specific mechanisms of the down regulation were different between the two treatments, particularly the relative contributions of biochemical and photochemical capacity, mesophyll conductance and sink strength for carbo-hydrate utilization to the down regulation. Furthermore, our data suggest that morphological adjustments, such as reduced leaf size and total leaf area, were the primary form of responses in white birch to low phosphorus supply and no significant physiological acclimation to P supply was detected. Our results suggest that white birch will likely enhance water use efficiency under the projected future climate conditions with doubled carbon dioxide concentration, particularly at warmer soil temperatures. Although a trade-off between water use effi-ciency and nutrient use effieffi-ciency is widely accepted, our results suggest that there does not have to be a trade-off between the two, for instance, CO2 elevation increased both use efficiencies and low soil temperature and
re-duced nitrogen efficiency without affecting water use efficiency under elevated CO2.
KEYWORDS
Betula papyrifera Mash; Foliar Gas Exchange; Water-Use-Efficiency; Stomatal Conductance; Rubisco; Boreal
Trees; Climate Change
1. Introduction
Photosynthetic carbon fixation by trees is the primary contributor to the total productivity of forest ecosystems. A good understanding of how increases in atmospheric CO2 concentration ([CO2]) will affect the photosynthesis
of trees will be critical for understanding how climate change will affect the structure, functioning and produc-tivity of forest ecosystems. Photosynthetic responses to CO2 elevations can vary with species, the physiological
conditions of plants and environmental conditions. For example, CO2 elevations generally result in a down-
regulation of photosynthetic capacity in plants that are nutrient-stressed [1-8]. Most studies have shown that nutrient deficiency reduces the benefits of CO2 elevation
to plants [2,6,7,9]. However, past studies have generally focused on nitrogen because it generally is the most lim-iting nutrient element to plants in the field [6,8,10,11]. As another key nutrient element for photosynthesis, phosphorus (P) is often the most limiting or second most limiting element to the aboveground primary productivity
of forests [12]. However, the effect of P supply on pho-tosynthetic response to CO2 is not well studied.
P is an essential element for some vital structural and metabolic functions of plants and its deficiency can re-duce energy transfer and even lead to a breakdown of cell membranes [13]. P deficiency can limit photosynthe-sis either indirectly by reducing the total leaf area of a plant [14], or more directly by reducing Rubisco activity and RuBPregeneration [15-18]. Studies using isolated chloroplasts and other in-vitro systems show that P is involved in the activation of Rubisco [19], the modula-tion of ribulose-5-phosphate kinase and fructose-l,6-bis- phosphate phosphatase [20], the transport of triose- phosphate (TP) across the chloroplast membrane by the Pi-translocator and the regulation of photophosphoryla-tion [21]. Rao and Terry [22] have found that a defi-ciency in inorganic phosphate (Pi) results in a substantial increase in non-stomatal limitation to photosynthesis. All of the above physiological processes can affect photo-synthetic responses to CO2 elevation. Tissue and Lewis
[23] have demonstrated that P deficiency reduces the positive effect of CO2 elevation on photosynthesis in
cottonwood.
Soil temperature (Tsoil) also affects plant responses to
CO2 elevations. Low Tsoil reduces root permeability and
increases water viscosity, leading to a decrease in shoot water potential (Ψ) and stomatal conductance (gs) [5,24,
25]. Reductions in gs and shoot water potential in turn
can affect photosynthetic responses to CO2 elevation [5,
25]. For example, low Tsoil is found to reduce the positive
effect of CO2 elevations on photosynthesis in various tree
species [5,26-29]. Low Tsoil can also reduce the
synergis-tic effect of CO2 elevation and high N supply on
photo-synthesis [28] and growth [29]. However, the decline in gs at low Tsoil does not necessarily lead to a reduction in
photosynthesis in all species [30,31]. Furthermore, low Tsoil has also been observed to reduce the absorption of
mineral nutrients directly and/or indirectly by reducing root growth [32-35] or mycorrhizal formation [36]. The availability and absorption of P are particularly sensitive to soil temperature in the boreal forest where it is primar-ily absorbed through mycorrhizae because of the immo-bility of the element [25]. However, it is not clear how P supply and soil temperature will interact in affecting tree’s physiological responses to CO2 elevations. As the
global warming progresses in response to increasing at-mospheric [CO2] and other greenhouse gases, changes in
Tsoil will be inevitable because of changes in the depth
and duration of snow cover and soil freezing [37]. How-ever, soil warming generally lags behind changes in air temperature. Low Tsoil is prevalent in the boreal forest,
particularly at sites with poor drainage and northern and eastern slopes [38,39]. The combination of warmer air temperature and cold soil may severely constrain the response of boreal forests to climate change. Low Tsoil
may have been a contributing factor to the wide spread damages to boreal trees by unseasonal warm tempera-tures [40].
A better understanding of the interactive effects of P supply and Tsoil on the physiological responses of trees to
CO2 elevations will be critical for predicting the potential
responses of boreal forests to climate changes associated with rising atmospheric [CO2]. This study investigates
the interactive effects of P supply and soil temperature on the physiological responses of white birch (Betula pa-pyrifera Marsh) to the doubling of atmospheric CO2
concentration. Since low soil temperature restricts P ab-sorption by roots and P deficiency can lead to photosyn-thetic down regulation at elevated [CO2], we hypothesize
that low Tsoil will result in a greater degree of
photosyn-thetic down-regulation under elevated [CO2], particularly
when P supply is low.
2. Materials and Methods
2.1. Plant Materials
The experiment was conducted at the Thunder Bay cam-pus of Lakehead University. White birch seeds were col-lected from the boreal forest near Thunder Bay and ger-minated in horticultural trays (28 cm × 56 cm) filled with a mixture of Sphagnum peat moss and horticultural ver-miculite (2:1 by volume). This composition has a very high cation exchange, low inherent fertility, a slightly acidic pH (maximizing the availability of all nutrient elements) and a good balance of water holding and aera-tion porosity [41]. Seedlings of relatively uniform height were transplanted into PVC containers (31.5 cm deep, 11/9.5 cm top/bottom diameter) after 4 weeks of germi-nation and moved to treatment greenhouses as described below.
2.2. Experimental Design
The experiment was a split-split-plot design consisting of two CO2 concentrations (360 ambient vs. 720 elevated
µmol∙mol−1, main plot), three T
soil (split plot) nested
within each CO2 treatment (7˚C, 17˚C and 27˚C) and
three levels of P supply (split-split plot) nested within each Tsoil (0.1479, 0.3029 and 0.5847 mM P2O5, or
0.2958, 0.6058 and 1.1694 mM P). The soil temperatures and P levels were determined based on the field condi-tions within the ecological range of the species. Nitrogen and potassium concentrations were 221 and 150 mg/L, respectively, in all treatments. There were two inde-pendent replications (greenhouses) for each CO2
regulated by circulating temperature-controlled water in the space between seedling pots within the large box. The box was insulated to minimize the influence of air temperature on Tsoil. Further details on the soil
tempera-ture control system can be found in [42]. The day/night temperatures were 20˚C - 26˚C/15˚C - 18˚C and the photoperiod was 16 hours in all the treatments. All the seedlings were fertilized twice a week with 0.5 L fertil-izer solution (which saturated the growing medium). The seedlings were watered frequently to maintain the volu-metric water content of the growing medium above 30% as measured with an HH2 moisture meter and a Theta probe (Delta-T Devices Ltd., Cambridge, UK). The tem-perature of the fertilizer solution and irrigation water was adjusted to the corresponding treatment Tsoil.
White birch is a shade intolerant tree species [43]. It can grow to its full potential under 45% of full sunlight or above. It is very sensitive to moisture, temperature, nutrient and light conditions during the seedling stage. Its seasonal growth can start while daily minimum tempera-ture is below freezing. Seedling height growth can be prolonged indefinitely under long photoperiods [43].
2.3. Gas Exchange Measurements
Six seedlings per treatment combination were randomly selected for measuring photosynthetic response curves to [CO2] after four months of treatment. The measurements
were taken using a CIRAS-1 open gas exchange system with an automatic environment control leaf chamber (PP-Systems, Hitchin Hertfordshire, UK) on the first unshaded mature leaf from the top of the seedling (3rd to 5th from the tip). All measurements were taken between 0900 and 1200 hr when gas exchange variables were stable. The environmental conditions in the leaf chamber were as follows: 50% RH, 800 µmol m−2∙s−1 PAR and 26 ˚C leaf temperatures. The A/Ci response curve was
measured at 50, 100, 150, 250, 300, 500, 700, 900 and 1500 µmol∙mol−1 CO
2. The rate of net photosynthesis at
the corresponding growth [CO2] (i.e., 720 and 360
µmol∙mol−1
for the elevated and ambient CO2 treatment,
respectively) (Pn) and the rate at 360 µmol∙mol−1 [CO2]
for both CO2 treatments (Pn360), transpiration rate and
stomatal conductance (gs) were estimated from the
re-sponse curve of the relevant parameter to measurement [CO2]. Photosynthetic water use efficiency was
calcu-lated as IWUE= Pn/transpiration. The rate of in vivo
maximal Rubisco carboxylation (Vcmax), rate of
photo-synthetic electron transport (J), triose-phosphate utiliza-tion (TPU) and mesophyll conductance (gm) were
calcu-lated using the A/Ci Curve Fitting Utility version 1.1 developed by Sharkey et al. (2007).
2.4. Leaf Nutrient (N, P, K) Assays
Total foliar nitrogen was analyzed using the LECO CNS
2000 dry combustion method [44] and P and K were analyzed using nitric/hydrochloric acid digestion method [45,46]. The nutrient concentrations were expressed on the basis of leaf area and leaf mass. Photosynthetic Ni-trogen- and P-use efficiencies (hereafter referred to as NUE and PUE, respectively) were calculated by dividing Pn by the corresponding leaf area-based concentration.
2.5. Data Analysis
The Analysis of Variance (ANOVA) were conducted using the Data Desk 6.0 statistical package (Data De-scription, Ithaca, NY) on the original variables (i.e., no data transformation) since tests showed both ANOVA assumptions (i.e., normality and homogeneity) were sat-isfied. When a factor with more than two levels (i.e., Tsoil
and P) or an interaction was significant, multiple com-parisons were conducted using the Least Square Differ-ence (LSD) method. Because of the relatively small sample size in this study and consequently small degree of freedom for the experiment error in the F test (leading to a larger denominator in F calculation), it is more likely for true treatment effects go undetected (Type II error) [47,48]. Therefore we considered a probability above 0.05 but below 0.10 as marginally significant but the interpretation of such results was taken with great pre-caution. Such a practice is also used in other studies (e.g., [48-50]. However, we have presented the actual prob-ability values in both figures and tables so that the read-ers can make their own judgement.
3. Results
3.1. Gas Exchange
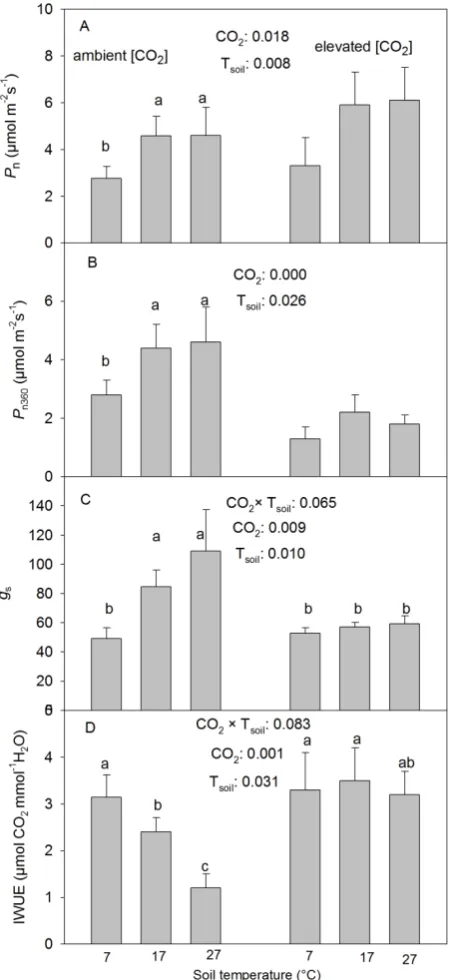
The CO2 elevation significantly increased the
photosyn-thetic rate (Pn) at the corresponding treatment [CO2] but
reduced Pn360 (Table 1, Figure 1(A)). The low Tsoil
sig-nificantly reduced Pn and Pn360 but there were no
signifi-cant differences found between the intermediate and high Tsoil at either CO2 treatment (Table 1, Figures 1(A) and
(B)).
The CO2 elevation significantly reduced the stomatal
conductance (gs) at the intermediate and high but not at
the low Tsoil (Table 1, Figure 1(C)). Tsoil had similar
effects on gs as it did on Pn and Pn360 under the ambient
[CO2] but had no significant effect found on gs under the
elevated [CO2] (Table 1, Figures 1(A)-(C)).
The photosynthetic water use efficiency (IWUE) de-creased with increasing Tsoil under the ambient [CO2] but
was not significantly influenced by Tsoil under the
ele-vated [CO2] (Table 1, Figure 1(D)). The CO2 elevation
significantly increased IWUE at the intermediate and high but not at the low Tsoil (Figure 1(D), Table 1).
Table 1. Probabilities from ANOVA for the effects of soil temperature (Tsoil), phosphorus supply (P) and [CO2] on net
photo-synthetic rate at growth [CO2] (Pn), photosynthetic rate measured at a common [CO2] (Pn360), stomatal conductance to water
(gs), instantaneous water-use-efficiency (IWUE), mesophyll conductance to CO2 (gm), intercellular/atmospheric [CO2] ratio at
the growth [CO2] (Ci/Ca), maximum rate of carboxylation (Vcmax), rate of photosynthetic electron transport (J) and
tri-os-phosphate utilization (TPU) in white birch seedlings. The seedlings were grown at 360 and 720 µmol∙mol−1 [CO2]; 7˚C,
17˚C and 27˚C Tsoil and 241, 493 and 951 mg/L P supply. The soil temperatures and P levels were determined based on the
field conditions within the ecological range of the species. Significant probabilities were bold-faced.
Source of variation CO2 Tsoil CO2 × Tsoil P CO2 × P Tsoil × P CO2 × Tsoil× P
Pn 0.0184 0.0084 0.9429 0.4129 0.8592 0.873 0.6331
Pn360 <0.0001 0.0258 0.2246 0.4950 0.9930 0.9209 0.9887
gs 0.0091 0.0103 0.0652 0.9889 0.8845 0.9918 0.9492
IWUE 0.0012 0.0306 0.0825 0.9512 0.9921 0.9826 0.8020
gm 0.7440 0.0008 0.0177 0.9688 0.9233 0.4105 0.9202
Ci/Ca 0.1964 0.5460 0.4202 0.9188 0.4634 0.4663 0.8509
Vcmax 0.0620 0.1321 0.0584 0.0733 0.2427 0.4141 0.5745
J 0.1457 0.0002 0.0399 0.1755 0.5823 0.2122 0.6157
TPU 0.1096 ≤0.0001 0.1209 0.0286 0.3036 0.4961 0.4485
ments: at the ambient [CO2], gm was the lowest at the low
Tsoil while there were no significant differences between
the other two Tsoil; at the elevated [CO2], gm was the
lowest at the high Tsoil and highest at the intermediate
Tsoil (Figure 2(A)). The CO2 elevation significantly
in-creased gm at the low Tsoil but had no significant effect at
other temperatures (Figure 2(A)). The internal to am-bient CO2 concentration ratio at the corresponding
growth [CO2] (Ci/Ca) was not significantly affected by
any of the treatments (Table 1).
3.2. In Vivo Biochemical and Rubisco Activities
Both the maximum rate of Rubisco carboxylation (Vcmax)
and the rate of photosynthetic electron transport (J) had the highest value at the intermediate Tsoil while there
were not significantly differences between the low and high Tsoil at the ambient [CO2] (Table 1, Figures 2(B)
and (C)). At the elevated [CO2], in contrast, Tsoil did not
significantly affect Vcmax but J was significantly lower at
the high than at the intermediate Tsoil (Figure 2(C)). The
CO2 elevation significantly reduced Vcmax only at the
intermediate Tsoil and J at both intermediate and high Tsoil
(Figures 2(B) and (C)). Furthermore, Vcmax generally
increased with increasing P supply but the effect was not statistically significant at 0.05 P level. Although the P effect appeared to be affected by [CO2] and Tsoil, the
in-teractions were not statistically significant (Figure 2(B),
Table 1).
The low Tsoil significantly reduced the rate of triose
phosphate utilization (TPU) (Table 1, Figure 2(D)). TPU generally increased with increasing P supply but the difference between the low and intermediate P levels was
not statistically significant (Figure 2(D)).
3.3. Foliar Nutrient Concentrations and Nutrient Use-Efficiencies
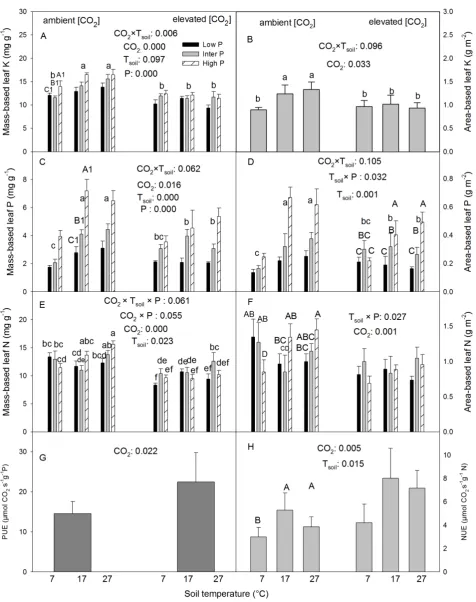
The low Tsoil significantly reduced leaf K concentrations
at the ambient but not at the elevated [CO2] (Table 2,
Figures 3(A) and (B)). The CO2 elevation significantly
reduced foliar K concentrations at the intermediate and high but not at the low Tsoil (Figures 3(A) and (B)). Mass
based foliar K concentration increased with increasing P supply (Figure 3(A)).
The low Tsoil significantly reduced both mass based
(Pm) and leaf area based P concentration (Pa) under the
ambient [CO2] but not under the elevated [CO2] (Table 2,
Figures 3(C) and (D)). The CO2 elevation significantly
reduced both Pm and Pa at the intermediate and high Tsoil
but not at the low Tsoil (Figures 3(C) and (D)). As with
Km, Pm at all three Tsoil and Pa at the intermediate and
high Tsoil increased with increasing P supply (Figures
3(C) and (D)); The low Tsoil decreased Pm at all three P
levels (Figure 3(C)) while it reduced Pa only in the high
P treatment (Figure 3(D)).
Nm generally increased with increasing P supply under
the ambient [CO2] and high Tsoil while there was no clear
trend in other treatment combinations (Table 2, Figure 3(E)). The CO2 elevation generally decreased Nm with
some minor variations with P and Tsoil (no clear patterns,
Figure 3(E)). The effects of Tsoil also varied with [CO2]
and P levels but did not show clear general patterns ex-cept the low Tsoil reduced Nm at the low P level under
elevated [CO2] (Figure 3(E)). Na was the highest at low
Figure 1. Effects of CO2 concentration and soil temperature
(Tsoil) on the rate of net photosynthesis at growth CO2 (Pn)
and the rate measured at a common ambient CO2
concen-tration (Pn360), stomatal conductance to water (gs) and
in-stantaneous water-use-efficiency (IWUE) (mean + SE, n = 6) in white birch seedlings. The seedlings were grown under two [CO2] (360 and 720 µmol∙mol−1), three Tsoil (7˚C, 17˚C
and 27˚C) and 3 levels of P supply (0.1479, 0.3029 and 0.5847 mM P2O5). Means with the same letter(s) over them
are not significantly different from one another (p > 0.10). Only significant treatments were labeled. Tsoil effects are
labeled only on the side of the ambient [CO2] since there
were no significant interactions between CO2 and Tsoil (p >
0.10). ***: p ≤ 0.01; **: 0.01 < p ≤ 0.05; *: 0.05 < p ≤ 0.10.
Figure 2.Effects of CO2, Tsoil and P on mesophyll
conduc-tance to CO2 (gm), maximum rate of carboxylation (Vcmax),
rate of photosynthetic electron transport (J) and rate of triose-phosphate utilization (TPU) in white birch seedlings. Means with the same letter(s) or number(s) are not signifi-cantly different from each other (p > 0.10). Other explana-tions are as in Figure 1.
the trend was the opposite at other TsoilTable 2, Figure
3(F)). The CO2 elevation significantly reduced Na (Table
2, Figure 3(F)).
The CO2 elevation significantly increased both
[image:5.595.62.289.88.579.2]\
Figure 3. Effects of CO2, Tsoil and P on foliar nutrient concentrations and photosynthetic N and P use efficiency in white birch
seedlings. Non-significant effects were pooled in Figures B, G and H to provide a clearer presentation of significant effects. In Figure D, upper case letters indicate Tsoil × P interactions while lower case letters are for CO2 × Tsoil interactions. Other
Table 2. Probabilities from ANOVA for the effects of Tsoil, P supply and [CO2] on mass-based leaf potassium concentration
(Km), area-based leaf potassium concentration (Ka), mass-based leaf phosphorus concentration (Pm), area-based leaf
phos-phorus concentration (Pa), mass-based leaf nitrogen concentration (Nm), area-based leaf nitrogen concentration (Na),
photo-synthetic phosphorus use-efficiency (PUE), nitrogen use efficiency (NUE) and total leaf area per seedling in white birch. Oth-er explanations are as in Table 1.
Source of variation CO2 Tsoil CO2 × Tsoil P CO2 × P Tsoil × P CO2 × Tsoil × P
Km <0.0001 0.0967 0.0064 0.0002 0.2653 0.6605 0.6798
Ka 0.0329 0.1265 0.0956 0.1215 0.3877 0.1349 0.9885
Pm 0.0160 0.0003 0.0618 <0.0001 0.1649 0.3363 0.4456
Pa 0.1410 0.0012 0.1046 <0.0001 0.1378 0.0316 0.6929
Nm <0.0001 0.0234 0.3268 0.1756 0.0548 0.1137 0.0609
Na 0.0014 0.6367 0.7479 0.7249 0.4644 0.0271 0.5478
PUE 0.0218 0.2474 0.2109 0.1773 0.9743 0.7295 0.9954
NUE 0.0051 0.0146 0.5792 0.2863 0.4205 0.3170 0.7479
the NUE (Table 2, Figure 3(H)).
4. Discussion
Both the CO2 elevation and low soil temperature led to
photosynthetic down-regulation in white birch but the physiological mechanisms of the down-regulation dif-fered. Photosynthetic measurements at 360 µmol∙mol−1 CO2 suggest that both the low Tsoil and CO2 elevation
caused a down-regulation of photosynthesis, but the phy-siological processes/traits associated with the down reg-ulation were different between the two treatments. While the declines in stomatal conductance contributed to pho-tosynthetic down regulation in both treatments, weakness in sink strength for the utilization of photosynthates (as indicated by the rate of triose phosphate utilization,) was only a contributing factor in the low soil temperature treatment. The contributions of mesophyll conductance and biochemical and photochemical capacity to photo-synthetic down regulation were complicated by the inte-ractions between CO2 and soil temperature. For example,
the low Tsoil-induced decline in Pn360 was associated with
declines in mesophyll conductance under the ambient [CO2], but not under the elevated [CO2]. The CO2
eleva-tion resulted in significant declines in the maximum rate of Rubisco carboxylation, photosynthetic electronic trans-port and mesophyll conduction in some but not all soil temperatures.
The effects of low Tsoil on foliar gas exchange are
complicated, involving interactions between below- ground and above-ground parts of the plant [5,24,25]. Larger sample sizes and more comprehensive diagnostic measurements including the measurement of additional characteristics (such as chlorophyll fluorescence para-meters, analyses of water relations) may be necessary to discern the physiological mechanisms governing the
changes in photosynthesis in response to the above two situations. Regardless of the mechanisms, the photosyn-thetic acclimation to elevated CO2 was partial since the
photosynthetic rates measured under the corresponding growth CO2 concentration were significantly greater
un-der the elevated than unun-der the ambient CO2
concentra-tion. A complete acclimation would have resulted in a photosynthetic rate at the elevated [CO2] being equal to
that at the ambient [CO2].
The conclusions of photosynthetic down regulation varied with the specific parameters used in this study. Photosynthetic down regulation is assessed using several different variables in the literature. The maximum rate of Rubisco carboxylation (Vcmax) and maximum rate of
photosynthetic electron transport (J) are often used to indicate changes in the biochemical capacity and photo-chemical capacity of the photosynthetic machinery [2,5, 7,51,52]. Although there was a decline in both parame-ters associated with the low soil temperature under the ambient CO2 in this study, it was not the case under
ele-vated CO2; furthermore, there was no decline in Vcmax or
Jin response to the CO2 elevation. Pn360 is often used as
an indicator of the integrated acclimation of photosyn-thetic capacity and stomatal conductance [8,52,53]. To a certain degree, differences in Pn360 reflect a shift in both
the supply function and demand function of photosyn-thesis [25]. However, as discussed previously, the changes in Pn360 in this study primarily reflect changes in
the supply function, i.e., the effects of stomatal conduc-tance. These results suggest that Pn360 can be used to
in-dicate the magnitude of photosynthetic down regulation but offers no clue to the mechanisms responsible for the down regulation unless it is considered in conjunction with other parameters. Moreover, Pn360 will not be of any
concen-tration because plants will not likely experience the present atmospheric CO2 concentration in the future once
the CO2 concentration in the atmosphere is doubled.
The data suggest that white birch will likely have higher water use efficiency (WUE) in the future under elevated atmospheric CO2 concentration, particularly
under warmer soil temperatures. The significant increase in photosynthetic rate and simultaneous decline in sto-matal conductance both contributed to the increase in water use efficiency under the elevated CO2. However,
such changes did not occur at the low soil temperature. In fact, the water use efficiency declined with increasing soil temperature at the ambient CO2 concentration. At the
elevated CO2, in contrast, WUE at warmer soil
tempera-tures (17˚C and 27˚C) was as high as that at the low soil temperature (7˚C). These results suggest that in the future the photosynthesis of white birch can be increased by warmer soil temperatures without compromising water use efficiency, which occurred under the ambient CO2
concentration. While the soil temperature will most like-ly increase as the global air temperature increases, further increases in soil temperature can be achieved through silvicultural means, such as site preparation [54] and ma-nipulation of canopy coverage [55] and soil moisture [38]. The lack of significant responses in stomatal con-ductance to the CO2 elevation under the adverse soil
temperature (i.e., 7˚C) could be interpreted as that the
stomatal conductance at the low soil temperature was already at such a low level that it could not go down any further. However, it is also possible that the low soil temperature reduced root growth and thus water intake and transport, which indirectly affected the stomatal conductance and photosynthesis through its impact on leaf water relations [56].
Our results demonstrate that the tradeoff between wa-ter use efficiency and nutrient use efficiency depends on the driving factor or factors that cause changes in their use efficiencies. Generally there is a tradeoff between water use efficiency and nutrient use efficiency [25]. Such a tradeoff exists because within the normal operat-ing range of internal CO2 concentration an increase in
stomatal conductance will lead to a linear increase in transpiration rate but a curvilinear (thus smaller) increase in photosynthesis, resulting in a decrease in water use efficiency (ratio of photosynthesis to transpiration). On the other hand, any increase in photosynthesis will result in an increase in nutrient use efficiency since nutrient concentrations in leaves are constant over a short period of time [25]. Physiological acclimations will complicate the issue. In this study, the low soil temperature in-creased water use efficiency and dein-creased nitrogen use efficiency under the ambient CO2 concentration. Under
the elevated CO2, in contrast, the low soil temperature
decreased nitrogen use efficiency without a
correspond-ing increase in water use efficiency. Furthermore, the CO2 elevation increased both nitrogen use efficiency and
water use efficiency.
The low soil temperature and low P supply did not af-fect the CO2 elevation induced photosynthetic down
reg-ulation in white birch. The hypothesis that the degree of photosynthetic down-regulation in response to CO2
ele-vation would be greater under low Tsoil and low P supply
was based on the argument that the low Tsoil would
sup-press the uptake of phosphorus and the resulting lower P concentration in the foliage would in turn exacerbate the photosynthetic down regulation induced by CO2
eleva-tion because of the low availability of inorganic phos-phorus for the Kelvin Cycle of photosynthesis [25]. However, the basis for the hypothesis did not hold in this study. While there was indeed a significant interaction between soil temperature and phosphorus supply on leaf area based P concentration, soil temperature did not sig-nificantly affect foliar P in the low P treatment. Further-more, P supply did not significantly affect foliage P in the low soil temperature treatment. Therefore, it is not surprising that the indicators for photosynthetic down regulation did not vary in the way proposed in the hy-pothesis.
Our results suggest that white birch seedlings re-sponded to low P supplies morphologically by reducing the size and total number of leaves rather than through physiological adjustment. No significant physiological response to low P supply was detected in this current study. However, we have previously found that the low P supply led to significantly smaller-sized leaves and smaller amount of leaves per tree [57], indicating a dif-ferent strategy that white birch used in coping with low P supply than some other tree species. For instance, Tissue and Lewis [23] have reported that low P supplies dimin-ish the positive effect of CO2 elevation on light saturated
rate of photosynthesis. We offer two explanations for the different responses between the two studies. Firstly, it is possible that different species respond differently. Plants can respond to P deficits physiologically, morphologi-cally or both [25]. Maybe the prevalent form of response varies with species. Secondly, the range of P supply was different between the two studies. While the P level in the high P treatment of [23] was comparable to ours (0.50 vs. 0.58 mM P2O5), their low P supply was much
lower than ours (0.004 vs. 0.15 mM P2O5). Therefore, it
is possible that the low P level in this study was not low enough to trigger physiological responses and that mor-phological adjustment is the first line of responses to low P supplies in white birch.
This study has shown some complicated interactions among soil temperature, nutrient supply and ratios of different nutrient elements. For instance, the CO2
soil temperature while it resulted in lower Na at all three soil temperatures. Increasing phosphorus supply in-creased Km but the response of Na showed different
pat-terns at different soil temperatures. These results demon-strate the complicated nature of interactions among nu-trient absorption, allocation, physiological functions and their impact on physiological responses to CO2 elevations
under different nutrient regimes. Interactions among sev-eral factors are much more difficult to study than the main effects of one or two factors and that probably ex-plains the lack of such data in the scientific literature. However, our data show that such interactions in the real world situations can throw the results of studies with simple designs out of context or relevance under certain circumstances. Of course studies involving one or two treatment factors are very important for understanding the mechanisms of their effects. However, the interactive effects of multiple factors are probably more important for making more realistic predictions of plant responses and therefore warrant more attention in future research. Furthermore, interactions involving more than two fac-tors are difficult to visualize and present. There is an ur-gent need to develop new techniques or to adopt tech-niques from other disciplinary areas for analyzing and presenting the results of studies with multiple treatments. Common or standardized expressions of interactive ef-fects should facilitate the comparison of different studies and the utilization of results in further efforts such as modeling and predicting whole plant or ecosystem re-sponses to climate changes.
Acknowledgements
We appreciate the technical support of Joan Lee, the Greenhouse Manager of Lakehead University, during the course of the experiment.
Funding
This research was supported by National Science and Engineering Research Council, Canada Foundation for Innovation and Ontario Innovation Trusts grants to Q.L. Dang and Lakehead University Graduate Assistantship to G. Danyagri.
REFERENCES
[1] A. Rogers, B. U. Fischer, J. Bryant, M. Frehner, H. Blum, C. A. Raines and S. P. Long, “Acclimation of Photosyn-thesis to Elevated CO2 under Low Nitrogen Nutrition Is
Affected by the Capacity for Assimilate Utilization. Pe-rennial Ryegrass under Free-Air CO2 Enrichment,” Plant
Physiology, Vol. 118, No. 2, 1998, pp. 683-689. http://dx.doi.org/10.1104/pp.118.2.683
[2] H. Saxe, D. S. Ellsworth and J. Heath, “Tree and Forest Functioning in an Enriched CO2 Atmosphere,” New
Phy-tologist, Vol. 139, No. 3, 1998, pp. 395-436. http://dx.doi.org/10.1046/j.1469-8137.1998.00221.x
[3] P. A. Davey, A. J. Parsons, L. Atkinson, K. Wadge and S. P. Long, “Does Photosynthetic Acclimation to Elevated CO2 Increase Photosynthetic Nitrogen-Use Efficiency? A
Study of Three Native UK Grassland Species in Open- Top Chambers,” Functional Ecology, Vol. 13, No. S1, 1999, pp. 21-28.
http://dx.doi.org/10.1046/j.1365-2435.1999.00004.x
[4] R. Liozon, F. W. Badeck, B. Genty, S. Meyer and B. Saugier, “Leaf Photosynthetic Characteristics of Beech (Fagus sylvatica) Saplings during Three Years of Expo-sure to Elevated CO2 Concentration,” Tree Physiology,
Vol. 20, No. 4, 2000, pp. 239-247. http://dx.doi.org/10.1093/treephys/20.4.239
[5] S. Zhang and Q.-L. Dang, “Effects of Soil Temperature and Elevated Atmospheric CO2 Concentration on Gas
Exchange, in Vivo Carboxylation and Chlorophyll Fluo-rescence in Jack Pine and White Birch Seedlings,” Tree Physiology, Vol. 25, No. 5, 2005, pp. 523-531.
http://dx.doi.org/10.1093/treephys/25.5.523
[6] S. Zhang and Q.-L. Dang, “Effects of Carbon Dioxide Concentration and Nutrition on Photosynthetic Functions of White Birch Seedlings,” Tree Physiology, Vol. 26, No. 11, 2006, pp. 1457-1467.
http://dx.doi.org/10.1093/treephys/26.11.1457
[7] S. P. Long, E. A. Ainsworth, A. Rogers and D. R. Ort, “Rising Atmospheric Carbon Dioxide: Plants FACE the Future,” Annual Review of Plant Biology, Vol. 55, 2004, pp. 591-628.
http://dx.doi.org/10.1146/annurev.arplant.55.031903.1416 10
[8] B. Cao, Q.-L. Dang and S. Zhang, “Relationship between Photosynthesis and Leaf Nitrogen Concentration in Am-bient and Elevated [CO2] in White Birch Seedlings,” Tree
Physiology, Vol. 27, No. 6, 2007, pp. 891-899. http://dx.doi.org/10.1093/treephys/27.6.891
[9] R. S. Nowak, D. S. Ellsworth and S. D. Smith, “Functional Responses of Plants to Elevated Atmospheric CO2: Do
Photosynthetic and Productivity Data from FACE Expe-riments Support Early Predictions?” New Phytologist, Vol. 162, No. 2, 2004, pp. 253-280.
http://dx.doi.org/10.1111/j.1469-8137.2004.01033.x
[10] S. Li, S. R. Pezeshki and S. Goodwin, “Effects of Soil Moisture Regimes on Photosynthesis and Growth in Cat-tail (Typha latifolia),” Acta Oecologica, Vol. 25, No. 1-2, 2004, pp. 17-22.
http://dx.doi.org/10.1016/j.actao.2003.10.004
[11] K. Y. Crous, M. B. Walters and D. S. Ellsworth, “Ele-vated CO2 Concentration Affects Leaf Photosynthesis-
Nitrogen Relationships in Pinus taeda over Nine Years in FACE,” Tree Physiology, Vol. 28, No. 4, 2008, pp. 607- 614. http://dx.doi.org/10.1093/treephys/28.4.607
[12] C. Plassard and B. Dell, “Phosphorus Nutrition of My-corrhizal Trees,” Tree Physiology, Vol. 30, No. 9, 2010, pp. 1129-1139. http://dx.doi.org/10.1093/treephys/tpq063
[14] M. Chaudhary, J. Adu-Gyamfi, H. Saneoka, N. Nguyen, R. Suwa, S. Kanai, H. El-Shemy, D. Lightfoot and K. Fu-jita, “The Effect of Phosphorus Deficiency on Nutrient Uptake, Nitrogen Fixation and Photosynthetic Rate in Mashbean, Mungbean and Soybean,” Acta Physiologiae Plantarum, Vol. 30, No. 4, 2008, pp. 537-544.
http://dx.doi.org/10.1007/s11738-008-0152-8
[15] A. Brooks, “Effects of Phosphorus Nutrition on Ribulse- 1,5-Bisphosphate Carboxylase Activation, Photosynthetic Quantum Yield and Amounts of Some Calvin Cycle Me-tabolites in Spinach Leaves,” Australian Journal of Plant Physiology, Vol. 13, No. 2, 1986, pp. 221-237.
http://dx.doi.org/10.1071/PP9860221
[16] J. Jacob and D. W. Lawlor, “Dependence of Photosynthe-sis of Sunflower and Maize Leaves on Phosphate Supply, Ribulose-1,5-Bisphosphate Carboxylase/Oxygenase Ac-tivity, and Ribulose-1,5-Bisphosphate Pool Size,” Plant Physiology, Vol. 98, No. 3, 1992, pp. 801-807.
http://dx.doi.org/10.1104/pp.98.3.801
[17] M. Rao and N. Terry, “Leaf Phosphate Status, Photosyn-thesis, and Carbon Partitioning in Sugar Beet. IV. Changes with Time Following Increased Supply of Pho- sphate to Low-Phosphate Plants,” Plant Physiology, Vol. 107, No. 4, 1995, pp. 1313-1321.
[18] Z.-H. Lin, L.-S. Chen, R.-B. Chen, F.-Z. Zhang, H.-X. Jiang and N. Tang, “CO2 Assimilation, Ribulose-1,5-
Bisphosphate Carboxylase/Oxygenase, Carbohydrates and Photosynthetic Electron Transport Probed by the JIP-Test, of Tea Leaves in Response to Phosphorus Supply,” BMC Plant Biology, Vol. 9, 2009, p. 43.
http://dx.doi.org/10.1186/1471-2229-9-43
[19] H. W. Heldt, C. J. Chon and G. H. Lorimer, “Phosphate requirement for the Light Activation of Ribulosc-1.5- Bisphosphate Carboxylase in Intact Spinach Chloroplast,”
FEBS Letters, Vol. 92, No. 2, 1978, pp. 234-240. http://dx.doi.org/10.1016/0014-5793(78)80761-3
[20] R. C. Leegood, D. A. Walker and C. H. Foyer, “Regula-tion of the Benson-Calvin Cycle,” In: N. Barber and R. Barker, Eds., Photosynthetic Mechanisms and the Envi-ronment, Elsevier, Amsterdam, 1985, pp. 189-258.
[21] U. I. Flügge, K. Fischer, A. Gross, W. Sebald, F. Lottspeich and C. Eckerskorn, “The Triose Phosphate-3- Phosphoglyceratephosphate Translocator from Spinach Chloroplasts: Nucleotide Sequence of a Full-Length cDNA Clone and Import of the in Vitro Synthesized Pre-cursor Protein into Chloroplasts,” EMBO Journal, Vol. 8, No. 1, 1989, pp. 39-46.
[22] M. Rao and N. Terry, “Leaf Phosphate Status, Photosyn-thesis and Carbon Partitioning in Sugar Beet. I. Changes in Growth, Gas Exchange and Calvin Cycle Enzymes,”
Plant Physiology, Vol. 90, No. 3, 1989, pp. 814-819. http://dx.doi.org/10.1104/pp.90.3.814
[23] D. T. Tissue and J. D. Lewis, “Photosynthetic Responses of Cottonwood Seedlings Grown in Glacial through Fu-ture Atmospheric [CO2] Vary with Phosphorus Supply,”
Tree Physiology, Vol. 30, No. 11, 2010, pp. 1361-1372. http://dx.doi.org/10.1093/treephys/tpq077
[24] T. A. Day, S. A. Heckathorn and E. H. Delucia, “Limita-tions of Photosynthesis in Pinus taeda (Loblolly Pine) at
Low Soil Temperatures,” Plant Physiology, Vol. 96, No. 4, 1991, pp. 1246-1254.
http://dx.doi.org/10.1104/pp.96.4.1246
[25] H. Lambers, S. F. Chapin III and T. L. Pons, “Plant Phy-siological Eclogy,” Springer, New York, 2008.
http://dx.doi.org/10.1007/978-0-387-78341-3
[26] M. E. Gavito, P. S. Curtis, T. N. Mikkelsen and I. Jakob-sen, “Interactive Effects of Soil Temperature, Atmos-pheric Carbon Dioxide and Soil N on Root Development, Biomass and Nutrient Uptake of Winter Wheat during Vegetative Growth,” Journal of Experimental Botany, Vol. 52, No. 362, 2001, pp. 1913-1923.
http://dx.doi.org/10.1093/jexbot/52.362.1913
[27] T. F. Ambebe and Q.-L. Dang, “Low Moisture Availabil-ity Inhibits the Enhancing Effect of Increased Soil Tem-perature on Net Photosynthesis of White Birch (Betula papyrifera) Seedlings Grown under Ambient and Ele-vated Carbon Dioxide Concentrations,” Tree Physiology, Vol. 29, No. 11, 2009, pp. 1341-1348.
http://dx.doi.org/10.1093/treephys/tpp079
[28] T. F. Ambebe and Q.-L. Dang, “Low Moisture Availabil-ity Reduces the Positive Effect of Increased Soil Temper-ature on Biomass Production of White Birch (Betula pa-pyrifera) Seedlings in Ambient and Elevated Carbon Dioxide Concentration,” Nordic Journal of Botany, Vol. 28, 2010, pp. 104-111.
http://dx.doi.org/10.1111/j.1756-1051.2009.00489.x
[29] T. F. Ambebe, Q.-L. Dang and J. Marfo, “Low Soil Temperature Reduces the Positive Effects of High Nu-trient Supply on the Growth and Biomass of White Birch Seedlings in Ambient and Elevated Carbon Dioxide Concentrations,” Botany, Vol. 87, No. 10, 2009, pp. 905- 912. http://dx.doi.org/10.1139/B09-060
[30] R. O. Teskey, T. M. Hinckley and C. C. Grier, “Effect of Interruption of Flow Path on Stomatal Conductance of
Abies amabilis,” Journal of Experimental Botany, Vol. 34, No. 10, 1983, pp. 1251-1259.
http://dx.doi.org/10.1093/jxb/34.10.1251
[31] P. G. Blackman and W. J. Davies, “Root to Shoot Com-munication in Maize Plants of the Effects of Soil Drying,”
Journal of Experimental Botany, Vol. 36, No. 1, 1985, pp. 39-48. http://dx.doi.org/10.1093/jxb/36.1.39
[32] J. Pastor, R. H. Gardner, V. H. Dale and W. M. Post, “Successional Changes in Nitrogen Availability as a Po-tential Factor Contributing to Spruce Declines in Boreal North America,” Canadian Journal of Forest Research, Vol. 17, No. 11, 1987, pp. 1394-1400.
http://dx.doi.org/10.1139/x87-216
[33] E. H. DeLucia, S. A. Heckathorn and T. A. Day, “Effects of Soil Temperature on Growth, Biomass Allocation and Resource Acquisition of Andropogon gerardii Vitman,”
New Phytologist, Vol. 120, No. 4, 1992, pp. 543-549. http://dx.doi.org/10.1111/j.1469-8137.1992.tb01804.x
[34] D. Paré, Y. Bergeron and C. Camiré, “Changes in the Forest Floor of Canadian Southern Boreal Forest after Disturbance,” Journal of Vegetation Science, Vol. 4, No. 6, 1993, pp. 811-818. http://dx.doi.org/10.2307/3235619
Cedar Seedlings and Stecklings before Planting and dur-ing Field Establishment,” New Forest, Vol. 9, No. 1, 1995, pp. 1-20. http://dx.doi.org/10.1007/BF00028922
[36] T. Domisch, L. Finér and T. Lehto, “Effects of Soil Tem-perature on Biomass and Carbohydrate Allocation in Scots Pine (Pinus sylvestris) Seedlings at the Beginning of the Growing Season,” Tree Physiology, Vol. 21, No. 7, 2001, pp. 465-472.
http://dx.doi.org/10.1093/treephys/21.7.465
[37] P.J. Aphalo, M. Lahti, T. Lehto, T. Repo, A. Rummukai-nen, H. Mannerkoski and L. Finér, “Responses of Silver Birch Saplings to Low Soil Temperature,” Silva Fennica, Vol. 40, No. 3, 2006, pp. 429-442.
[38] G. B. Bonan and H. H. Shugart, “Environmental Factors and Ecological Processes in Boreal Forests,” Annual Re-view of Ecology and Systematics, Vol. 20, 1989, pp. 1-28. http://dx.doi.org/10.1146/annurev.es.20.110189.000245
[39] J. C. Zasada, A. G. Gordon, C. W. Slaughter and L. C. Duchesne, “Ecological Considerations for the Sustainable Management of the North American Boreal Forests,” IIASA Interim Report IR-97-024/July 67, 1997.
[40] R. Z. Man, G. J. Kayahara, Q.-L. Dang and J. A. Rice, “A Case of Severe Frost Damage Prior to Budbreak in Young Conifers in Northeastern Ontario: Consequence of Cli-mate Change?” The Forestry Chronicle, Vol. 85, No. 3, 2009, pp. 453-462.
[41] T. Landis, R. Tinus, S. McDonald and J. Barnett, “The Container Nursery Manuals. Volume 2: Containers and Growing Media,” Agricultural Handbook 674, USDA Forest Service, Washington DC, 1993.
[42] S. Cheng, Q.-L. Dang and T.-B. Cai, “A Soil Tempera-ture Control System for Ecological Research in Green-houses,” Journal of Forest Research, Vol. 5, No. 3, 2000, pp. 205-208. http://dx.doi.org/10.1007/BF02762403
[43] R. M. Burns and B. H. Honkala, “Silvics of North Amer-ica Volume 2, Hardwoods,” Agriculture Handbook 654, USDA Forest Service, Washington DC, 1990, 877p.
[44] D. A. Horneck and R. O. Miller, “Automated Combustion Method with LECO-CNS. Determination of Total Nitro-gen in Plant Tissue,” In: Y. P. Kalra, Ed., Handbook of Reference Methods for Plant Analysis, CRC Press LLC, Boca Raton, 1998, pp. 75-83.
[45] R. C. Munter and R. A. Grande, “Plant Analysis and soil extracts by ICP-atomic emission spectrometry,” In: R. M. Barnes, Ed., Developments in Atomic Plasma Spectro-chemical Analysis, Heyden and Son, Ltd., London, 1981, pp. 653-672.
[46] R. A. Miller, “Nitric-Perchloric Acid Wet Digestion in an Open Vessel,” In: Y. P. Kalra, Ed., Handbook of Refer-ence Methods for Plant Analysis, CRC Press LLC, Boca Raton, 1998, pp. 57-61.
[47] C. R. Hicks and K. V. Turner, “Fundamental Concepts in
the Design of Experiments,” 5th Edition, Oxford Univer-sity Press, New York, 1999.
[48] M. Martin, K. Gavazov, C. Körner, S. Hättenschwiler and C. Rixen, “Reduced Early Growing Season Freezing Re-sistance in Alpine Treeline Plants under Elevated At-mospheric CO2,” Global Change Biology, Vol. 16, No. 3,
2010, pp. 1057-1070.
http://dx.doi.org/10.1111/j.1365-2486.2009.01987.x
[49] D. A. Clark and D. B. Clark, “Life History Diversity of Canopy and Emergent Trees in a Neotropical Rain Forest,”
Ecological Monographs, Vol. 62, No. 3, 1992, pp. 315- 344. http://dx.doi.org/10.2307/2937114
[50] C. D. Canham, “Different Response to Gaps among Shade-Tolerance Tree Species,” Ecology, Vol. 70, No. 3, 1989, pp. 549-550. http://dx.doi.org/10.2307/1940200
[51] T. F. Ambebe, Q.-L. Dang and J. Li, “Low Soil Temper-ature Inhibits the Effect of High Nutrient Supply on Pho-tosynthetic Response to Elevated Carbon Dioxide Con-centration in White Birch Seedlings,” Tree Physiology, Vol. 30, No. 2, 2010, pp. 234-243.
http://dx.doi.org/10.1093/treephys/tpp109
[52] K. Y. Crous, P. B. Reich, M. D. Hunter and D. S. Ellsworth, “Maintenance of Leaf N Controls the Photo-synthetic CO2 Response of Grassland Species Exposed to
9 Years of Free-Air CO2 Enrichment,” Global Change
Biology, Vol. 16, No. 7, 2010, pp. 2076-2088. http://dx.doi.org/10.1111/j.1365-2486.2009.02058.x
[53] H.-M. Ro, P.-G. Kim, I.-B. Lee, M.-S. Yiem and S.-Y. Woo, “Photosynthetic Characteristics and Growth Res-ponses of Dwarf Apple (Malus domestica Borkh. cv. Fuji) Saplings after 3 Years of Exposure to Elevated Atmos-pheric Carbon Dioxide Concentration and Temperature,”
Trees, Vol. 15, No. 4, 2001, pp. 195-203. http://dx.doi.org/10.1007/s004680100099
[54] G. Orlander, P. Gemmel and J. Hunt, “Site Preparation: A Swedish Overview,” Government of Canada, Province of British Columbia, 1990, p. 62.
[55] D. M. Smith, B. C. Larson, M. J. Kelty and P. M. S. Ash-ton, “The Practice of Silviculture: Applied Forest Ecolo-gy,” 9th Edition, John Wiley and Sons, New York, 1997.
[56] A. Sellin and P. Kupper, “Effects of Light Availability versus Hydraulic Constraints on Stomatal Responses within a Crown of Silver Birch,” Oecologia, Vol. 142, No. 3, 2005, pp. 388-397.
http://dx.doi.org/10.1007/s00442-004-1748-3
[57] T. F. Ambebe, G. Danyagri and Q.-L. Dang, “Low Soil Temperature Inhibits the Stimulatory Effect of Elevated [CO2] on Height and Biomass Accumulation of White
Birch Seedlings Grown under Three Non-Limiting Phos-phorus Conditions,” Nordic Journal of Botany, Vol. 31, No. 2, 2013, pp. 239-246.
![Table 2. Probabilities from ANOVA for the effects of T(Ksoil, P supply and [CO2] on mass-based leaf potassium concentration m), area-based leaf potassium concentration (Ka), mass-based leaf phosphorus concentration (Pm), area-based leaf phos-phorus concent](https://thumb-us.123doks.com/thumbv2/123dok_us/7985827.758005/7.595.57.542.143.297/probabilities-potassium-concentration-potassium-concentration-phosphorus-concentration-concent.webp)
