Automatic Segmentation of Retinal Vasculature
Detection of Diabetic Retinopathy for Early using SVM
Sayyada Sara Banu
College of ComputerScience and Information System,
Jazan University, Saudi Arabia
Mohammed Waseem
Ashfaque
Department of Computer Science and IT, College of Management and
Computer Technology Aurangabad, India
Perumal Uma
College of ComputerScience and Information System,
Jazan University, SaudiArabia.
ABSTRACT
Detection of Micro aneurysm at an early stage is the first step in preventing Diabetic Retinopathy, Diabetic retinopathy (DR) is the most common cause of blindness. The visual impairment can be avoided by detecting DR. Segmentation of retinal structures help in the diagnosis of DR. In this work, anatomical structures such as blood vessels, exudates and micro aneurysms in retinal images are segmented and the images are classified as normal or DR images by extracting features from these structures and the Gray Level Co-occurrence Matrix (GLCM). These extracted of candidates is the problem domain for the Support Vector Machine classifier. The Support Vector Machine classifier classifies the images to correctly determine the findings of candidate extraction to be microaneursym or not. The simulations of the algorithms are done and the results are shown.The classifier used is Support Vector Machine (SVM) which gives an average accuracy of 96%.
Keywords
Retinal images; Diabetic Retinopathy, Support Vector Machine.
1.
INTRODUCTION
Diabetic Retinopathy (DR) is a sight-threatening risk inflicting diabetic patients. It occurs due to damage in the retina as a result of diabetes mellitus. Early diagnosis and treatment has been shown to prevent visual loss and blindness. Retinal images obtained by the fundus camera are used to diagnose DR. Automated methods of DR screening help to save time, cost and vision of patients, compared to the manual methods of diagnosis.Retinal image classification has been done by various methods. VijayaKumari et al used MDD classifiers for classifying retinal images where propagation through radii method is used for feature extraction [1]. Zohra et al performed a computer based approach for the detection of diabetic retinopathy stage using SVM where the features are extracted from the raw images using image processing techniques [2]. Retinal Grading Algorithm was used by Singh et al [3] to automatically classify the DR intensity based on distribution of exudates, count, size and the distribution of the hemorrhages and micro aneurysms. Classification using fractal measures and clustering techniques was done by Jebarani et al [4]. Multiple classifiers were used by Jonathan et al [5] for the classification of retinal images.In this work, segmentation is done on retinal images to separate the blood vessels, exudates and micro aneurysms (MA) since these are the best indicators of the presence of DR. The features given to the classifier include the areas of these segmented structures and textural features obtained from GLCM. The SVM classifier classifies the input image as normal (not affected by DR) or DR images based on the training done by giving the sample features.
2.
PROPOSED METHODOLOGY
The framework for the proposed methodology is given in Figure 1. The input retinal images undergo segmentation to detect blood vessels, exudates and micro aneurysms separately. Texture analysis using GLCM is done simultaneously. Then features such as area of blood vessels, area of exudates, area of MA, energy, entropy, contrast and homogeneity are extracted and fed to SVM which classifies the images as normal or abnormal based on the presence of DR.
Figure1 Proposed Methodology
2.1
Databases
25 the 50 degree Field-Of-View digital fundus camera with
varying imaging settings. The data correspond to a good practical situation where the images are comparable and can be used to evaluate the general performance of diagnostic methods. This data set is referred to as "calibration level 1 fundus images". The MESSIDOR database [8] consists of 1200 images captured using a color video 3CCD camera on a Topcon TRC NW6 non-mydriaticretinograph with a 45 degree field of view. The images were captured using 8 bits per color plane at 1440 x 960, 2240 x 1488 or 2304 x 1536 pixels. Two diagnoses have been provided in this database by the medical experts for each image such as retinopathy grade and risk of macular edema.
2.2
Segmentation of Retinal Structures
Detection of Blood Vessels:
The segmentation of retinal blood vessels is done by the method proposed by Selvathi et al [9]. Since curvelet transform can efficiently represent edges along curves, it is used for enhancing the retinal images. For this, discrete curvelet transform of the green channel image is taken and the curvelet coefficients are modified by a nonlinear equation. Feature used for classification is the pixel intensity. The feature vector of a pixel consists of the intensity of its eight-connected neighbors. The extracted features are given to the SVM for classification based segmentation. Feature vectors of 1000 vessel pixels and 1000 non vessel pixels from an image and its corresponding ground truth image are used for training.
Detection of Exudates and Microaneurysms: Morphological operators are used for the detection of exudates and MA in this work. The morphological operators extract relevant structures of the image by probing the image with another set of known shape called structuring element (SE).The shape of the SE is usually chosen according to some a priori knowledge about the geometry of the relevant and irrelevant image structures [10]. The common morphological operations are erosion, dilation, opening and closing. Erosion computes the minimum of each pixel's neighborhood and is given by
z EBi A
A
Where A is a binary image, B is a structuring element and E is the Euclidean space.
Dilation computes the maximum of each pixel’s neighborhood and is given by
z E Bi xA A
A ( )
Opening involves single erosion followed by a single dilation by the same operator.
A
Closing involves a single dilation followed by a single erosion by the same operator.
A
The steps for the detection of exudates using morphological operators are given as follows. Green channel of the retinal image is extracted from the colored image. First median filtering is applied to the green image. Then morphological reconstruction is done to obtain the background image, which is subtracted from the original image. This is followed by applying Kirsch’s edges [11]. Kirsch’s edges helps to capture the edges of the exudates. This edge detector is based on the
kernel k evaluated at 8 different directions on the image. The kernel is given by
15 3 15
3 15
5
15 3 0 15
5
15 3 15
3 15
5
The kernel outputs are combined together by selecting the maximum value found on each pixel output. Next step is to remove all the connected components form the binary image that has fewer than P pixels so that the resultant binary image will contain only optic disc, where P was chosen such that it is smaller than the maximum size of optic disc. The optic disc occupies nearly 80 x 80 pixels. The resulting image that contains only the optic disc is subtracted from the threshold image so that it delivers an image that contains only exudates.Micro aneurysms are also detected using morphological operators in this work.The first step is adaptive histogram equalization for image enhancement. Closing operator is applied to eliminate the details. Then filling operation is done to fill the holes in the vessels. Then the difference between the closed image and the filled image is found.
F fill
f closediff
f
This difference image is binarized by thresholding. Then extended-minima transform is applied to this binary image [12]. The extended-minima transform is the regional minima of h-minima transform. This is a thresholding technique that brings most of the valleys to zero. The h-minima transform suppresses all the minima in the intensity image whose depth is less than or equal to a predefined threshold. In the output binary image (fE), the white pixels represent the regional minima in the original image. Regional minima are connected pixels with the same intensity value, whose external boundary pixels all have a higher value. Finally the vessels and exudates are removed to separate out the MAs.
ex F V f E f MA
f
2.3
Texture Analysis
1 1 1 , 1 0 , 1 1 , 1 1 , 0 0 , 1 1 , 0 1 , 0 0 , 0 , N N p N p N p n p p p n p p p d p Wherersconsider
umberofpai
tota
j
i
ensity
ith
xelspairsw
numberofpi
P
i jln
)
,
(
int
,
pijis defined as the relative number of times gray level pair (i,j) occurs when pixels separated by the distance d along the angle ᶿ
are compared. Each element is normalized by the total number of occurrences to form the GLCM P.The commonly extracted textural features from GLCM are contrast, homogeneity, correlation and energy.
2.4
Feature Extraction
The feature vector used for classification consists of seven features obtained from segmentation of retinal structures and texture analysis. These features are the area of blood vessels, area of exudates, area of MA, contrast, homogeneity, correlation and energy.Area of blood vessels is determined by finding the total number of white (vessel) pixels in the vessel-segmented image. Similarly area of exudates and area of MA are determined by finding the number of white pixels in the exudates image and MA image respectively.Contrast is a measure of the intensity contrast between a pixel and its neighbor over the whole image, and is given by
ijN j N
i
i
j
P
contrast
01 21
0
Where are the elements of the GLCM. Homogeneity measures the closeness of the distribution of elements in the GLCM to the GLCM diagonal and can be mathematically written as
i
j
p
Homegenity
Ni Nj ij
1
1 0 1 0Correlation calculates the linear dependency of the gray level values in the co-occurrence matrix. It is represented mathematically as
j i ij j ij N j N ip
j
i
n
correlatio
011 0
whereμi, μj, σiandσjare the means and standard deviations of Pi and Pj. Energy is the sum of squared elements in the co-occurrence matrix. 2 1 0 1 0 ij N j N i
p
Energy
2.5
Classification
In this work, classification based on the extracted features is done by using SVM classifier [14]. For training, fifty images (25 normal and 25 DR images) along with their corresponding ground truths are used. For testing, a set of one hundred and fifty images (75 normal images and 75 DR images) are taken and their features are calculated. Then these features are used by the SVM for classifying the images into Normal and DR images.
3.
RESULTS AND DISCUSSION
The results for each step explained in the proposed method are discussed in this section. The blood vessel segmentation results for sample images of the DRIVE database are shown in Fig. 2 and Fig. 3.
Figure2 Detection of blood vessels (a) Original image (b) Green channel image (c) Enhanced image (d) Segmented
image (e) Ground truth image.
Figure3 Detection of blood vessels (a) Original image (b) Green channel image (c) Enhanced image (d) Segmented
image (e) Ground truth image.
The results for exudates segmentation for sample images of the DIARETDB1 database are given in Fig. 4 and Fig. 5.
Figure4 Detection of exudates (a) Original image (b) Median filtering (c) Background image (d) Exudates and
27 Figure 5 Detection of exudates (a) Original image (b)
Median filtering (c) Background image (d) Exudates and optic disk (e) Exudates image.
a b
[image:4.595.314.535.70.251.2]c d
Figure 6Pre-processed image (a) Input image (b)RGB to Gray (c) CLAHE (d) Shade corrected image Fig 7(a) is the
complemented shade corrected image.
The micro aneurysms segmentation results for sample images of DIARETDB1 and MESSIDOR databases are shown in Figure 6.1 and Fig. 7.
Figure 6.1 Segmentation of Microaneurysms (a) Original image (b) Adaptive histogram Equalization (c) Closing (d)
[image:4.595.95.246.250.417.2]Filling (e) Difference image (f) Binarized image (g) Extended minima transform (h) Microaneurysm image.
Figure 7 Segmentation of Microaneurysms (a) Original image (b) Adaptive histogram Equalization (c) Closing (d)
Filling (e) Difference image (f) Binarized image (g) Extended minima transform (h) Microaneurysm image.
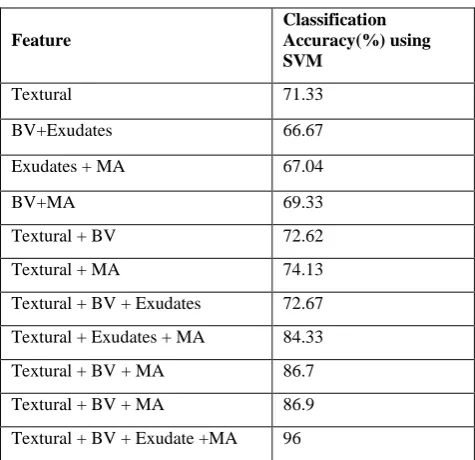
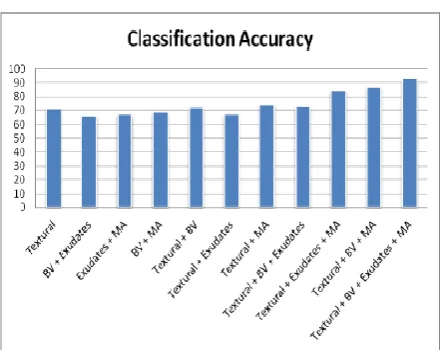
From the segmented images of these retinal structures, the area of blood vessels, exudates and MA are calculated by finding the total number of blood vessels, exudates and MA respectively. The textural features such as contrast, homogeneity, correlation and energy are also calculated from the GLCM. All these 7 features together form a feature vector of an image. The features of 25 normal images and 25 DR images are given for training the SVM classifier. For testing, the features extracted from 75 normal images and 75 DR images are fed to the SVM. The analysis is done with different combinations of features as input to the classifier. The comparison of classification performance using different combinations of features is given in Table 1 and its graphical representation is shown in Fig. 8.
Table: 1 Classification Results For Different Combinations Of Features.
Feature
Classification Accuracy(%) using SVM
Textural 71.33
BV+Exudates 66.67
Exudates + MA 67.04
BV+MA 69.33
Textural + BV 72.62
Textural + MA 74.13
Textural + BV + Exudates 72.67
Textural + Exudates + MA 84.33
Textural + BV + MA 86.7
Textural + BV + MA 86.9
[image:4.595.304.542.472.702.2] [image:4.595.60.281.495.671.2]Fig. 8 Classification results for different combinations of features
From Fig. 8, it is observed that classification using all the seven features including the textural features, areas of blood vessels, exudates and MA by the SVM classifier yields the highest classification accuracy compared to all other combinations of features.
The details about the classification results with all the features are tabulated in Table 2.
TableI:2 Classification Results Using All Seven Features
Classes
No. of Training Images
No. of Testing Images
No. of Correctly Classified Images
Classifica tion Accuracy
(%)
Normal 25 75 70 95
DR 25 75 72 97
Average Accuracy 96
From Table 2, it is observed that 95% classification accuracy has been obtained for normal images whereas the DR images gave an accuracy of 97%, giving 96% average accuracy. Thus the abnormality detection is done with higher accuracy.
4.
CONCLUSION
In this paper the proposed work of Support Vector Machine (SVM) classifier is the trained process through supervised learning method for the features extraction to classify on the basis of retinal images. In this work the retinal images are used to obtained and carrying from which are available the publicly through DRIVE, DIARETDB1 and MESSIDOR databases or data sets. We proposed two modules under this work one is for performing the image segmentation which consist the vessels segmentation phenomenon and exudates and MA and other like to performing classification using Support Vector Machine (SVM). The overall accuracy according to observations is being found up to the 96% and hence the developed system will provide a second opinion to the ophthalmologist to go through the diagnosis which should be on accuracy based.
5.
REFERENCES
[1] VijayaKumari V, SuriyaNarayanan N (2010) Diabetic Retinopathy-Early Detection Using Image Processing Techniques. International Journal on Computer Science and Engineering 2(2): 357-361.
[2] Berrichi Fatima Zohra, Benyettou Mohamed (2009) Automated diagnosis of retinal images using the Support Vector Machine (SVM). Faculte des Science. Department of Informatique, USTO, Algerie.
[3] Neera Singh, Ramesh Chandra Tripathi (2010) Automated Early Detection of Diabetic Retinopathy Using Image Analysis Techniques. International Journal of Computer Applications 8(2): 18-23.
[4] JebaraniSargunar PN, Sukanesh R (2009) Exudates Detection and Classification in Diabetic Retinopathy Images by Texture Segmentation Methods. International Journal of Recent Trends in Engineering 2(4): 148-150. [5] Jonathan Goh, Lilian Tang, George Saleh, Lutfiah Al turk,
Yu Fu, Antony Browne (2009) Filtering Normal Retinal Images for Diabetic Retinopathy Screening Using Multiple Classifiers. International Conference on Information Technology and Applications in Biomedicine 1-4.
[6] DRIVE Database,: http://
www.isi.uu.nl/Research/Database/DRIVE
[7] DIARETDB1 Database,
http://www2.it.lut.fi/project/imageret/diaretdb1/
[8] MESSIDOR Database,
http://messidor.crihan.fr/download.php
[9] Selvathi D, NeethiBalagopal (2012) Detection of Retinal Blood Vessels using Curvelet Transform. IEEE International Conference on devices, Circuits and Systems 325-329. doi: 10.1109/ICDCSyst.2012.6188730
[10]Pierre Soille (2002) Morphological Image Analysis, Principles and Applications. 2nd Edition. Springer. [11]Giancardo L, Meriaudeau F, Karnowskiy TP, Liz Y, Tobin
Jr. KW, E Chaum, MD (2011) Automatic Retina Exudates Segmentation Without a Manually Labelled Training Set. IEEE International Conference on Biomedical Imaging 1396-1400. doi: 10.1109/ISBI.2011.5872661
[12]Purwita AA, Adityowibowo K, Dameitry A, Atman MWS (2011) Automated Microaneurysm Detection Using Mathematical Morphology. IEEE International Conference on Instrumentation, Communication, Information Technology and Biomedical Engineering 117:120. doi: 10.1109/ICICI-BME.2011.6108606
[13]Robert M Haralick, K Shanmugam, Its'hakDinstein (1973) Textural Features for Image Classification. IEEE Transactions on Systems, Man, and Cybernetics 3(6): 610– 621.
[14]Vojislav Kecman (2001) Learning and Soft Computing, Support Vector Machines, Neural Networks and Fuzzy Logic Models. The MIT Press.
[15]KayteJaypalsing N. et al.Left Ventricle statistical models segmentation of shape and appearance for Analysis of cardiac MRI(IJCA) 2014.