http://dx.doi.org/10.4236/jgis.2016.82013
Spatiotemporal Analysis of Urban Sprawl
and Its Contributions to Climate and
Environment of Peshawar Using Remote
Sensing and GIS Techniques
Rashid Mehmood1, Syed Amer Mehmood1, Muhammad Atif Butt1, Imtiyaz Younas2,
Muhammad Adrees2
1Department of Space Sciences, University of the Punjab, Lahore, Pakistan
2Punjab University College of Information Technology, University of the Punjab, Lahore, Pakistan
Received 6 February 2016; accepted 20 March 2016; published 23 March 2016
Copyright © 2016 by authors and Scientific Research Publishing Inc.
This work is licensed under the Creative Commons Attribution International License (CC BY). http://creativecommons.org/licenses/by/4.0/
Abstract
This research study predominantly emphases on spatiotemporal extensions of urban area of Pe-shawar; its adverse impacts and contributions to climate and environment during 1931 to 2011. To probe these interventions, meteorological data, Satellite’s temporal imagery of Landsat ETM+ and TM, anthropogenic and demographic secondary data were congregated. In relation to map out land cover changes, maximum likelihood classification algorithm and followed by change detec-tion techniques were applied to study area. The outcome of this process was further subjected through Geographic Information System (GIS) overlay analysis which suggested a clear straggle in urban area. Auxiliary data (Population growth rate, transportation, electricity connections, etc.) also support the fact of urban area extension. This study proposes that severs contributions of massive heat energy and CO2 have been added to local climate and environment ensuing
substan-tial increment in temperature drawn out from the trends. Consequently, Remote Sensing, GIS and allied data were found to be effective to gauge such variations. To eliminate anomalies in sprawl and environment, few suggestions and recommendation are made in latter part of this study.
Keywords
1. Introduction
Urbanization have represented by fraction of population lived in urban circles of any country later on replaced with settlement, which comprises over 5000 persons or more, overlaid with specific criteria includes civic ser-vices, socioeconomic base and access of basic infrastructure in Pakistan’s point a view. The growth rate of urban areas is usually on the higher side than countryside characterized by migration and lack of rural facilities and in-crease in population [1].
Peshawar secured first rank in major cities of Khyber Pakhtunkhwa (KPK) in terms of population. More spe-cifically in 1961, Peshawar carried about 29% of total urban population of KPK, and hence was representative of the prime city. Similar calculation was made in 1998 and found 33% share of total urban population (Census Report of 1961 and 1998). This considerable increment in population witnessed the addition of migrants from Afghanistan where living conditions were not friendly owing to war fought among the local militants groups. Peshawar, sharing the common social and cultural values, situated closer to border of Afghanistan proved to be the best option to live without any discrimination. Therefore, it is more vulnerable to urban sprawl than any else. This situation can be lethal and challenge the efforts being made to provision of quality foods, health facilities, housing, education and adequate infrastructure to common people. Urban sprawl can also cast its adverse out-comes on environment and climate as it leads to poor sanitation, industrial connections, over emission of CO2 and other toxic greenhouse gases (GHG) to air. Transport sector regarding gaseous exhaust is the main contri-buting source of GHGs and as a result climate change occurs. Such releases of GHGs are lead to an enormous increment of carbon dioxide (CO2) to air, ensuing in rise in average world temperatures about 1.4 - 5.8 degree Celsius [2].
This research study discovers the connection among urban extension, environment, transportation and its ad-verse effects on denizen of Peshawar’s health. The techniques involved to monitor sprawl, are change detection from Remote Sensing data and after that applying GIS tools which examine its capabilities in order to study spa-tial extensions of land cover. This research also displays how satellite imagery can be taken into account to ma-nipulate and analyzed using digital techniques in popular image processing software programs ER Mapper 7.1, ERDAS 9.1 and GIS software ARC GIS 10. To measure its hostile impacts casted over the years, a few physical indicators like temperature and anthropogenic data have been employed.
2. Literature Review
Owing to the immense migration from rural to urban, the swift growth has shaped several issues including crowding and land use disputes for the residents and for the urban planning and managing entities. Along with all these issues, few connecting outcomes are cut short of agricultural area, unplanned housing areas, costly ara-ble land, and developer’s assumptions about land cost, adulteration of public atmosphere [3].
In recent studies figures have revealed the fact of worldwide rapid growth. Likewise human made several landuse and land cover alterations, urbanization depiction and indicates improved socio-economic, demographic figures, environmental situations, affected by exception migration of population towards cities and urban site [4]. As technology evolved over the year, Remote Sensing (RS) and GIS techniques have offered multiple options to deal spatial features for monitoring, assessment and map out sprawl pattern. Urban planners and geographer have drawn fruitful information out of it for the measurement of future sprawl direction as well as magnitude precisely rather than using typical approaches [5]. Despite the materialistic degradation, human health also mat-ters seriously in current industrial boom age along with excessive emission of soot to air.
Health disorder results from these are illness and death by heat over stress, severe weather outcomes, vector- borne and rodent-borne diseases, and water borne and food connected effects. Local meteorology is always badly affected by air pollution, may also be intensified by climate change, with background ambient level of O3 expected to upsurge by up to 40 ppb in major North American cities [6].
3. Aims and Objectives
Key aims behind this study are to monitor urban sprawl over last few decades and built a relationship among the environmental degradation and climate change. Moreover to point out its peripheral influences, which have been cruised into natural ecosystem as adulteration, is also a part of it.
1) To analyze the urban sprawl on Peshawar and its outskirts over the last couple of decades. 2) To find relation among the urban growth, its climate and environment degrading factors.
3) To propose solutions to eliminate the possibilities of irregular city expansion and environment humiliating elements.
4. Study Area
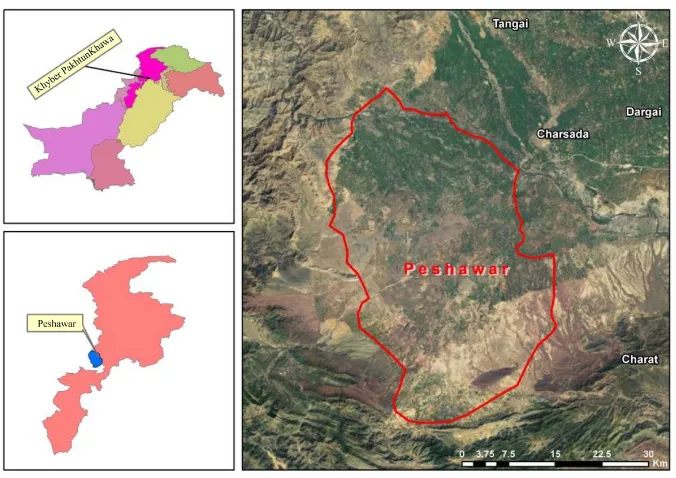
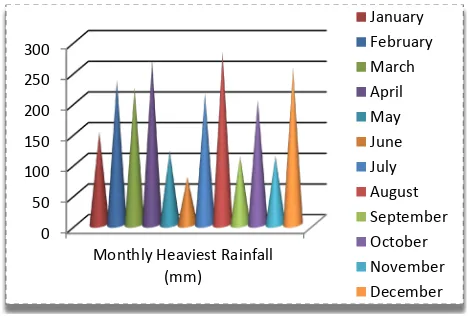
Peshawar is largest and the capital city of the Khyber Pakhtunkhwa and is also the city of carrying multicultural denizen of the Province. It has beautiful historical, economic, political and military importance for province. To the west, The Federally Administered Tribal Areas (FATA) shares the boundary and Mohmand Agency located at its North. Similarly, Kohat district is at its Southern side. Charsadda and Nowshera link towards its North and North-East respectively. Moreover, Afghan boundary is just 40 Km away from west of the city. Peshawar lo-cates in between 44˚15' and 34˚15' North Latitude; 71˚22' and 71˚42' East Longitude. It is spatially extended to 1257 square kilometer. Winter begins from middle of November till to March while summer prevails in month of May and lasts till September. The average maximum temperature in summer often goes beyond forty (40) degree and the average minimum approaches to 25˚C. The average minimum and average maximum tempera-ture swings between 4˚C and 18.35˚C. Spring marks its beginning in the middle of March appears pleasant span of the year. Peshawar receives rainfall both in summer and winter. Western disturbances brings about sever winter rainfall especially in months of February and April. March and August have witnessed highest winter and summer precipitation respectively. Comparatively, average winter rainfall is on higher side than summer rainfall. In Peshawar, wind speed swings around 5 knots in December to 24 knots in hot June. In same way, the relative humidity fluctuates from 46% in June to 76% in August respectively [7] (Figure 1).
5. Population and Density
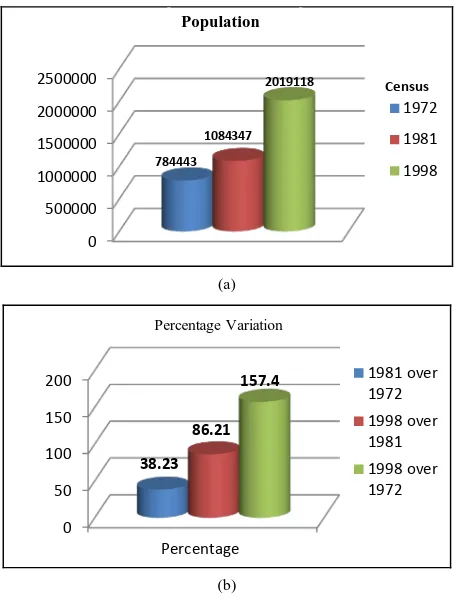
[image:3.595.144.482.465.704.2]According to 1998 census report of Peshawar tells that the total population is 2.019 million, in which male are 1,061,000 and female are 95,800 occupying the 11.38% of KPK’s total population. About 46.62% population of Peshawar are migrated from Afghanistan and other parts of KPK and Pakistan. Moreover, round about 46% of total population in Peshawar is of age less than 15 years. Since 1951 A.D., population has enhanced 5 times till today. It has been seen that about 416.37% increment in total figure observed at 1951 A.D. During the span of time between 1981 A.D. and 1998 A.D., a considerable growth in population has been observed and is around 81.40% at an average annual growth rate of 3.56 persons. During 1972 A.D. to 1981 A.D. a period of 8.46 years,
these figures are 37.92% and 3.89 persons respectively. During the span of 1951 A.D. to 1972 A.D. (21 years) the rise was 52.55% and growth rate 3.70 persons were calculated [7].
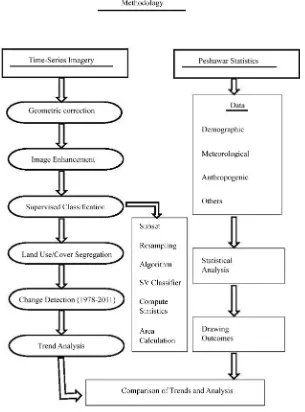
6. Material and Methodology
To meet the aims and objectives of study, secondary data from various sources to draw out results and appropri-ate method to set a work flow is espoused in the following Figure 2.
6.1. Material
Time series imagery from Landsat Multispectral Scanner (MSS) dated October 10, 1978 and Thematic Mapper (TM) dated September 27, 1992 and October 02, 2011 have been employed as Remote Sensing source of data capturing. To support result figures from demographic and anthropogenic data have also been incorporated as secondary data from authenticated sources of concerned department.
6.2. Methodology
[image:4.595.163.468.296.708.2]In following subsections, methodology is elaborated:
6.2.1. Time-Series Imagery
Technique to measure urban spatial growth includes time-series Satellite Remote Sensing (SRS) data, was found to be a best practice. Landsat temporal images from geo-spatial data offering websites of US Geological Survey (USGS) was acquired. Initial process involved to scrutinize the quality of data received through multiple pre- selected standards like to eradicate geometric errors, cloud cover etc.
To extract maximum land cover/land use classes, image enhancement techniques were applied for better visu-al interpretation. After making visu-all these preliminary measures, imagery was set to subject under supervised clas-sification process. Ultimate purpose of the clasclas-sification of the imagery is to assign each pixel to its respective category as on ground representing theme in final output [8].
These classes/themes were later on assigned respective categories based on visual interpretation made before applying classifier algorithm to dataset. To measure the difference in spatial distribution of urban area, post- classification and cross-tabulation techniques were implemented. To detect spatial changes, post classification is an authentic technique which demands comparison of two or more independent classified image to draw out re-sults. Hence this technique lessens the possible errors produced internally and externally. “Cross-tabulation analysis was carried out to study the spatial distribution and area of urban sprawl on different soil types” [9]. This analysis had clearly shown the trends and future prospects for predicting sprawl locations and directions.
6.2.2. Peshawar Statistics
Statistical figures pertaining to Peshawar city and its outskirts comprised over meteorological facts and figures, anthropogenic, demographic etc. It gave insight the fact that these factors had being linked with urban activities. To draw out result and trends, graphs from existed data were prepared.
7. Results and Discussion
The statistical study depicts clearly that pattern through which Peshawar receives heavy rainfall is not linear dis-tribution over the months.
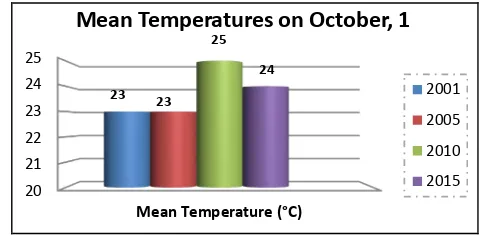
Figure 3shows the mean monthly temperature of Peshawar district from 1931 to 2012.Figure 4 expounds maximum temperatures in the month of October that have been observed in the years of 2001, 2005, 2010, and 2015. In the data, the temperature was raised to 31˚C in 2010 of Peshawar which clearly suggests irregularity in local climate. Figure 5 exhibits minimum temperature observed in the same span of time which displays a drop of day time temperature by 1˚C in 2005 and 2015.
Figure 6 shows the mean temperatures in 2001, 2005, 2010, and 2015 in October, 1. It concludes that the temperature rises in 2010.
Figure 7(a) suggests a considerable growth in population between intercensal periods due huge migration observed from Afghanistan. Figure 7(b)shows a percentage difference which exhibits more clear idea about this activity.
Figure 8 marks the beginning of industrial growth in Peshawar and its outskirt owing to meet the needs of denizen and migrants. This would also be a key source in polluting upper environment of Peshawar district and its neighbors. Increasing number in unit may enhance exhaust of CO, CO2 and SO2 to air and ultimately disturb
Figure 3. Peshawar (during 1931-2012). Source: www.pmd.gov.pk.
0 50 100 150 200 250 300
[image:5.595.196.430.547.705.2]Figure 4. Maximum temperature in the month of October, 1.
Figure 5. Minimum temperature in the month of October, 1. Source:
http://www.wunderground.com.
Figure 6. Mean temperatures on October, 1 in different years. Source: http://www.wunderground.com.
natural ecosystem.
Table 1 shows the different pollutants found in the air of Peshawar.
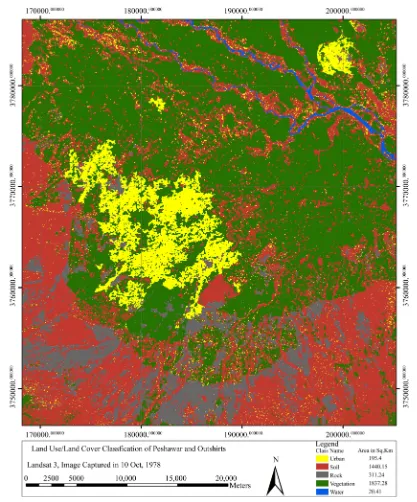
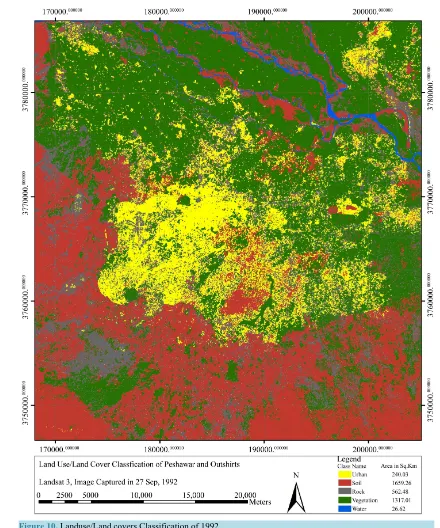
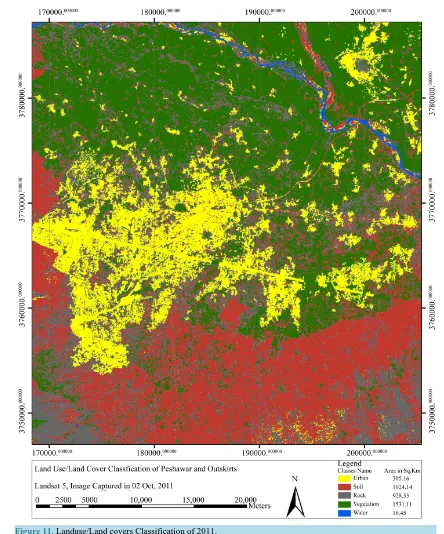
The Remote Sensing and GIS application appears to be an alternative for urban sprawl mapping and monitor-ing effectively [10]. That is why, time series imagery of Peshawar was acquired and classified into various lan-duse classes including built up land, vegetation, soil, rock and water. It is clearly seen that, huge sprawl in term of aerial shown in different themes is observed by segregation and calculation of areas of these classes. Area covered under built up in 1978 is 195.4 Sq. Km (Figure 9). In Figure 10, area expansion has been shown after 1992. It is extended up to 305.16 Sq. Km in 2011(Figure 11). To find changed area, change detection map has been drawn in Figure 12. These figure points out that about 56% urban area extensions in the span of 1978-2011 were witnessed which is certainly an alarming number for any city of the world. Hence, it supports the census figure and goes side by side which reveals rapid urban growth in Peshawar and its outskirts.
7.1. Urban Sprawl and Environment Linkage
Urban growth corresponds not only to demographic figures but also refers to several associated factors like con-struction activities, transportation, sewage system, deforestation, water supply and industrial activities. These factors are linked with urban extension and environment directly or indirectly.
As new housing colonies, residential societies and industries are constructed, its focus always has been to-
20 25 30 35 Max Temperatures(°C) 28 28 31 30
Max Temperatures on October, 1
2001 2005 2010 2015 17 18 19
Min Temperature (°C)
19
18 19
18
Min Temperatures on October, 1
2001 2005 2010 2015 20 21 22 23 24 25
Mean Temperature (°C)
23 23
25 24
Mean Temperatures on October, 1
[image:6.595.190.435.359.479.2](a)
[image:7.595.199.430.82.382.2](b)
[image:7.595.196.434.428.553.2]Figure 7. (a) Population data; (b) Population percentage variation. Source: 1998 district census report and 1972 & 1981 population of administrative unit, government of Pakistan.
Figure 8. Industrial growth in recent past. Source: directorate of in-dustries, commerce & labour, KPK, peshawar.
Table 1.Concentration of Pollutant air in ug/m3.
Location Met. Pollutant Avg. Max. Min.
Peshawar
Sun/Overcast NW 4 - 6 m/s Temp 23 - 26 C
SO2 CO O3 NO NO2 NOx dust 1 834 30 19 53 80 1290 72 9280 130 235 363 401 1890 0 0 12 0 0 17 789
Source: EPA, Peshawar (1993).
0 500000 1000000 1500000 2000000 2500000 784443 1084347 2019118 1972 1981 1998 Population Census 0 50 100 150 200 Percentage 38.23 86.21
157.4 1981 over
1972 1998 over 1981 1998 over 1972 Percentage Variation 479 488 550 440 460 480 500 520 540 560
2005-06 2006-07 2007-08
Number of Registered Industrial Units
[image:7.595.85.538.604.708.2]Figure 9.Landuse/land covers classification of 1978.
wards the vegetated/open area associated to outer extent of the city. It straight away gives rise to deforestation and conversion of cultivated area into commercial area. This would affect not only local environment badly but also destroy ecosystem as well. Transportation activities are also enhanced as human mobilization is necessary part of life to get livelihood. It eventually intensifies vehicular exhaust to air which pollutes and degrades its quality. Addition of plenty of toxic gas to environment results sudden variation in climate which can be seen from above results.
7.2. Suggestions
Figure 10.Landuse/Land covers Classification of 1992.
1) Migration must be controlled through strict policies and measures.
2) Under a strict land use rules and master plans new housing colonies and scheme should be permitted and regulated under competitive authorities.
3) Industrial area should be far away from the residential area and it should include small, medium and large industries at same time.
4) Adequate provision of basic necessities and jobs at door steps to people belong to remote areas should be made possible.
Figure 11.Landuse/Land covers Classification of 2011.
6) Alternative eco-friendly energy source for transport and household use should be identified. 7) Exhaust from industries must be gauged and lessened gradually.
8) Coordination among the stakeholders must improve.
8. Conclusion
Figure 12.Change detection map.
taking place using Remote Sensing and GIS techniques. Prediction from these figure and geospatial extension of urban area has given insight that Peshawar’s western side is highly vulnerable for future concerns. This paper has also sorted out darker side of this wild expansion like environmental degradation and climate change. It has also explored the issues associated with urban and proved how they are interlinked. From these catastrophic outcomes, a number of policy making points and suggestion are made which has helped in making the research fruitful.
Acknowledgements
This is partly sponsored by urban unit, P&D Department Govt. of the Punjab. Sir Muhammad Atif butt GIS de-velopment specialist and in space science department, assisted me technically and financially in this study.
References
233-242.
[2] Houghton, J.T., Ding, Y., Griggs, D.J., Noguer, M., van der Linden, P. J., Xiaosu D., Maskell, K. and Johnson, C.A. (2010) Climate Change 2001: The Scientific Basis. Contribution of Working Group I to the Third Assessment Report of the Intergovernmental Panel on Climate Change. Cambridge University Press, Cambridge, 866 p.
http://www.grida.no/climate/ipcc_tar/wg1/
[3] Maktav, D. and Erber, F.S. (2005) Analysis of Urban Growth Using Multi-Temporal Satellite Data in Istanbul. Turkey International Journal of Remote Sensing, 26, 797-810.http://dx.doi.org/10.1080/01431160512331316784
[4] Masek, J.G., Lindsay, F.E. and Goward, S.N. (2000) Dynamics of Urban Growth in the Washington DC Metropolitan Area, 1973-1996, from Landsat Observations. International Journal of Remote Sensing, 21, 3473-3486.
http://dx.doi.org/10.1080/014311600750037507
[5] Okabe, A. (2006) GIS-Based Studies in the Humanities and Social Sciences. CRC Press, Taylor & Francis, Boca Raton, London.
[6] Intergovernmental Panel on Climate Change (2001) “Question 8”, Climate Change 2001: Synthesis Report. A Contri-bution of Working Groups I, II and III to the Third Assessment Report of Intergovernmental Panel on Climate Change. In: Watson, R.T. and the Core Writing Team, Eds., Cambridge University Press, Cambridge, 123-134.
http://www.grida.no/climate/ipcc_tar/vol4/english/060.htm
[7] District Census Report, Peshawar (1998) Department of Statistics. Khyber Pakhtoon Khawa.
[8] Lillesand, T.M. and Kiefer, R.W. (1994) Remote Sensing and Image Interpretation. 4th Edition, John Wiley and Sons, New York.
[9] Shalaby, A. and Gad, A. (2010) Urban Sprawl Impact Assessment on the Fertile Agricultural Land of Egypt Using Remote Sensing and Digital Soil Database, Case Study. Qalubiya Governorate, US-Egypt Workshop.