Journal of Physics: Conference Series
PAPER • OPEN ACCESS
Determination of Soil Moisture Content using
Laboratory Experimental and Field Electrical
Resistivity Values
To cite this article: Z A M Hazreek et al 2018 J. Phys.: Conf. Ser. 995 012074
View the article online for updates and enhancements.
Related content
The Behaviour of Laboratory Soil Electrical Resistivity Value under Basic Soil Properties Influences
Z A M Hazreek, M Aziman, A T S Azhar et al.
-“Doing the Wrong Things Right” Site Investigations in Soft Soil
M. H. Jamilus, A.J.M.S. Lim, A T S Azhar et al.
-Geotechnical hazards associated with closed municipal solid waste landfill sites
-1234567890 ‘’“”
ISMAP 2017 IOP Publishing
IOP Conf. Series: Journal of Physics: Conf. Series 995 (2018) 012074 doi :10.1088/1742-6596/995/1/012074
Determination of Soil Moisture Content using Laboratory
Experimental and Field Electrical Resistivity Values
Z A M Hazreek1*,2, S Rosli2,5, A Fauziah3, D C Wijeyesekera1, M I M Ashraf3, T B
M Faizal1, A F Kamarudin1, Y Rais2, M F Md Dan1, A T S Azhar1 and Z M Hafiz4 1 Faculty of Civil and Environmental Engineering, Universiti Tun Hussein Onn
Malaysia, 86400 Batu Pahat Johor, MALAYSIA
2 School of Physics, Universiti Sains Malaysia, 11800 USM Penang, MALAYSIA 3 School of Civil Engineering, Universiti Sains Malaysia, 14300 Nibong Tebal Penang,
MALAYSIA
4 College of Engineering, Universiti Tenaga Nasional Malaysia, 43000 Kajang,
Selangor, MALAYSIA
5 Centre of Tropical Geoengineering, Universiti Teknologi Malaysia, 81318 UTM
Johor Bahru Johor, MALAYSIA
E-mail: [email protected]
Abstract. The efficiency of civil engineering structure require comprehensive geotechnical data obtained from site investigation. In the past, conventional site investigation was heavily related to drilling techniques thus suffer from several limitations such as time consuming, expensive and limited data collection. Consequently, this study presents determination of soil moisture content using laboratory experimental and field electrical resistivity values (ERV). Field and laboratory electrical resistivity (ER) test were performed using ABEM SAS4000 and Nilsson400 soil resistance meter. Soil sample used for resistivity test was tested for characterization test specifically on particle size distribution and moisture content test according to BS1377 (1990). Field ER data was processed using RES2DINV software while laboratory ER data was analyzed using SPSS and Excel software. Correlation of ERV and moisture content shows some medium relationship due to its r = 0.506. Moreover, coefficient of determination, R2 analyzed has demonstrate that the statistical correlation obtain was very
good due to its R2 value of 0.9382. In order to determine soil moisture content based on
statistical correlation (w = 110.68ρ-0.347), correction factor, C was established through
laboratory and field ERV given as 19.27. Finally, this study has shown that soil basic geotechnical properties with particular reference to water content was applicably determined using integration of laboratory and field ERV data analysis thus able to compliment conventional approach due to its economic, fast and wider data coverage.
1. Introduction
1234567890 ‘’“”
ISMAP 2017 IOP Publishing
IOP Conf. Series: Journal of Physics: Conf. Series 995 (2018) 012074 doi :10.1088/1742-6596/995/1/012074
heavyweight instrument (i.e. boring machine) to obtained subsurface data via soil and rock sampling that are likely to be inefficient in tough environment which require struggling of instrument mobilization, shifting, demobilization and operational. Based on [2], huge number of geomaterials sampling was crucial to obtain reliable soil parameter output and according to [3], this objective was difficult to obtain via drilling which known to be time-consuming and costly. Traditional lab experiment also may experience expensive and time consuming especially during working with hugh quantity of soils tests.
Geophysical method (GM) is increasingly being used as an alternative tool to support and assist the existing conventional SI. Today, GM such as geoelectrical, gravity, seismic, GPR, magnetic, etc has develop lots due to the electronics technology rapid growth. Hence, these methods were able to improve measurement precision due to its sophisticated technology and innovative instrument. Nevertheless, individual geophysical method typical performance always relative to fundamental physical restrictions, e.g. penetration, resolution, and signal to-noise ratio [4]. Classically, GM are widely used for ground exploration since its economic, fast and huge data coverage capability [5]. GM can be applied faster and cheaper and can cover large sites thoroughly [1, 6, 7, 8]. Common geophysical application are often used in engineering, environment and archeological studies which are usually applied to detect and locate boulders, bedrock, overburden materials, earth work related to the rippability, leachate migration, groundwater sources and contamination, cavity, sinkhole, etc. [9].
GM was actually expert by geophysicist is now increased popularity in civil engineering. Due to the prospective of geophysical method in engineering is yet to be understood and entirely established, the utilization of these method are still not being entirely explored. Difficulties rise when the applications of geophysics is lack of exploration by civil engineers because of experience shortage and skills in geophysics area. According to [10], geophysical survey poor preparation by engineers that shortage skills in the techniques, and geophysicists over expectation leading to unsuitable utilization of the available techniques. As reported by [10], geophysicists still having little appreciation from the engineer’s perspectives and lack the information of the science in soil mechanics. According to [5], some geophysical outcome and conclusions are difficult to deliver in sound and definitive ways since some of geophysicists attempt to hide their skills for business motives. These scenarios have created some black box between engineers and geophysicist due to the lack of knowledge, appreciation and cooperation. Uncertainties are raised by engineer to the geophysicist such as the best equipment setting and operation, processing technique and interpretation of data which are still considered as an ongoing mystery by engineers. Moreover, classical geophysical interpretation is relative to anomaly and geomaterials references thus may considered unconvincing in term of its precision due to the qualitative perspectives.
1234567890 ‘’“”
ISMAP 2017 IOP Publishing
IOP Conf. Series: Journal of Physics: Conf. Series 995 (2018) 012074 doi :10.1088/1742-6596/995/1/012074
2. Material and Methods
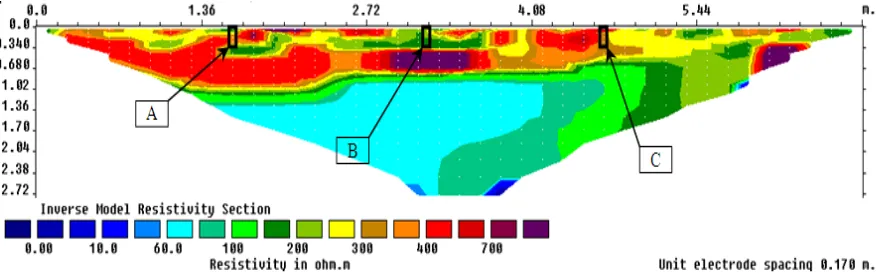
This research was performed based on three phases via fieldwork, lab and data analysis using statistics and utilities software. Field measurement was performed by a single spread line according to pole dipole protocol. Field survey setting was performed using small electrode (2 mm diameter with 150 mm long) with 17 cm electrode spacing for a small study area. Total of 42 small electrodes was used during the survey where 41 numbers of electrodes was assigned with two resistivity land cables connected by jumper cables and the remaining single electrode was used for remote current electrode. Then, two resistivity land cables and a single remote cables was connected to the Terrameter SAS (4000) (data logger) and switch box (electrode selector devices) for data acquisition process. Finally, raw data obtained from field measurement was transferred to the computer for processing. After completion of the field resistivity measurement, three disturbed soil samples was quickly collected from specific points A, B and C which were locate in line with the 2D electrical resistivity survey line as shown in Figure 1. A very shallow disturbed soil samples were taken using hand auger from the surface to a depth of 24 cm. Soil samples were send to the geotechnical laboratory for further laboratory study.
Laboratory experimental task was performed using classification and moisture content tests. Soil classification was conducted via dry and wet sieve methods while oven drying method was used for moisture content determination. All those tests were performed based on [11]. Four numbers of sieve test was performed via soil samples A, B, C and a combination of all (A – C). Lab ER test was conducted using soil box test via Nilsson’s resistance meter and Miller’s box instrument. Oven dried soil samples (1500 g) was taken for the soil box experiment. Oven dried soil (1500 gram) with 2 % of distilled water (30 ml) was uniformly mixed. Soil box test was conducted under dense state for site similarity condition. For dense state, soil was compacted through a completely horizontal wooden plate which fully fitted inside the box. Compacting process was performed in three layers sequences where each layer was impacted by constant driven force based on 27 numbers of blows to obtain constant dense compacted soil condition. Then, electrical resistance of soil was measured using the soil resistance meter devices. After soil electrical resistance was obtained, moisture content tests was performed using soil taken from the present tested box. Two samples of soil moisture content were measured for averaging purposes. The entire steps of soil box experiment was constantly repeated at 25 times.
Data analysis and processing and was performed via the utilization of statistics (Statistical Product and Service Solutions: SPSS and Microsoft Excel), RES2DINV software (field resistivity data analysis) and the interpolation of field and lab ERV and moisture content to developed a field ERV correction factor, C according to calibrated laboratory ERV.
B
A C
2 – D Electrical Resistivity Line 6.8 m
1234567890 ‘’“”
ISMAP 2017 IOP Publishing
IOP Conf. Series: Journal of Physics: Conf. Series 995 (2018) 012074 doi :10.1088/1742-6596/995/1/012074
3. Results and Discussions
Three (3) point of localized field ERV was take out from resistivity section on the particular soil samples location obtain that used for laboratory tests. The results shows the largest field ERV was situated at location A (395 Ωm) followed by location C (289 Ωm) and B (263 Ωm). Outcome from resistivity section conducted from field measurement and the point extracted data was shown in Figure 2.
[image:5.595.79.517.201.338.2]
Figure 2. Resistivity section with ERV point of extraction (based on location of soil sampling).
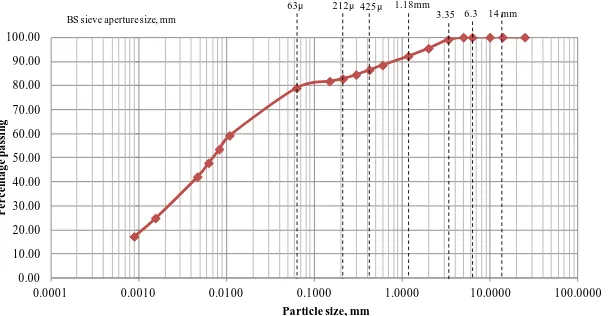
Soil classification test revealed that soils tested were classified as Clayey SILT due to its domination of fine particles of soil. Soil particles was highly composed of silt and clay remained by sand and gravel. Grain size distribution curve and specific soil grained quantity found from the experiment was studied and given in Figure 3 – 6 and Table 1. Soil moisture content (w) at location B (48.68 %) was the largest than location C (40.12 %) and A (35.52 %).
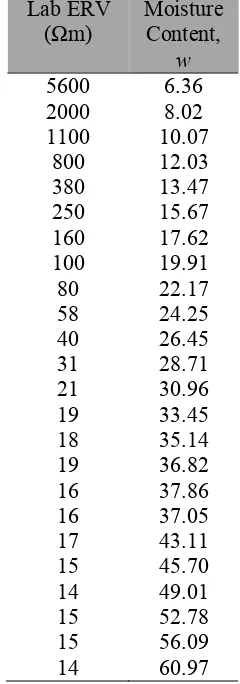
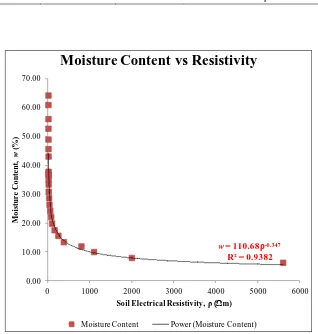
Soil box resistivity tests was conducted via blended soil (soil A – C) because of the similarity soil type (Clayey SILT). Laboratory ERV was measured at 5600 Ωm (largest record) with w of 6.36 % while the smallest lab ERV was establish at 14 Ωm for a w of 64.24 %. All lab ERV and its w findings was shown in Table 2. w against ERV series was analyzed using statistical tools that revealed the ERV was gradually reduced with additional w by curvilinear trend line as given in Figure 7. Laboratory ERV was measured for 25 data numbers for consistency purposes. Based on analysis of statistical correlation, r via SPSS, r value was revealed at 0.506 thus indicate that the correlation strength among ERV and w was at medium strength that further confirmed that the correlation among ERV and w was satisfactory. Precision of r was defined as medium when the r-value was varied at 0.40 – 0.59 [12]. After that, coefficient of determination, R2 was 0.9382 thus indicate that the correlation was very good
since the result was closed to the value of 1.0. As a result, the entire statistical analysis have shown that laboratory ERV data experienced good correlation associate with soil moisture content w, given by w = 110.68ρ-0.347. The entire statistical outcomes are shown in Table 3 and Figure 7.
0.00 10.00 20.00 30.00 40.00 50.00 60.00 70.00 80.00 90.00 100.00
0.0010 0.0100 0.1000 1.0000 10.0000 100.0000
P
e
r
c
e
n
ta
g
e
p
a
s
s
in
g
Particle size, mm
63μ 212μ 1.18mm 3.35 6.3 14 mm BS sieve aperture size, mm 425
μ
1234567890 ‘’“”
ISMAP 2017 IOP Publishing
[image:6.595.148.449.117.291.2]IOP Conf. Series: Journal of Physics: Conf. Series 995 (2018) 012074 doi :10.1088/1742-6596/995/1/012074
Figure 3. PSD curve for soil sample A.
0.00 10.00 20.00 30.00 40.00 50.00 60.00 70.00 80.00 90.00 100.00
0.0010 0.0100 0.1000 1.0000 10.0000 100.0000
P e r c e n ta g e p a ss in g
Particle size, mm
63μ 212μ 1.18mm 3.35 6.3
14 mm
BS sieve aperture size, mm 425μ
Figure 4. PSD curve for soil sample B.
0.00 10.00 20.00 30.00 40.00 50.00 60.00 70.00 80.00 90.00 100.00
0.0010 0.0100 0.1000 1.0000 10.0000 100.0000
P e r c e n ta g e p a s s in g
Particle size, mm
63μ 212μ 1.18mm
3.35 6.3 14 mm BS sieve aperture size, mm
[image:6.595.151.450.350.505.2]425μ
Figure 5. PSD curve for soil sample C.
0.00 10.00 20.00 30.00 40.00 50.00 60.00 70.00 80.00 90.00 100.00
0.0001 0.0010 0.0100 0.1000 1.0000 10.0000 100.0000
P e r c e n ta g e p a ss in g
Particle size, mm 63μ 212μ 1.18mm
3.35 6.3 14 mm BS sieve aperture size, mm
425μ
[image:6.595.149.453.546.704.2]
1234567890 ‘’“”
ISMAP 2017 IOP Publishing
[image:7.595.182.413.141.382.2]IOP Conf. Series: Journal of Physics: Conf. Series 995 (2018) 012074 doi :10.1088/1742-6596/995/1/012074
Table 1. Soil particle quantification.
Soil
sample Material
Quantity, %
Quantity, %
A
Gravel 7.85
24.19
Sand 16.34
Silt 46.22
75.81
Clay 29.59
B
Gravel 6.85
20.51
Sand 13.66
Silt 43.12
79.49
Clay 36.37
C
Gravel 5.12
22.86
Sand 17.74
Silt 47.58
77.14
Clay 29.56
A – C
Gravel 4.59
21.10
Sand 16.51
Silt 54.08
78.90
Clay 24.82
[image:7.595.236.356.414.756.2]1234567890 ‘’“”
ISMAP 2017 IOP Publishing
IOP Conf. Series: Journal of Physics: Conf. Series 995 (2018) 012074 doi :10.1088/1742-6596/995/1/012074
14 64.24
Table 3. Summary of statistical analysis.
Correlation (r) Coefficient
of determination (R2) Equation Resistivity
(ρ)
Moisture Content (w)
Moisture
Content, (w) w(C)
1.0 -0.506 0.9382 110.68ρ-0.347
w= 110.68ρ-0.347
R² = 0.9382
0.00 10.00 20.00 30.00 40.00 50.00 60.00 70.00
0 1000 2000 3000 4000 5000 6000
M
o
is
tu
r
e
C
o
n
te
n
t,
w
(%)
Soil Electrical Resistivity, ρ (Ωm)
Moisture Content vs Resistivity
[image:8.595.146.464.213.547.2]Moisture Content Power (Moisture Content)
Figure 7. Laboratory w versus ERV.
In line with past research, electrical resistivity values from laboratory and field are dissimilar creating argument as stated previously. Principally, this issue happened because of geometry factor, K
variation between lab experiment and site measurements. In every measurement, apparent ERV (ρa)
was significantly influenced by K factor selected. K defines as electrode configuration geometry selected during the data acquisition. Apparent resistivity (ρa) is ERV obtained by half-pace geometry
1234567890 ‘’“”
ISMAP 2017 IOP Publishing
IOP Conf. Series: Journal of Physics: Conf. Series 995 (2018) 012074 doi :10.1088/1742-6596/995/1/012074
) ( * ) /
(A L R
(1)
where R is a resistance known as R=∆V/I, A/L is geometry factor, K of current and potential in soil box instruments, A is area of the conducting material and L is material length
R a b ab
a((2 )/( ))*
(2)
where R is a resistance known as R=∆V/I
) (
* R
K
a
(3)
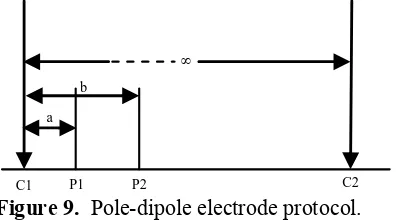
where R is a resistance known as R=∆V/I, K is geometry factor according to pole-dipole electrode arrangement
)) / 1 / 1 ( ) / 1 / 1 /( 1 (( * )) / ) 2
(( V I r1 r2 r3 r4
a
(4)
where K((1/(1/r11/r2)(1/r31/r4)) and was defined as a pole-dipole electrode geometry when one
of the current electrodes is fixed at a larger distance from the other three (substitute r1 = a, r3 = b, r2 =
r4 = ∞ into equation of K)
V
Current, I
C1 P1 P2 C2
) ( * ) / (AL R
[image:9.595.207.404.392.559.2]Soil was fully filled inside the box
Figure 8. Soil box resistivity schematic diagram involving its geometry factor, K.
C1 P1 P2 C2
a b
∞
[image:9.595.208.407.605.715.2]1234567890 ‘’“”
ISMAP 2017 IOP Publishing
IOP Conf. Series: Journal of Physics: Conf. Series 995 (2018) 012074 doi :10.1088/1742-6596/995/1/012074
V
I Power
Surface
r1 r2
r3 r4
C1 P1 P2 C2
Figure 10. Four electrodes on the surface of homogeneous resistivity isotropic ground.
Every array or protocol used during data acquisition (Wenner, Schlumberger, Pole-dipole, Dipole-dipole, etc) has its own K value. Theoretically, the entire ρa was derived using Eq. 4. Therefore, ρa
determined from the ER data acquisition is different due to the K value variations. As a result, it was fundamentally understand that the ERV determined using dissimilar scales via different protocols will generate a different ERV. Moreover, geomaterials physical and chemical influence also may contribute to the ERV variations. ERV is highly associated with water intensity and lithology variations [14]. In some cases, this aspect is taken as a secondary aspect because the crucial factor is influenced by K. Physical and chemical factor of geomaterials may influencing the ERV if the environment and protocol used was same.
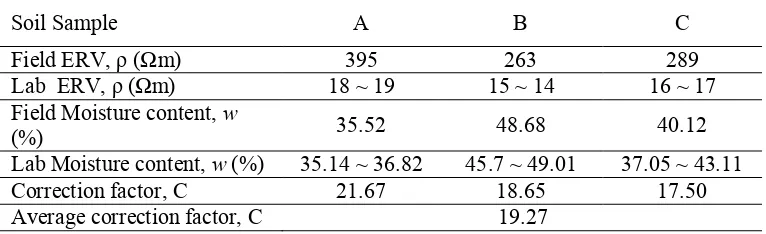
Both ERV from laboratory and field environment was able to be connected and correlated using moisture content interpolation for development of correction factor, C thus able to stable the ERV differences from lab and field. Recorded soil moisture content was similarly measured for both ERV environment thus capable as a guidance for field ERV correction. This study aimed to explore a new electrical resistivity practice that can contribute to the determination of basic geotechnical properties with reference to soil moisture content, w according to lab and field ERV correlation. As a result, correction factor, C, was established thru field ERV correction according to interpolation of field and laboratory w. The study revealed that the correction factor, C for field ERV of Clayey SILT was 21.67 Ωm (Point A), 18.65 Ωm (Point B) and 17.50 Ωm (Point C). Therefore, average C for Clayey SILT was found at 19.27 Ωm. C values summary and its related properties are shown in Table 4. In the end, this study has contribute to the establishment of an alternative method for soil moisture content determine based on corrected field ERV via laboratory ERV. Soil moisture content determination was able to be envisaged via equation model established by the statistical processing as given in Figure 6.
1234567890 ‘’“”
ISMAP 2017 IOP Publishing
[image:11.595.107.490.138.255.2]IOP Conf. Series: Journal of Physics: Conf. Series 995 (2018) 012074 doi :10.1088/1742-6596/995/1/012074
Table 4. Correction factor, C of field ERV established from the field and laboratory data.
Soil Sample A B C
Field ERV, ρ (Ωm) 395 263 289 Lab ERV, ρ (Ωm) 18 ~ 19 15 ~ 14 16 ~ 17 Field Moisture content, w
(%) 35.52 48.68 40.12
Lab Moisture content, w (%) 35.14 ~ 36.82 45.7 ~ 49.01 37.05 ~ 43.11 Correction factor, C 21.67 18.65 17.50 Average correction factor, C 19.27
4. Conclusion
ERV for field and lab environment was effectively conducted using Clayey SILT soil. ERV was essentially effected via geometry factor, K developed by each particular protocols with different scale measurement. The study managed to reduce black boxes via fundamental of resistivity theory. The study revealed that the combination of ERV from laboratory and field environment can contribute to a significant improvement due to its applicable for determination of field and laboratory soil moisture content properties thru statistical correlation together with introducing new field ERV correction factor.
Acknowledgment
The authors would like to express their deepest appreciation to the Ministry of Higher Education and Universiti Tun Hussein Onn Malaysia for supporting this research under Research and Innovation Fund and Incentive Grant Scheme for Publication (IGSP) Vot U258. Many thank are due to all research members for their tremendous work and cooperation.
References
[1] Khatri R, Shrivastava V K and Chandak R 2011 Correlation between vertical electric sounding and conventional methods of geotechnical site investigation Int. Journal of Advanced Engineering Sciences and Technologies. 4 042-053
[2] Pozdnyakova A and Pozdnyakova L 2002 Electrical fields and soil properties. Proceedings of 17th World Congress of Soil Science.14-21 1558
[3] Osman F I S and Osman S B A S 2012 Integrating geo-electrical and geotechnical data for soil characterization International Journal of Applied Physics and Mathematics. 2
[4] Mauritsch H J, Seiberl W, Arndt R, Römer A, Schneiderbauer K and Sendlhofer G P 2000 Geophysical investigations of large landslides in the Carnic Region of Southern Austria
Engineering Geology. 56 373-388
[5] Abidin M H Z, Ahmad F, Wijeyesekera D C, Saad R and Baharuddin M F T 2013 Soil Resistivity Measurements to Predict Moisture Content and Density in Loose and Dense Soil
Applied Mechanics and Materials. 353-356 911-917
[6] Liu C and Evett J B 2008 Soils and Foundation (New Jersey: Pearson International)
[7] Godio A, Strobbia C and De Bacco G 2006 Geophysical characterisation of a rockslide in an alpine region Engineering Geology. 83 273-286
1234567890 ‘’“”
ISMAP 2017 IOP Publishing
IOP Conf. Series: Journal of Physics: Conf. Series 995 (2018) 012074 doi :10.1088/1742-6596/995/1/012074
[9] Abidin M H Z, Saad R, Wijeyesekera D C and Ahmad F 2013 The influence of electrical
resistivity array on its soil electrical resistivity value Electronic Journal of Geotechnical Engineering.18 X 5643-5653
[10] Clayton C R I, Matthews M C and Simons N E 1995 Site Investigation (UK: Blackwell Science Ltd)
[11]Methods of test for Soils for Civil Engineering Purposes, British Standard 1377:1990
[12]Yahaya A S, Ahmed A, Gabda D and Na C S 2008 Problem and Solution in Statistics for Engineers and Scientist (Selangor, Prentice Hall)
[13]Telford W M, Geldart L P and Sheriff R E 1990 Applied Geophysics (Cambridge: Cambridge University Press)
[14]Griffith D H and King R F 1981 Applied Geophysics for Geologist and Engineers (Oxford: Pergamon Press)
[15] Benson R C, Yuhr L and Kaufmann R D 2003 “Some Considerations for Selection and Successful Application of Surface Geophysical Methods,” Proc. The 3rd Int. Conf. on Applied Geophysics (Orlando, Florida, 2003)
[16] Fraiha S G C and Silva J B C 1994 Factor analysis of ambiguity in geophysics Geophysics. 59 1083–1091