Journal of Chemical and Pharmaceutical Research, 2015, 7(7):766-774
Research Article
ISSN : 0975-7384
CODEN(USA) : JCPRC5
Development and validation of stability indicating RP-LC method for
estimation of celecoxib (CXB) in microemulsion capsule formulations
Kalpana Nekkala
1*, V. Shanmukha Kumar J.
1, D. Ramachandran
2and Ganji Ramanaiah
21
Dept. of Chemistry, KL University, Vaddeswaram, Guntur, India
2
Dept. of Chemistry, Acharya Nagarjuna Univ., Nagarjuna Nagar, Guntur, India
_____________________________________________________________________________________________
ABSTRACT
An isocratic reverse phase liquid chromatography (RP-LC) method has been developed and subsequently validated for the determination of Celecoxib in Bulk and its pharmaceutical formulation. Separation was achieved with a Symmetry RP-18 ((Make: Waters Corporation; 75 mmx4.6 mm I.D; particle size 5 µm)) Column and Potassium di-hydrogen phosphate monohydrate buffer (pH adjusted to 3.0 with diluted orthophosphoric acid): methanol: acetonitrile (400:400:200) v/v as eluent at a flow rate of 0.8 mL/min. UV detection was performed at 225nm. The method is simple, rapid, and selective. The described method of Celecoxib is linear over a range of 25 µg/mL to 75 µg/mL. The method precision for the determination of assay was below 1.0% RSD. The percentage recoveries of active pharmaceutical ingredient (API) from dosage forms ranged from 98 to 102%. The results showed that the proposed method is suitable for the precise, accurate and rapid determination of Celecoxib in bulk, its capsule dosage forms.
Key words: Celecoxib, RP-LC, Validation, Dosage form
_____________________________________________________________________________________________
INTRODUCTION
Celecoxib (CXB) is a selective cyclooxygenase-2 (COX-2) inhibitor used for treatment of rheumatoid arthritis and osteoarthritis [1,2]. CXB has analgesic, antipyretic, and anti-inflammatory activity as a result of selective inhibition of the enzyme COX-2 and does not inhibit platelet aggregation [3]. In contrast with other non-steroidal anti-inflammatory drugs (NSAIDs) it has neither acute nor chronic gastrointestinal toxicity [1–4]. CXB is also used for treatment of colon cancer [5], ultraviolet (UV) light-induced skin cancer [6], and breast cancer [7].
The authors have developed a new, simple and fast analytical method by RP-LC to quantify Celecoxib in bulk and its dosage forms. This validation study is carried out as per ICH guidelines.
Figure-1: Chemical Structure of Celecoxib
EXPERIMENTAL SECTION5-6
Instrumentation
The analysis of the drug was carried out on a waters LC system equipped with 2695pump and 2996 photodiode array detector was used and a Reverse phase HPLC column Symmetry RP-18 ((Make: Waters Corporation, Ireland); 75 mmx4.6 mm I.D; particle size 5 µm)) was used. The output of signal was monitored and integrated using waters Empower 2 software.
Chemicals and solvents
Milli-Q Water, Acetonitrile (HPLC Grade), Methanol (HPLC Grade), Orthophosphoric acid (GR Grade), Potassium dihydrogen phosphate monohydrate (GR Grade) were obtained from Qualigens Ltd., Mumbai.
Buffer preparation
Accurately weigh and transfer about 2.72 grams of Potassium di-hydrogen phosphate monohydrate in 1000 mL of purified water and mix. Adjust pH to 3.0 (±0.05) with dilute orthophosphoric acid solution. Filter the solution through 0.45µm membrane filter.
Mobile phase preparation
Prepare a filtered and degassed mixture of Buffer, Methanol and Acetonitrile in the ratio of 400:400:200 v/v respectively.
Diluent preparation
Mobile phase is used as diluent.
Standard preparation:
Accurately weigh and transfer about 100.0mg of Celecoxib into a 200 mL volumetric flask, add 160 mL of mobile phase and sonicate to dissolve. Cool the solution to room temperature and dilute to volume with diluent. Transfer 5.0 mL of the above solution into a 50 mL volumetric flask and dilute to volume with diluent (Mobile Phase).
Sample preparation:
Weigh and finely powder not fewer than 20 Capsules. Accurately weigh and transfer equivalent to 100 mg of Celecoxib into a 200 mL volumetric flask add about 160 mL of mobile phase, and sonicate for 30minutes with intermittent shaking at controlled temperature and dilute to volume with mobile phase and mix. Filter the solution through 0.45 µm membrane Filter. Transfer 5.0 mL of the above solution into a 50 mL volumetric flask and dilute to volume with diluent.
Chromatographic conditions
RESULTS AND DISCUSSION
Method development5-7
To develop a suitable and robust LC method for the determination of Celecoxib, different mobile phases were employed to achieve the best separation and resolution. The method development was started with Symmetry RP-18 ((Make: Waters Corporation (Ireland); 150 mmx4.6 mm I.D; particle size 5 µm)) with the following mobile phase. Accurately weigh and transfer about 2.72 grams of Potassium di-hydrogen phosphate monohydrate in 1000 mL of purified water and mix. Adjust pH to 4.2 (±0.05) with dilute orthophosphoric acid solution. Filter the solution through 0.45µm membrane filter. Prepare a filtered and degassed mixture of Buffer and methanol in the ratio of 500:500 v/v respectively.
Celecoxib peak was eluted at void volume. For next trial the mobile phase composition was changed slightly. The mobile phase composition was Buffer and methanol in the ratio of 400:600 v/v. above trail the peak shape was little broad. Then pH of the buffer was changed to 3.2 from 4.0 and the mobile phase was modified slightly to Buffer: Methanol: Acetonitrile in the ratio of 400:400:200 v/v respectively as eluent at flow rate 0.8 mL/min. UV detection was performed at 225nm. The retention time of Celecoxib is 4.0 minutes (refer Fig-4.) and the peak shape was good.
The chromatogram of Celecoxib standard using the proposed method is shown in Fig-4. System suitability results of the method are presented in Table-1. Celecoxib shows significant UV absorbance at Wavelength 225nm. Hence this wavelength has been chosen for detection in analysis of Celecoxib.
Method validation 5-7
The developed RP-LC method extensively validated for assay of Celecoxib using the following Parameters.
Specificity
Blank and Placebo interference
A study to establish the interference of blank and placebo were conducted. Diluent and placebo was injected into the chromatograph in the defined above chromatographic conditions and the blank and placebo chromatograms were recorded. Chromatogram of Blank solutions showed no peaks at the retention time of Celecoxib peak. This indicates that the diluent solution used in sample preparation do not interfere in estimation of Celecoxib in Celecoxib capsules.
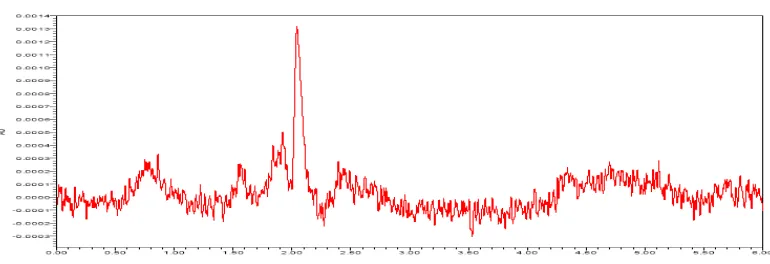
[image:3.595.105.490.500.632.2]The chromatogram of Celecoxib Blank using the proposed method is shown in Fig- 2.
Figure 2: A typical HPLC Chromatogram showing the no interference of diluent for Celecoxib
Figure 3: A typical HPLC Chromatogram showing the no interference of placebo for Celecoxib
Figure 4: A typical HPLC Chromatogram showing the peak of Celecoxib
Table 1: System suitability parameters for Celecoxib by proposed method
Name of the Compound Theoretical plate Tailing factor
Celecoxib 4721 1.21
Forced Degradation:
Control Sample: Weigh and finely powder not fewer than 20 Capsules. Accurately weigh and transfer equivalent to 50 mg of Celecoxib into a 200 mL volumetric flask add about 160 mL of diluent, and sonicate for 30minutes with intermittent shaking at controlled temperature and dilute to volume with diluent and mix. Filter the solution through 0.45 µm membrane Filter. Transfer 5.0 mL of the above solution into a 50 mL volumetric flask and dilute to volume with diluent.
Acid Degradation Sample: Weigh and finely powder not fewer than 20 Capsules. Accurately weigh and transfer equivalent to 50 mg of Celecoxib into a 200 mL volumetric flask add about 160 mL of diluent , and sonicate for 30minutes with intermittent shaking at controlled temperature. Then add 5mL of 1N acid, refluxed for 30min at 60°C, then cooled to room temperature, neutralize with 1N NaOH and dilute to volume with diluent and mix. Filter the solution through 0.45 µm membrane Filter. Transfer 5.0 mL of the above solution into a 50 mL volumetric flask and dilute to volume with diluent.
Peroxide Degradation Sample : Weigh and finely powder not fewer than 20 Capsules. Accurately weigh and transfer equivalent to 50 mg of Celecoxib into a 200 mL volumetric flask add about 160 mL of diluent , and sonicate for 30minutes with intermittent shaking at controlled temperature. Then add 2mL of 30% Peroxide, refluxed for 30min at 60°C, then cooled to room temperature and dilute to volume with diluent and mix. Filter the solution through 0.45 µm membrane Filter. Transfer 5.0 mL of the above solution into a 50 mL volumetric flask and dilute to volume with diluent.
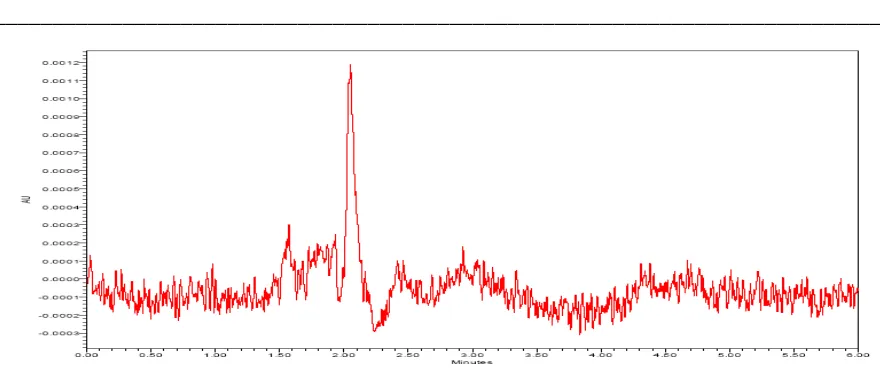
Figure 5A: A typical HPLC Chromatogram showing the degradation profile of Celecoxib in Acid hydrolysis by proposed method
Figure 5B: A typical HPLC Chromatogram showing the degradation profile of Celecoxib in Base hydrolysis by proposed method
[image:5.595.99.492.508.671.2]Figure 5D: A typical HPLC Chromatogram showing the degradation profile of Celecoxib in Thermal hydrolysis by proposed method
Thermal Degradation Sample: Powder collected from 20 capsules are exposed to heat at 105°C for about 5days. Then Weigh and finely powder not fewer than 20 Capsules. Accurately weigh and transfer equivalent to 50 mg of Celecoxib into a 200 mL volumetric flask add about 160 mL of diluent, and sonicate for 30minutes with intermittent shaking at controlled temperature and dilute to volume with diluent and mix. Filter the solution through 0.45 µm membrane Filter. Transfer 5.0 mL of the above solution into a 50 mL volumetric flask and dilute to volume with diluent.
Similarly Humidity, UV-Light exposure, Sunlight exposure and Water hydrolysis stress samples are prepared and checked for their purity by proposed method.
Table 2: Summary of the degradation profile of Celecoxib by proposed method
Name of the Sample Condition Purity angle Purity threshold % assay Celecoxib
Control Sample N/A 0.247 0.321 99.4
Acid Degradation Sample 5mL, 5N HCl, 60°C/60min 0.125 0.129 99.1
Base Degradation Sample 5mL,5N NaOH, 60°C/60min 0.347 0.367 98.5
Peroxide Degradation Sample 5mL, H2O2, 0°C/30min 0.314 0.363 98.9
Humidity Degradation Sample @90% RH for 7 days 0.412 0.429 99.3
Thermal Degradation Sample @105°C for 5 days 0.614 0.687 99.2
Photolytic Degradation Sample 1.2lak Lux units 0.178 0.249 99.4
From the above data of degradation profile it can be conclude that there is no interference found for of Celecoxib peak.
Precision
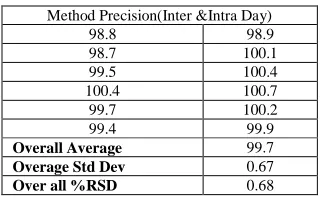
[image:6.595.218.378.591.691.2]In the study of the instrumental system precision where, a RSD of 0.1% was obtained for the standard area obtained corresponding to the first day, being 0.3% for the second day, respectively. The method precision study for six sample preparations in marketed samples showed a RSD of 0.2% and the 95% confidence interval of 0.2 with the assay range of 99.9-100.4
Table 3: Method Precision (Inter and Intra) studies for Celecoxib by proposed method
Method Precision(Inter &Intra Day)
98.8 98.9
98.7 100.1
99.5 100.4
100.4 100.7
99.7 100.2
99.4 99.9
Overall Average 99.7
confidence interval of 0.5 with the assay range of 99.8-100.6 The Overall %RSD for n=12 is 0.3. Both results together with the individual results are showing that the proposed analytical technique has a good intermediate precision.
Accuracy:
[image:7.595.103.495.475.692.2]The accuracy of the method was determined on three concentration levels by recovery experiments. The recovery studies were carried out in triplicate preparations on composite blend collected from 20 capsules of Celecoxib and analyzed as per the proposed method. The percentage recoveries with found in the range of 99.1 to 101.1 with an overall %RSD of 0.6. From the data obtained which given in table-2 the method was found to be accurate.
Table 4: Recovery studies for Celecoxib by proposed method
% Level Recovery Range % RSD at each level Over all %RSD
50 98.5-99.4 0.41
0.57
100 98.9-100.1 0.61
150 99.4-100.2 0.41
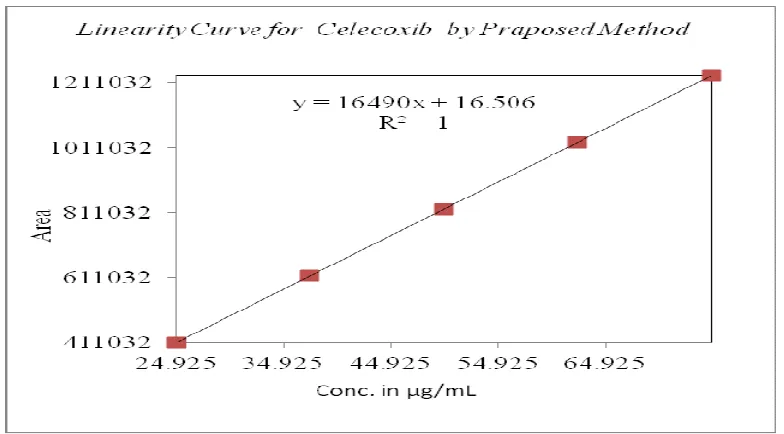
Linearity of detector response
The standard curve was obtained in the concentration range of 24-75µg/ml. The linearity of this method was evaluated by linear regression analysis. Slope, intercept and correlation coefficient [r2] of standard curve were calculated and given in figure-4 to demonstrate the linearity of the method.
From the data obtained which given in table-3 the method was found to be accurate.
Robustness :
As per ICH guidelines, robustness studies were conducted for flow rate, mobile phase composition, pH variation. The peak shape for all the impurities was found to be good. Peak purity for all impurities also tested to observe no placebo peaks interference in all the robust conditions.
Solution Stability :
solution stability was established for Celecoxib standard and sample up o 24hrs on bench top. The data shows that the standard and sample were stable.
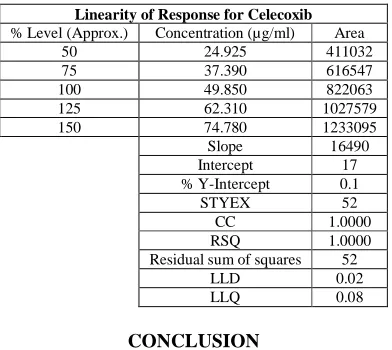
Table 5: Linearity studies for Celecoxib by proposed method
Linearity of Response for Celecoxib
% Level (Approx.) Concentration (µg/ml) Area
50 24.925 411032
75 37.390 616547
100 49.850 822063
125 62.310 1027579
150 74.780 1233095
Slope 16490
Intercept 17
% Y-Intercept 0.1
STYEX 52
CC 1.0000
RSQ 1.0000
Residual sum of squares 52
LLD 0.02
LLQ 0.08
CONCLUSION
We have developed a fast, simple and reliable analytical method for determination of Celecoxib in pharmaceutical preparation using RP-LC. As there is no interference of blank and placebo at the retention time of Ranolazine. It is very fast, with good reproducibility and good response. Validation of this method was accomplished, getting results meeting all requirements. The method is simple, reproducible, with a good accuracy and precision. It allows reliably the analysis of Celecoxib in bulk, its pharmaceutical dosage forms.
REFERENCES
[1]www.druginfo.nlm.nih.gov (Celecoxib) [2]www.rxlist.com (Celecoxib)
[3]Clare Greenaway, Neville Ratnaraj, Josemir W. Sander, Philip N. Patsalos, Therapeutic Drug Monitoring, 2010. 32(4), 448,.
[4]Practical HPLC Method Development, Second Edition, Lloyd R. Snyder, Joseph J.Kirkland, Joseph I.Glajch,1997.
[5]United States Pharmacopeia, 2011, USP 34-NF 29.
[6]ICH Guidelines on Validation of Analytical procedure: Text and Methodology Q 2 (R1), 2011. [7]J. Fort, Am. J. Orthop., 1999, 28, 13.
[8]A. Gaurl, A.M. Martel, and J. Castner, Drugs Future, 1997, 22, 711. [9]G.S. Gies, Scand. J. Rheumatol., 1999,109, 31.
[10]M.M. Goldberg, Clin. Ther.,1999, 21, 1497.
[11]T. Kawamori, C.V. Rao, K. Seibert, and B.S. Reddy, Cancer Res., 1998, 58, 409.
[12]S.M. Fisher, H.H. Lo, G.B. Gordon, K. Seibert, G. Kellof, R.A. Lubet, and C.J. Conti, Mol. Carcinog.,1999, 25, 231.
[13]R.E. Harris, G.A. Alshafie, H. Asbou-Issa, and K Seibert, Cancer Res., 2000, 60, 2101. [14]R.N. Rao, S. Meena, and A.R. Rao, J. Pharm. Biomed. Anal., 2005,39, 349.
[15]R.N. Saha, C. Sajeev, P.R. Jadhav, S.P. Patil, and N. Srinivasan, J. Pharm. Biomed. Anal., 2002,28, 741. [16]O.I. Wong, N. Tsuzuki, M. Rhichardson, M.H. Rytting, W.R. Konishi, and T. Higuchi, Heterocycles,1987, 26, 315.
[17]M.N.E.I. Kousy, J. Pharm. Biomed. Anal., 1999, 20, 185. [18]R.W. Mathew and F. Jamali, J. Chromatogr.,1993, 616, 59.
[19]C. Giachetti, A. Assandri, G. Zalano, and E. Brembilla, Biomed. Chromatogr.,1994, 8, 180.
[26]U. Satyanarayana, D. Rao, Y.K. Kumar, J.M. Babu, P.R. Kumar, and J.T. Reddy, J. Pharm. Biomed. Anal.,2004, 35, 951.
[27]F. Schoenberger, G. Hienkele, T.E. Murdter, S. Brenner, U. Koltz, and U. Hoffman, J. Chromatogr. B,2002, 768, 255.