18 -20 November 2015, Seri Iskandar, Perak
Simulation and Development of Performance
Correlations of 3-D Turning Diffuser via ACFD
Normayati Nordin
Faculty of Mechanical and Manufacturing Engineering Universiti Tun Hussein Onn Malaysia
Batu Pahat, Malaysia [email protected]
Zainal Ambri Abdul Karim
Department of Mechanical Engineering Universiti Teknologi Petronas
Tronoh, Malaysia [email protected]
Safiah Othman (Former lecturer)
Faculty of Mechanical and Manufacturing Engineering Universiti Tun Hussein Onn Malaysia
Batu Pahat, Malaysia [email protected]
Vijay R. Raghavan
OYL Research & Development Centre OYL Research & Development Sdn Bhd
Sungai Buloh, Malaysia [email protected]
Abstract— This paper aims to intensively simulate the
performances of 3-D turning diffuser by varying geometrical and operating parameters and to develop the performance correlation by means of Asymptotic Computational Fluid Dynamic (ACFD) technique. The performances of turning diffusers were measured primarily by outlet pressure recovery coefficient, Cp and flow uniformity index, out. The geometrical
and operating parameters namely inflow Reynolds number (Rein = 5.786 x 10⁴ – 1.775 x 10⁵), inlet throat width ratio (Lin/W1
= 1.5 - 25.0) and outlet-inlet configurations (W2/W1 = 1.067 –
2.667 and X2/X1 = 1.118 – 2.778) were varied. The performance correlations as a function of geometrical and operating parameters, i.e. Cp = f (Lin/W1, W2/W1, X2/X1, Rein) and out = f (Lin/W1, W2/W1, X2/X1, Rein)are successfully developed
via ACFD with deviation to the experiment approximately of 7%.
Keywords— ACFD; CFD; turning diffuser
I. INTRODUCTION
Study of the geometry effect on diffuser performance has been of fundamental interest to researchers in the area of fluid mechanics since decades and it continues to grow [1-8]. The performance of diffuser is primarily evaluated by means of:
(i) Outlet pressure recovery coefficient (Cp)
2 ) (
2
in in out p
V P P C
(1)
where,
Pout= outlet static pressure (Pa) Pin= inlet static pressure (Pa)
= flow density (kg/m3)
Vin= inlet air velocity (m/s)
(ii) Flow uniformity index (out)
= ∑ ( − ) (2)
where,
N= number of measurement points
Vi= local outlet air velocity (m/s) Vout= mean outlet air velocity (m/s)
The value of Cp indicates how much kinetic energy is
successfully converted to pressure energy. The main problem in achieving high pressure recovery is flow separation, which results in non-uniform flow distribution. The out is used to measure the dispersion of local velocity
from the mean velocity. It is strongly dependent on the distribution of core flow and the presences of secondary flow. The flow is considered uniform with the presences of secondary flow of less than 10%.
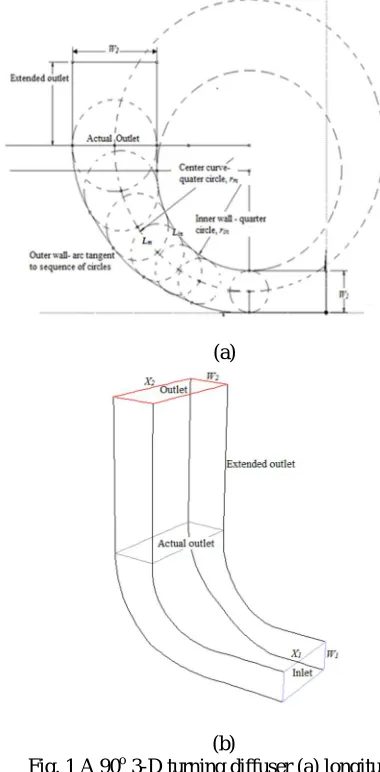
In the current work, the performance of 3-D turning diffuser with 90o angle of turn () as shown in Fig. 1 is intensively simulated by varying geometrical and operating
parameters namely inflow Reynolds number
(Rein= 5.786 x 10⁴ – 1.775 x 10⁵), inlet throat width ratio
(Lin/W1= 1.5 - 25.0) and outlet-inlet configurations
(W2/W1= 1.067 – 2.667 and X2/X1 = 1.118 – 2.778).
18 -20 November 2015, Seri Iskandar, Perak
(a)
[image:2.595.57.247.66.452.2](b)
Fig. 1 A 90o 3-D turning diffuser (a) longitudinal section (b) isometric view
number of solutions to develop correlations from the CFD simulations, where n represents non-dimensional variables.
The performance correlations as a function of geometrical and operating parameters of 3-D turning diffuser are developed in the current work by means of ACFD, i.e. Cp = f (Lin/W1, W2/W1, X2/X1, Rein) and
out = f (Lin/W1, W2/W1, X2/X1, Rein). These correlations
minimise time and effort needed by other researchers to evaluate the performances of 3-D turning diffuser without necessarily of their own simulating the system.
II. CFD METHODOLOGY
The Cp and out were obtained from the CFD simulations
by varying each geometrical and operating parameter within the specified range to five set of solutions. The reference case was prescribed at Rein ref = 6.382 x 10⁴, W2/W1ref =1.44,
X2/X1ref =1.50, Lin/W1ref = 3.99. Other performance indicators
such as loss coefficient (K), dispersion of core flow (y),
separation point (S) and secondary flow index (Sout) were
considered to comprehensively discuss the results.
The following three-dimensional steady-state Reynolds Averaged Navier Stokes (RANS) equations were numerically solved: Continuity equation: 0 z w y v x u (3)
x- momentum equation:
z w u y v u x u z u y u x u x P z u w y u v x u u ) ( ) ( ) ( 1 1 2 2 2 2 2 2 2 (4)
y- momentum equation:
z w v y v x v u z v y v x v y P z v w y v v x v u ) ( ) ( ) ( 1 1 2 2 2 2 2 2 2 (5)
z- momentum equation:
z w y w v x w u y w x w z P z w w y w v x w u ) ( ) ( ) ( 1 1 2 2 2 2 2 (6)
Green-18 -20 November 2015, Seri Iskandar, Perak
Gauss Cell-based, was employed for the solution of the gradient. The solutions were considered converged when the scaled residual of all simulated variables dropped to 10-6 and the conservation of overall mass balance through the domain boundary exceeded 99%.
III. EFFECT OF VARYING GEOMETRICAL AND
OPERATING PARAMETERS
Effects of varying geometrical and operating parameters (Rein, W2/W1, Lin/W1 and X2/X1) on the pressure recovery and
flow uniformity of the 3-D turning diffusers are examined.
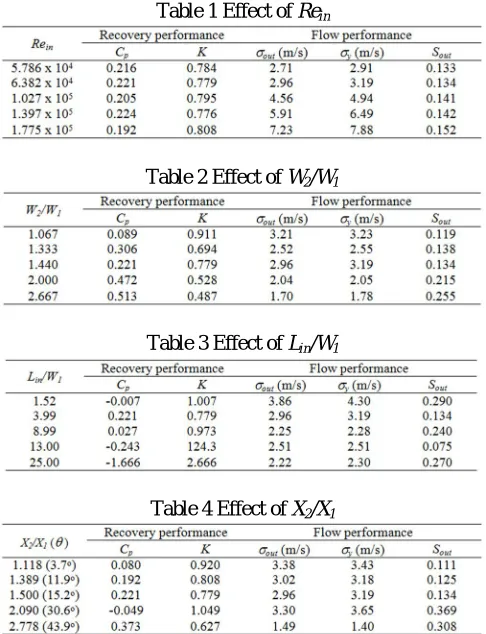
As depicted in Table 1, varying Rein from 5.786 x 10⁴ to
1.775 x 10⁵ provides significant influence on the Cp and
out. The Cp is affected by the existences of flow separation
and vortices, whereas the outis resulted by the dispersion of
core, y and secondary flows, Sout. Applying high Rein
[image:3.595.316.559.63.380.2]considerably influences the formation of vortices and onset flow separation of the 3-D turning diffuser as respectively shown in Fig. 2 and 3.
Fig. 2 Onset flow separation, S at (a) Rein = 5.786 x 10⁴, (b) Rein = 1.027 x 10⁵ and (c) Rein = 1.775 x 10⁵
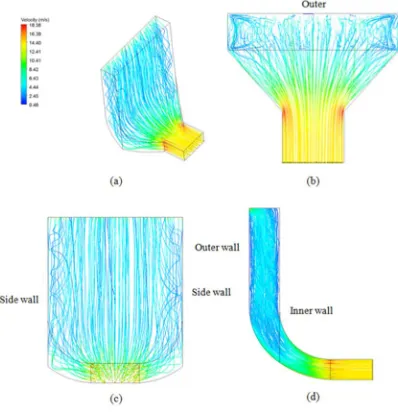
Fig. 3 Velocity streamlines at Rein = 1.775 x 10⁵ (a)
isometric, (b) top, (c), front and (d) longitudinal views
Table 1 Effect of Rein
Table 2 Effect of W2/W1
[image:3.595.41.273.339.461.2]Table 3 Effect of Lin/W1
Table 4 Effect of X2/X1
Table 2 shows that the Cp and out of the diffuser
improve with the increase of W2/W1 to maximum due to
high turbulence intensity blending up uniformly the flow and nominal existences of flow separation within the inner wall as respectively shown in Fig. 4 and 5.
Fig. 4 Velocity streamlines at W2/W1 = 2.667 (a)
[image:3.595.342.533.462.688.2] [image:3.595.81.232.511.691.2]18 -20 November 2015, Seri Iskandar, Perak
Fig. 5 Onset flow separation, S at (a) W2/W1 = 1.067 (b) W2/W1 = 1.440and (c) W2/W1= 2.667
As depicted in Table 3, the best recovery of the 3-D turning diffuser, Cp= 0.221 is attained by applying Lin/W1=
3.99. Nevertheless, elongating the diffuser Lin/W1 8.99
may associate with skin friction loss that is found to affect severely the recovery regardless of zero separation (Fig. 6, 7 (b) and (c)). Elongating the 3-D turning diffuser to maximum, Lin/W1 = 25.0 basically remedies the flow
uniformity approximately of 43% from the worst, out =
[image:4.595.40.272.35.207.2]3.86. This is attributed by less dispersion of core flow at relatively long Lin/W1.
Fig. 6 Velocity streamlines at Lin/W1 = 25.0 (a) isometric,
[image:4.595.319.558.66.217.2](b) top, (c), front and (d) longitudinal views
Fig. 7 Onset flow separation, S at (a) Lin/W1 = 1.52
[image:4.595.321.545.317.692.2](b) Lin /W1 = 8.99and (c) Lin /W1= 25.0
Table 4 shows that varying X2/X1 influences significantly
[image:4.595.325.524.322.528.2]the recovery and flow performances of the 3-D turning diffuser. Increasing the turbulent intensity could really impede the flow separation and lessen the growth of inner wall boundary layer hence provides promising pressure recovery and flow uniformity (see Figures 8 and 9).
Fig. 8 Velocity streamlines at X2/X1 = 2.778 (a) isometric,
(b) top, (c), front and (d) longitudinal views
Fig. 9 Onset flow separation, S at (a) X2/X1 = 1.118 (b) X2/X1
[image:4.595.49.274.378.681.2]18 -20 November 2015, Seri Iskandar, Perak
IV. PERFORMANCE CORRELATIONS VIA
ACFD
Applying Taylor Series expansion to find outlet pressure
recovery (Cp) correlation:
= + − + −
+ − +
− (2)
where,
= , = /
/ , =
/
/ ,
= /
/
a = 2, b = 1, c = 3, d = 3 are chosen so that all lines could fit in a graph as shown in Fig. 10 and intersect at a point that represents as = 0.230
= = 1.0 , thus = = =
1.0
=−0.0028, =−0.03056, =0.0592,
= 0.0306 are slopes of the corresponding lines
Substituting all the constants in equation 2:
= 0.230− − 1 0.0028−
− 1 0.03056 + /
/ − 1 0.0592 +
/
/ − 1 0.0306 (3)
Applying Taylor Series expansion to find flow uniformity
(out) correlation:
= + − +
− + − + −
(4)
where,
= , = /
/ , =
/
/ ,
= /
/
[image:5.595.150.447.496.689.2]a = 2, b = 1, c = 3, d = 3 are chosen so that all lines could fit in a graph as shown in Fig. 11 and intersect at a point that represents as = 3.2
Fig. 10 Outlet pressure recovery, Cp of 3-D turning diffuser with respect to1= [Rein/Rein ref]2, 2= [Lin/W1/Lin/W1ref]1,
18 -20 November 2015, Seri Iskandar, Perak
= = 1.0, thus = = = 1.0
= 0.6531, =−0.2202, =
-0.2725, =−0.2545 are slopes of the
corresponding lines
Substituting all the constants in equation 4:
= 3.2 + − 1 0.6531−
− 1 0.2202− − 1 0.2725−
/
/ − 1 0.2545
(5)
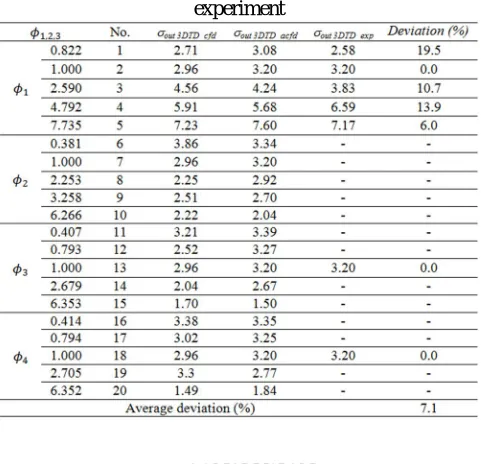
Cp 3DTD acfd and out 3DTD acfd obtained using developed
correlations (3) and (5) are compared with
[image:6.595.318.560.88.320.2]the experimental results as respectively tabulated in Tables 5 and 6. Satisfied agreement between ACFD and experiment results with average deviation of 6.7 and 7.1% is respectively obtained. Hence, the developed correlations can be used as a guideline to preliminarily evaluate the performance of 3-D turning diffuser.
Table 5 Comparison of outlet pressure recovery coefficient (Cp) of 3-D turning diffuser obtained from ACFD
[image:6.595.30.290.210.329.2]correlation and experiment
Table 6 Comparison of flow uniformity index (out) of 3-D
turning diffuser obtained from ACFD correlation and experiment
V. CONCLUSION
In conclusion, the current work manages to intensively simulate the effects of geometrical and operating parameters on the performances of 3-D turning diffuser. The performance correlations as a function of geometrical and operating parameters are successfully developed via ACFD with deviation to the experiment approximately of 7%.
REFERENCES
[1] G. Gan and S.B. Riffat, “Measurement and computational fluid dynamics prediction of diffuser pressure-loss coefficient,” Applied Energy, vol. 54(2), pp. 181-195, 1996.
[2] W.A. El-Askary and M. Nasr, “Performance of a bend diffuser system: Experimental and numerical studies,” Computer & Fluids, vol. 38, pp. 160-170, 2009.
[3] R.K. Sullerey, B. Chandra, and V. Muralidhar, "Performance comparison of straight and curved diffusers," J. of Def. Sci., vol. 33, pp. 195-203, 1983.
[4] T.P. Chong, P.F. Joseph and P.O.A.L. Davies, “A parametric study of passive flow control for a short, high area ratio 90 deg curved diffuser,” J. Fluids Eng., vol. 130, 2008.
[5] M.K. Gopaliya, M. Kumar, S. Kumar, and S. M. Gopaliya, "Analysis of performance characteristics of S-shaped diffuser with offset," Aerospace Science & Tech., vol. 11, pp. 130-135, 2007.
[6] N. Nordin, V.R. Raghavan, S. Othman and Z.A.A.
Karim,“Compatibility of 3-D turning diffusers by means of varying area ratios and outlet-inlet configurations", ARPN Journal of Engineering and Applied Sciences, Vol. 7, No. 6, pp 708-713, 2012.
[7] N.Nordin, Z,A.A. Karim, S.Othman and V.R. Raghavan, “The performance of turning diffusers at various inlet conditions”. Applied Mechanics and Materials Journal, vol. 465-466, pp. 597-602, 2014. [8] N. Nordin, Z.A.A. Karim, S. Othman, and V. R. Raghavan, "Design &
18 -20 November 2015, Seri Iskandar, Perak
[9] C. Balaji and H. Herwig, “The use of ACFD approach in problems involving surface radiation and free convection”, Int. Comm. Heat and Mass Transfer, vol. 30, pp 251-259, 2003.
[10] C. Balaji, M. Holling and H.Herwig, “A general methodology for treating mixed convection problems using asymptotic computational fluid dynamics (ACFD)” Int. Comm. In Heat and Mass Transfer, vol. 34, pp. 682-691, 2007.
[11] C.Balaji, M.Holling and H.Herwig, “Determination of temperature wall functions for high Rayleigh Number flows using asymptotics: A systematic approach”Int. Journal of Heat and Mass Transfer, vol. 50, pp 3820-3831, 2007.
[12] B. Premachandaran and C. Balaji, “Conjugate mixed convection with surface radiation from a horizontal channel with protruding heat sources”, Int. Journal of Heat and Mass Transfer, vol. 49, pp 3568-3582, 2006.
[13]N. Nordin, V. R. Raghavan, S. Othman and Z. A. A. Karim, “Numerical investigation of turning diffuser performance by varying geometric and operating parameters”, Applied Mechanics and Materials Journal, Vol. 229-231, pp. 2086-2093, 2012.
[14] N.Nordin, Z.A.A. Karim, S.Othman, and V. R. Raghavan,"Numerical investigation of turning diffuser performance: Validation and verification," in 2nd Biannual Post Graduate Conference, Tronoh, 2014. [15] N.Nordin, Z.A.A. Karim, S.Othman, and V. R. Raghavan",Numerical
[image:7.595.103.492.308.578.2]investigation of turning diffuser performance: Validation and verification-Model II", in 3rd Biannual Post Graduate Conference, Tronoh, 2015.
Fig. 11 Flow uniformity index, out of 3-D turning diffuser with respect to1= [Rein/Rein ref]2, 2= [Lin/W1/Lin/W1ref]1,
![Fig. 10 Outlet pressure recovery, Cp of 3-D turning diffuser with respect to 1= [Rein/Rein ref]2, 2= [Lin/W1/Lin/W1ref]1, 3= [W2/W1 /W2/W1ref]3 and 4= [X2/X1 /X2/X1ref]3](https://thumb-us.123doks.com/thumbv2/123dok_us/8764992.895936/5.595.150.447.496.689/outlet-pressure-recovery-turning-diffuser-respect-rein-rein.webp)
![Fig. 11 Flow uniformity index, out of 3-D turning diffuser with respect to 1= [Rein/Rein ref]2, 2= [Lin/W1/Lin/W1ref]1, 3= [W2/W1 /W2/W1ref]3 and 4= [X2/X1 /X2/X1ref]3](https://thumb-us.123doks.com/thumbv2/123dok_us/8764992.895936/7.595.103.492.308.578/flow-uniformity-index-turning-diffuser-respect-rein-rein.webp)
