International Journal of Emerging Technology and Advanced Engineering
Website: www.ijetae.com (ISSN 2250-2459,ISO 9001:2008 Certified Journal, Volume 3, Issue 4, April 2013)
A Protocol Stack Design And Implementation Of Wireless
Sensor Network For Emerging Application
Harish.I
1,
S. Ilango Sambasivan
2, Ajay MP
31PG Scholar, 2Professor, 3Assistant Professor, ECE Department, Sri Shakthi Institute of Engineering and Technology
Coimbatore, India. Abstract— This paper describes the design and
development of protocol stack for wireless sensor networks for deployment in remote area and emerging applications such as precision agriculture pollution monitoring, wild life studies etc. The real time monitoring system is based on ATMEGA microcontroller along with its associated input/output interfaces and Zigbee/IEEE 802.15.4 RF UART for wireless connectivity. The monitored parameters are stored in a database for on-line and off-line analysis as well as decision support on web based method. The developed system was tested at laboratory and results are encouraging.
Keywords— Wireless Sensor Network; Xbee; Temperature sensor; Precision Agriculture; ATMEGA;
I. INTRODUCTION
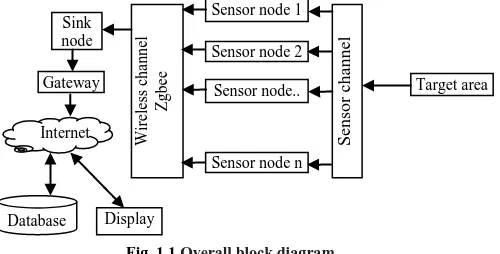
[image:1.612.334.567.300.499.2]Wireless sensor network comes under wireless person area network [WPAN].It is small and infrastructure less. Basically wireless sensor network consists of a number of sensor nodes, called motes and these are working together to monitor a target area.
Fig. 1.1 Overall block diagram
Wireless sensor network are small portable, battery powered device, work under harsh environment. The system consists of sensors, mote, gateway and a database server [1]. Sensor converts the physical parameters to electrical signals which are converted to binary values by analog to digital converters in microcontroller. Microcontroller converts the ADC values to data frames by the application layer.
[image:1.612.53.303.468.595.2]The 802.15.4 RF UART module is used in physical layer which is an Xbee transceiver. Gateway is used to interconnect two different physical layers, in this project the gateway is Xbee to USB converter. Database server collects and stores the data and MySQL is chosen for this application [1].
Fig. 1.2 Architecture of wireless sensor network system
Wireless sensor mote consists of sensor unit, a ATMEGA64 microcontroller and an XBee RF/802.15.4 module.
Precision agriculture is the conjunction of a new management perspective with the new and emerging information and communications technologies leading to higher yields and lower costs in the running of large scale commercial agricultural fields [2]. Known also as Site-Specific, Management, precision farming ensures quicker response times to adverse climatic conditions, better quality control of the produce and yet a lower labor cost.
The parameters which are very crucial for agriculture are Temperature of environment, Humidity, pH and resistivity of soil and hence these are chosen for monitoring [4]. Target area
S
en
so
r
ch
an
n
el
Sensor node 1
Sensor node 2 Sink
node
W
ir
el
ess c
h
an
n
el
Zg
b
ee
Sensor node..
Sensor node n Gateway
Display Internet
Database
Target area = ―precision agriculture‖
Sensor Temperature, humidity, pH, soil
resistivity ATMEGA 64
Battery
Xb
ee
Xbee
Gateway Xbee to USB
International Journal of Emerging Technology and Advanced Engineering
Website: www.ijetae.com (ISSN 2250-2459,ISO 9001:2008 Certified Journal, Volume 3, Issue 4, April 2013)
612 II. DESIGN CONSTRAIN OF WSN
[image:2.612.327.558.127.376.2]Most important thing in designing a WSN is the protocol stack. While the application layer is responsible for data traffic, network layer is responsible for end to end delivery of packets and, data link layer is responsible for routing in network. Physical layer is responsible for device to device delivery of message.
Fig. 2.1. Layers of zigbee
Application layer is most important layer which generates the data traffic depending on the particular use. In this paper the target area is precision agriculture.
Soil and water condition are the most important parameters in precision agriculture and as these very slowly with time varies with time the Sampling rate is chosen accordingly. Sampling rate is the most important parameter to be considered for designing any real-time sensor application. Different applications needs sensor at different sampling frequency which is selected on the basics of Nyquist-Shannon sampling theorem. There are four different categories of frequencies (a) Very Low Frequency (b) Low Frequency (c) Mid Frequency (d) High Frequency.
(a) Very Low Frequencies are used at where the parameters values change very slowly application like Atmospheric temperature changes every 2 ~ 3 min (sampling freq: 0.017-1 Hz).
(b) Low Frequencies are used in the application like heat beat monitoring, volcanic infrasound, and natural seismic vibration.
(c) Mid Frequencies are used in the application like earthquake vibrations and ECG.
(d) High frequencies are used in the multimedia applications like audio, video.
[image:2.612.70.270.234.350.2]The power depends on the frequency and as the sampling frequency increases, the power dissipated by the system also increases reducing the battery life. As the sampling frequency increase the battery life decreases. At Very Low Frequency the battery has maximum life. Comparison of different applications and their sampling rate is given below.
TABLE 1.
COMPARISON OF DIFFERENT APPLICATIONS AND THEIR SAMPLING RATE
Phenomena Sample rate
(in Hz) Very low frequency(<1Hz ) Atmospheric temperature 0.017–1
Low frequency(1Hz-100Hz) Heart rate
Volcanic infrasound Natural seismic vibration
0.8–3.2 20–80 0.2–100 Mid frequency (100 Hz–1000 Hz) Earthquake vibrations
ECG (heart electrical activity)
100–160 100–250 High frequency (>1 kHz) Breathing sounds
Industrial vibrations Audio (human hearing range)
Audio (muzzle shock-wave) Video (digital television)
100–5 k 40 k 15–44 k
1 M 10 M
Application like precision agriculture needs light protocol to monitor parameters at very low cost for hat it helps the farmer to yield more production of crop and cutting the maintenance cost. Automated irrigation, pest control system, and fertilizer management helps the farmers to save the wastage of water, by reducing the usage of unwanted pesticide, and fertilizer.
III. IMPLEMENTATION
The sensor for monitoring the temperature, light, humidity, soil moisture, pH are used in the precision agriculture. Soil moister sensor helps to monitor the moister of soil if the soil moister is below the threshold value then the DSS decision support system will activate the irrigation system and other sensor helps DSS to find the suitable crop for the environment which yields high production.
The system consists of (a) wireless sensor unit, (b) Gateway and (c) DSS server. Wireless sensor unit is a battery powered device which works under very harsh environment.
3.1 Wireless sensor unit
Wireless sensor unit consist of bunch of sensors connected to the microprocessor and a wireless UART module (zigbee)[1].
Architecture of wireless sensor node focuses to reduce cost, increase flexibility, provide fault-tolerance, improve development process and conserve energy.
User defined
Zigbee Alliance Application layer
API
Network Layer
Data Link layer
International Journal of Emerging Technology and Advanced Engineering
Website: www.ijetae.com (ISSN 2250-2459,ISO 9001:2008 Certified Journal, Volume 3, Issue 4, April 2013)
[image:3.612.84.291.202.347.2]The sensor node consists of sensing unit, processing unit (MCU-micro controller unit), communication unit, and power supply as shown in Figure in which node is divided into five major blocks where each block performs some specific task.
Fig. 3.1 Block diagram of wireless sensor node
A.Power Supply Block
First block is Power supply block composed of power battery and DC-DC converter which is responsible for giving energy to the node. Battery cannot be replaced frequently and so proper and efficient utilization of power is very important.
B. Communication Block
Second block Communication block (Transceiver) provides communication channel which may use radio, laser or optical and infrared and in our project we are using XBEE Transceiver 2.4GHz, with zigbee support.
C.Processing Block
Third block is processing block which has memory (RAM), microcontroller (atmega64), operating system and timer which are responsible for acquiring, processing, storing and communicating line information, executing the events respectively
D. Sensing Unit
Fourth block is Sensing unit composed of collection of sensors which produces the electric signal by sensing physical environment and analog to digital converter (ADC) is part of microcontroller which transforms the signal. The type of sensor being used in a sensor node will depend on the application.
E. Software
Last subsystem is Software; it is responsible for collecting data from various sources then processes it and stores it.
The central process unit of sensor node determines energy consumption and computational capabilities of a node.
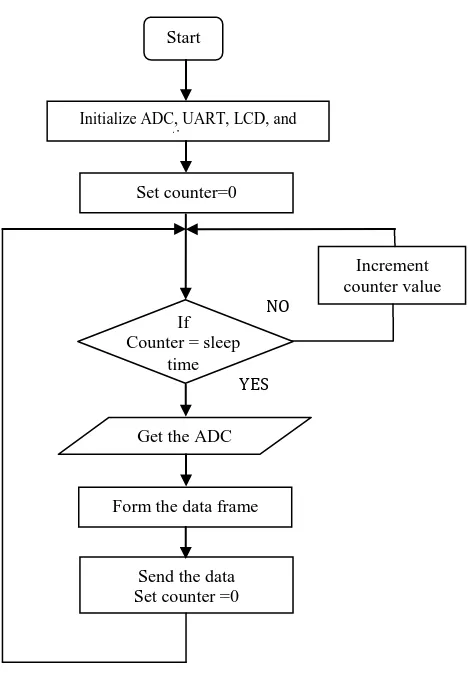
F. Protocol stack (wireless node).
Power on the node.
Initialize the ADC, UART, LCD and TIMER/COUNTER.
Set the value for the counter to zero.
Compare the counter with the sleep time.
If the counter value is not equal to sleep value, then increase the counter value by one for each clock.
If the counter value is equal to sleep value, then get the ADC value from sensor and store it in register.
Covert the raw data’s to data frame [mote ID#sensor_1#value_1#sensor_2#value_2#sensor_3#v alue_3]
Sent the data frame from end device to coordinator , and set the counter value to zero
Go to step 4
Fig. 3.2 Flowchart of Protocol stack (wireless node). Transceiver [Xbee]
200kbps, range 40m
Embedded processor [Atmega 64,8-bit
,16MHz] Memory
(Optional)
Sensor
Battery
If Counter = sleep
time Start
Initialize ADC, UART, LCD, and timer
Set counter=0
Increment counter value
by 1
Get the ADC value
Form the data frame NO
YES
[image:3.612.334.568.374.712.2]International Journal of Emerging Technology and Advanced Engineering
Website: www.ijetae.com (ISSN 2250-2459,ISO 9001:2008 Certified Journal, Volume 3, Issue 4, April 2013)
614 G. Gateway which convert the wireless (zigbee) to USB.
This is the bridge between the wirelesses (zigbee) to wire (USB) physical layers.
H. DSS server unit which record the sensor data for future analysis and display the real-time monitoring.
[image:4.612.55.279.227.545.2]This server is used to record the sensor data and also used for real time monitoring.
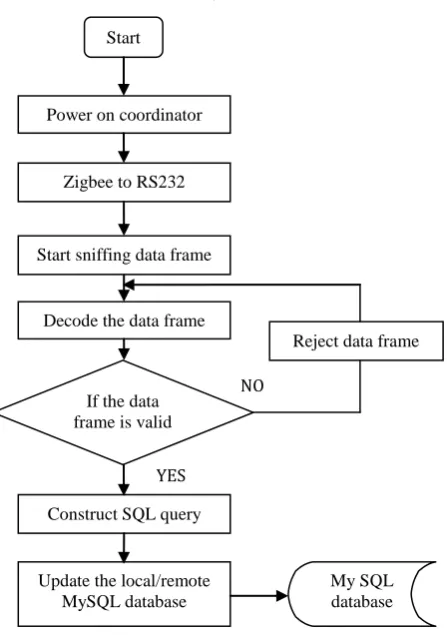
Fig. 3.3 Flowchart of Protocol stacks (gateway and server).
I. Protocol stack at gateway and server
Power on the Xbee
Receive the transmitted signal.
Sniff the data frame from end device and rooter.
Check the data frame is valid.
If the received data frame is not valid, then drop the receive data.
If the received data frame is valid then, encode the binary stream to SQL query.
Update the SQL database.
Go to step 3
IV. RESULT
The proposed system is a web server application based intelligent Tele-monitoring, on other developed projects, working with wireless communication on telecommunication network is more expensive than wireless sensor technology therefore, and it is interesting to pay special attention to try to not pay of the wireless communication service. Linux system with apache server is used for off-line monitoring or Linux system connect to internet for on-line remote monitoring.
[image:4.612.334.556.283.424.2]The results can be viewed in web browser in table view or in graph view.
[image:4.612.323.564.464.658.2]Fig. 4.1 Overall System actual hardware
Figure 4.1 shows the Overall System actual hardware of wireless sensor network.
Fig. 4.2 MySQL database
The above figure 4.2 shows the data recorded in the database table.
NO Start
Power on coordinator
Zigbee to RS232
Start sniffing data frame
Decode the data frame
If the data frame is valid
Construct SQL query
Update the local/remote MySQL database
YES
Reject data frame
International Journal of Emerging Technology and Advanced Engineering
Website: www.ijetae.com (ISSN 2250-2459,ISO 9001:2008 Certified Journal, Volume 3, Issue 4, April 2013)
Fig.4.3 Webpage table view
The above figure 4.3 shows the PHP dynamic web page which automatically refreshes after 5 sec and display the last 30 result of the data base [1].
Fig.4.4 Webpage graph view
The above figure 4.4 shows the graph view of the last 30 result of the data base. The graphical representation of two parameters, (a) BLUE for intensity of light measured using LDR, (b) RED for atmospheric temperature using LM335.
V. CONCLUSION
In this project we have designed a prototype of an embedded wireless sensor network based on ATMEGA64 microcontroller and XBEE [zigbee protocol] for connectivity, The temperature, soil moisture, pH and resistivity were considered as essential for precision agriculture and selected for monitoring.
The collected data was stored and recorded in MySQL database and retrieved later for further analysis.
Development of light waited gateway using microprocessor which support low power zigbee to Ethernet/Wi-Fi/GPRS on a single chip solution will reduce the complex design of wireless sensor and true power of internet for emerging application at low cost system with efficient protocol stack to automatically control the entire system.
Acknowledgment
This work was supported by Sri Shakthi Institute of Engineering and Technology, Coimbatore, India. The author would like to thank Professor Mr. S. Illango Sambasivam, Assistant professor Mr. MS Balamurugan, Assistant professor Mr. Ajay and Associate professor Mrs. Seethalakshmi, at Sri Shakthi Institute of Engineering and Technology, Coimbatore for their constant encouragement and support throughout the work, especially for the useful suggestions given during the course of the work for providing valuable feedback. The author would also like to thank Sri Shakthi Institute of Engineering and Technology Management and ECE faculty for their support of further research program
REFERENCES
[1] P.Khanja, S.Wattanasirichaigoon , J.Natwichai, L.Ramingwong, S.Noimanee1 ―A WEB BASE SYSTEM FOR ECG DATA TRANSFERED USING ZIGBEE/IEEE TECHNOLOGY ― The 3rd International Symposium on Biomedical Engineering (ISBME 2008) [2] Anurag D, Siuli Roy and Somprakash Bandyopadhyay ―AGRO-SENSE: PRECISION AGRICULTURE USING SENSOR-BASED WIRELESS MESH NETWORKS ―IEEE conference 12-May-2008 [3] N.K. Suryadevara and S.C. Mukhopadhyay ‖Wireless Sensors
Network Based Safe Home to Care Elderly People: A Realistic Approach‖, 24-sep-2011 IEEE conference
[4] Aline Baggio. ‖Wireless sensor networks in precision agriculture.‖ [5] Chao Chen, Carlos Pomalaza-Ráez.,‖Monitoring Human Movements
at Home Using Wearable Wireless Sensors ―Indiana University - Purdue University, Fort Wayne, Indiana, USA.
[6] Erdal Cayirci, Member, IEEE.,‖Data Aggregation and Dilution by Modulus‖ IEEE COMMUNICATIONS LETTERS, VOL. 7, NO. 8, AUGUST 2003 355
[7] G. Vellidis , M. Tucker, C. Perry, C. Kvien, C. Bednarz: ― real-time wireless smart sensor array for scheduling irrigation‖ by National Environmentally Sound Production Agriculture Laboratory (NESPAL), University of Georgia, Tifton, GA, USA May 2007. [8] Glen C. Rains, Assistant Professor, Daniel L. Thomas, Former
Professor ―Precision Farming An Introduction‖ .
[9] Hermann Auernhammer.‖Precision farming — the environmental challenge ―Computers and Electronics in Agriculture.
International Journal of Emerging Technology and Advanced Engineering
Website: www.ijetae.com (ISSN 2250-2459,ISO 9001:2008 Certified Journal, Volume 3, Issue 4, April 2013)
616 [11] Raul Moraisa,b,∗, Miguel A. Fernandesb, Samuel G. Matosb, Carlos
Serˆ odioa,b,‖computers and electronics in agriculture‖.
[12] Th. Arampatzis, J. Lygeros, Senior Member, IEEE, and S. Manesis, Member, IEEE ―A Survey of Applications of Wireless Sensors and Wireless Sensor Networks‖, June 27-29, 2005.
[13] Manijeh Keshtgari, Amene Deljoo ‖A Wireless Sensor Network Solution for Precision Agriculture Based on ZigBee Technology‖ by scientific research on Wireless Sensor Network, 2012.