International Journal of Emerging Technology and Advanced Engineering
Website: www.ijetae.com (ISSN 2250-2459,ISO 9001:2008 Certified Journal, Volume 3, Issue 3, March 2013)
Statistical Study of Some Engineering Properties of the
Brahmaputra River Sand
Dr. Dilip Kumar Talukdar
11
Lecturer, Civil Engineering Department, Nowgong Polytechnic, Nagaon, Assam. India. 782001
.
Abstract-- The study has been carried out for determination of some of the engineering properties of the Brahmaputra river sand to observe the variability of some engineering property with respect to location of collection. For this purpose thirty soil samples were collected from different location of the river Brahmaputra and maximum dry density (MDD), optimum moisture content (OMC), unconfined compressive strength (UCS) and california bearing ratio (CBR) value of the soil samples were determined. Statistical analysis of the observed data was made.Mean, standard deviation, variance and coefficient of variation of the observed data was determined. With the observed value of the soil property normal and lognormal distribution were fitted to describe the distribution of the value of soil property with
respect to site. Finally, Chi-square (χ2) and
Kolmogorov-Smirnov test were performed to test the goodness of fit. It was observed that coefficient of variation of all the properties are not so high and log normal distribution can be fitted best to all the properties studied here.
Keywords-- Brahmaputra river sand, normal distribution, lognormal distribution, Kolmogorov-Smirnov test, level of significances.
I. INTRODUCTION
Need of development of road network is increasing day by day for connection of more villages and towns with the main city centre. Procurement of huge quantity of earthwork required for construction of rural roads for connection of remote and unconnected areas in India under Pradhan Mantiy Gram Sadak Yojana (PMGSY) easily and cheaply is a major problem. Again materials used for the construction of sub-grade should have to conform to the compaction requirements, should have adequate strength and if possible, should be able to collect without affecting the environment. In most of the road construction activities in Assam, India, and the earthworks are being collected by cutting the hills which may be a potential cause of environmental degradation in the region. The mighty Brahmaputra which is one of the most heavily sediment-charged large rivers of the world is passing through the state of Assam. The river carries an average annual sediment load of about 400 million metric tons at Pandu (Assam) with an average daily rate of about 2 million metric tons per day during the rainy season.
International Journal of Emerging Technology and Advanced Engineering
Website: www.ijetae.com (ISSN 2250-2459,ISO 9001:2008 Certified Journal, Volume 3, Issue 3, March 2013)
The use of statistical models for the study of compressive strength of recycled concrete was made by Mukherjee, Chakraborty and Bhattacharya (2003). Statistical distribution models can also be used for modeling in air pollution ( Gokhale and Khare, 2003). Therefore, these models are considered to be helpful for quantifying the variability and filtering the soil. MDD, OMC, UCS and CBR are some of the engineering properties of soil which govern the quality of the sub grade.
II. EXPERIMENTAL INVESTIGATIONS
In order to study the properties statistically sand from the river bed was collected from thirty different locations for about 120 kilometer length of the river. Wet sieve analysis of the soil samples were made as per IS (IS: 1498-1970) and the soil samples are observed to be of inorganic silts and very fine sand containing an average value of 61.42% sand, 33.95 % silt and 4.63% clay.After that, maximum dry density, optimum moisture content, unconfined compressive strength, and California bearing ratio were determined. Compaction properties are determined by standard Proctor test. The test was performed in a cylindrical mould of 1000 ml capacity using a rammer of weight 2.6 kg with 310 mm height of free fall. Unconfined compressive strength were performed for remoulded samples prepared in the laboratory at optimum moisture content and maximum dry density using cylindrical moulds. The height diameter ratio of each sample was 2:1. Five days soaked CBR of the soil samples were determined by remoulding the soil samples at OMC. All the tests were performed as per IS: 2720 (Part XVI).
III. TEST RESULTS
The values of the test results are tabulated in Table 1.
IV. STATISTICAL ANALYSIS OF TEST RESULTS The properties of Brahmaputra river sand are essentially random variables as they depend on the location of collection. Hence, values of soil properties from table 1 are used for determination of Mean (), standard deviation (), variance (2), coefficient of variation (CV) and coefficient of skew ness (CS). The values are recorded in Table 2. After testing N numbers of soil samples under the same condition, for each property of soil, a series of the order value x1 <x2 < x3 ……… < xn can be obtained. The cumulative probability F(pi ) of ith value of the property is determined by the least biased estimator (Das, 1993). Both normal and log- normal distribution was fitted to the experimental results.
For both theoretical and practical reasons, the normal distribution is probably the most important distribution in statistics and many classical statistical tests are based on the assumption that the data follow a normal distribution. Normal distributions are extremely important in statistics and are often used in the natural and social sciences for real-valued random variables whose distributions are not known.
(http://www.itlnist.govt/div/898/handbook/eda/section3/eda /3661/html). This distribution is applied to problems concerning calculation of errors made by chance in experiments and statistical inference in every branch of science. In case of normal distribution the values of the mean, median and mode will be the same. Log normal distribution also used in many branches of science. In hydrology, the log-normal distribution is used to analyze extreme values of such variables as monthly and annual maximum values of daily rainfall and river discharge volumes
(http://www.itlnist.govt/div/898/handbook/eda/section3/eda /3661/html). In case of log-normal distribution, the values of mean are more than the median and the values of the median is more than the mode. As the normal distribution is symmetric about its mean, and is non-zero over the entire real line it may not be a suitable model for variables that are inherently positive or strongly skewed. Such variables may be better described by log-normal distribution. Cumulative distribution function for each of the stated property was calculated by using the NORMDIST function of Ms-Excel as it’s actually much easier to calculate probabilities in Excel (http://www.how.com/article/how-to-calculate normal-distribution-probability-in-exel)). For confirmation of the distribution goodness of fit test have been performed for both the distribution.
There are a number of tests, which can be used to test the goodness of fit. The tests which have been examined here are Chi-square test and Kolmogorov-Smirnov (K-S) test. Chi-square test is performed to test the distribution adequacy
(http://www.itl.nist.gov/div898/handbook/eda/section3/eda 35g.htm). But the Chi-square test for goodness of fit is rather insensitive to real departure from normality (Goon, Gupta and Dasgupta, 1993). Therefore, Kolmogorov- Smirnov test was also performed. The distribution of the K-S test statistic itself does not depend on the underlying cumulative distribution function being tested and also it is
an exact test.
International Journal of Emerging Technology and Advanced Engineering
Website: www.ijetae.com (ISSN 2250-2459,ISO 9001:2008 Certified Journal, Volume 3, Issue 3, March 2013)
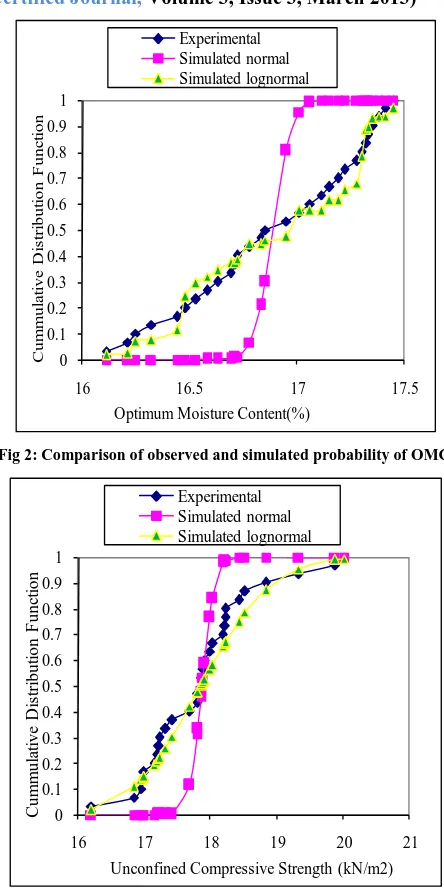
Moreover both small and large sample distribution can be tested by Kolmogorov- Smirnov test and this test concentrate on the deviations between the simulated cumulative probability distribution function and observed cumulative distribution function. Level of significance considered in all cases for this study is 5%. The plots of the distributions are shown in Fig 1 through Fig 4.
V. DISCUSSION OF TEST RESULTS
[image:3.612.363.571.162.547.2]As the soil samples are observed to be of inorganic silts and very fine sand (ML), it has poor stability and may be used for sub-grade of embankments with proper control and not suitable for foundation as it is susceptible to liquefaction (Punmia, 1984). The value of standard deviation for MDD, OMC, UCS and CBR are 0.107 kN/m3, 0.072 %, 0.1547 kN/m3 and 0.050% respectively. As the standard deviations are not high, the amount of scatter of the value of respective property from the mean value is also not high. But on the basis of the standard deviation it is difficult to say whether the dispersion of the value of property is small or large. Keeping the conditions of test for all sample same it is observed that all the property (MDD, OMC, UCS, CBR) satisfy lognormal distribution at 5% level of significance.
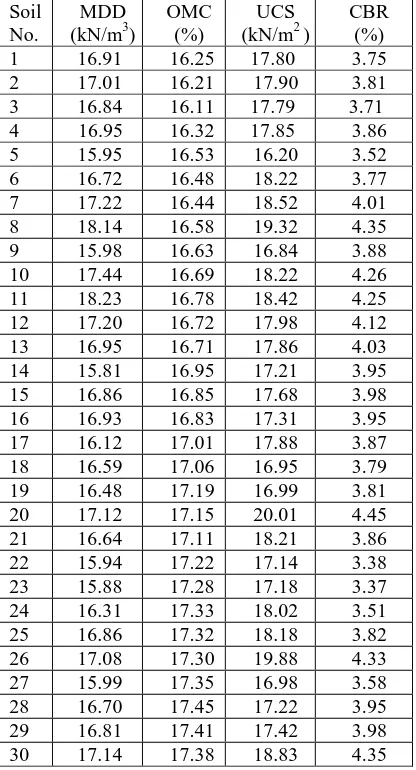
Table 1 Value of soil property.
Soil No.
MDD (kN/m3)
OMC (%)
UCS (kN/m2 )
CBR (%)
1 16.91 16.25 17.80 3.75
2 17.01 16.21 17.90 3.81
3 16.84 16.11 17.79 3.71
4 16.95 16.32 17.85 3.86
5 15.95 16.53 16.20 3.52
6 16.72 16.48 18.22 3.77
7 17.22 16.44 18.52 4.01
8 18.14 16.58 19.32 4.35
9 15.98 16.63 16.84 3.88
10 17.44 16.69 18.22 4.26
11 18.23 16.78 18.42 4.25
12 17.20 16.72 17.98 4.12
13 16.95 16.71 17.86 4.03
14 15.81 16.95 17.21 3.95
15 16.86 16.85 17.68 3.98
16 16.93 16.83 17.31 3.95
17 16.12 17.01 17.88 3.87
18 16.59 17.06 16.95 3.79
19 16.48 17.19 16.99 3.81
20 17.12 17.15 20.01 4.45
21 16.64 17.11 18.21 3.86
22 15.94 17.22 17.14 3.38
23 15.88 17.28 17.18 3.37
24 16.31 17.33 18.02 3.51
25 16.86 17.32 18.18 3.82
26 17.08 17.30 19.88 4.33
27 15.99 17.35 16.98 3.58
28 16.70 17.45 17.22 3.95
29 16.81 17.41 17.42 3.98
International Journal of Emerging Technology and Advanced Engineering
[image:4.612.331.553.126.570.2]Website: www.ijetae.com (ISSN 2250-2459,ISO 9001:2008 Certified Journal, Volume 3, Issue 3, March 2013)
Table 2
Value of statistical parameters.
VI. CONCLUSIONS
* The Brahmaputra river sand are observed to be of inorganic silts and very fine sand (ML), it has poor stability and may be used for sub-grade of embankments with proper control and not suitable for foundation.
* Mean value ofMDD of Brahmaputra river sand is 16.76 kN/m3 and standard deviation is 0.1078 kN/m3. Log normal distribution can be fitted to the observed value of the soil property collected from different locations.
* OMC has a mean value of 17.03 (%) with standard deviation of 0.068%.Log normal distribution is the best fit to describe this property.
* UCS has mean value of 17.86 kN/m2. The standard deviation is 0.1547 kN/m2 and log normal distribution can be fitted to it.
* Mean value of CBR is 3.908%with standard deviation of 0.05%. Log normal distribution can be fitted to the observed value.
0 0.1 0.2 0.3 0.4 0.5 0.6 0.7 0.8 0.9 1
15.5 16 16.5 17 17.5 18 18.5
Cum
m
ul
a
ti
ve
D
is
tri
but
ion
F
unc
ti
on
[image:4.612.60.271.160.254.2]Maximum Dry Density (kN/m3) Experimental Simulated normal Simulated lognormal
Fig 1: Comparison of observed and simulated probability of MDD
0 0.1 0.2 0.3 0.4 0.5 0.6 0.7 0.8 0.9 1
16 16.5 17 17.5
Cum
m
ul
a
ti
ve
D
is
tri
but
ion
F
unc
ti
on
Optimum Moisture Content(%) Experimental Simulated normal Simulated lognormal
Fig 2: Comparison of observed and simulated probability of OMC.
0 0.1 0.2 0.3 0.4 0.5 0.6 0.7 0.8 0.9 1
16 17 18 19 20 21
Cum
m
ul
at
ive
D
is
tri
but
ion
F
unc
ti
on
Unconfined Compressive Strength (kN/m2) Experimental
Simulated normal Simulated lognormal
Fig 3: Comparison of observed and simulated probability of UCS
Soil Property
MDD (kN/m3)
OMC (%)
UCS (kN/m2)
CBR (%)
Mean 16.76 16.888 17.86 3.908
SD 0.1078 0.072 0.1547 0.050
Variance 0.0163 0.0052 0.0239 0.0025
[image:4.612.65.272.476.672.2]International Journal of Emerging Technology and Advanced Engineering
Website: www.ijetae.com (ISSN 2250-2459,ISO 9001:2008 Certified Journal, Volume 3, Issue 3, March 2013)
0 0.1 0.2 0.3 0.4 0.5 0.6 0.7 0.8 0.9 1
3 3.5 4 4.5
Cum
m
ul
a
ti
ve
D
is
tri
but
ion
F
unc
ti
on
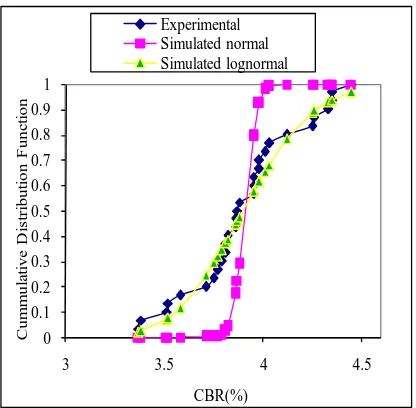
[image:5.612.65.273.133.337.2]CBR(%) Experimental Simulated normal Simulated lognormal
Fig 4: Comparison of observed and simulated probability of CBR.
REFERENCES
[1 ] Goswami, D.C. 2006. The Brahmaputra (Assam’s Borluit): A thriving legend and a threatened lifeline. 21st Indian Engineering
Congress, 21-24 December, 2006, Guwahati.
[2 ] Pal, S.K and Ghosh, A, 2010. Influence of Physical Properties on Engineering Properties of Class F Fly Ash. Indian Geotechnical Conference 2010, Geotrendz, December 16-18,2010, IIT Mumbai. pp 361-364.
[3 ] Gokhle, S and Khare Dr.M. Stastical Methodologies and Modeling in Air pollution. Institution of Engineers (India) Journal- CV, Vol. 83, February 2003.
[4 ] Mukherjee, D, Chakraborty, Dr.S and Bhattacharya, Prof. P.G. 2003. A Statistical Study on Compressive Strength of Recycled Concrete. Institution of Engineers (India) Journal- CV, Vol. 83, February 2003. [5 ] IS: 1498-1970, Classification and Identification of soils for general
engineering purposes, Bureau of Indian Standard, New Delhi. [6 ] (http://www.how.com/article/how-to-calculate
normal-distribution-probability-in-exel)). How to Calculate Normal Distribution Probability in Excel.
[7 ] Das, M.N. 1993. Statistical Methods and Concepts, Wiley Eastern Limited, New Delhi.
[8 ] Das, M.N. (1993) “Statistical Methods and Concepts”. Wiley Eastern Limited. New Delhi.
[9 ] http://www.itlnist.govt/div/898/handbook/eda/section3/eda/3661/ht ml.
[10 ]Kapur, J.N. & Saxena, H.C. (1982) “Mathematical Statistics “ S.Chand & Company, New Delhi – 110055
[11 ]Goon, A.M, Gupta, M.K and Dasgupta, B. Fundamentals of Statistics (vol.-I), 1993, The World Press Pvt. Ltd.