IJPSR (2019), Volume 10, Issue 5 (Research Article)
Received on 04 September 2018; received in revised form, 19 November 2018; accepted, 24 November 2018; published 01 May 2019
STABILITY INDICATING HPTLC METHOD DEVELOPMENT AND VALIDATION FOR SIMULTANEOUS ESTIMATION OF AMLODIPINE BESYLATE AND LOSARTAN POTASSIUM AND CHARACTERISATION OF ACID DEGRADANT PRODUCT OF LOSARTAN
Kanchan Shelar 1, Janhavi R. Rao * 2 and Chaitali Dhale 1
Department of Quality Assurance 1, Department of Pharmaceutical Chemistry 2, Bharati Vidyapeeth University, Poona College of Pharmacy, Pune - 411038, Maharashtra, India.
ABSTRACT: An accurate, precise, sensitive and selective stability indicating High-Performance Thin Layer Chromatographic method has been developed and validated for simultaneous estimation of Amlodipine besylate (AML) and Losartan potassium (LOS) in bulk and pharmaceutical dosage formulation. Chromatographic separation of both the drugs was achieved by using TLC aluminum plates pre-coated with silica gel 60 F254 as the
stationary phase and chloroform: methanol: toluene: acetic acid (5.5: 2.5: 2: 0.05 v/v/v/v) as mobile phase. Densitometric analysis was carried out in the absorbance mode at 237 nm. The Rf values found to be 0.23 ± 0.02 and 0.74
± 0.02 for AML and LOS respectively. The method was validated in compliance with ICH Guideline for linearity, the limit of detection (LOD), the limit of quantification (LOQ), precision, specificity, accuracy, repeatability, and robustness. Linear regression analysis data for the calibration plots showed good linear relationship over the concentration range of 100-400 ng/spot (r2 = 0.9993) and 500-1750 ng/spot (r2 = 0.9991) for AML and LOS respectively. The LOD and LOQ were 24.46 and 74.14 ng/spot for AML and 10.82 and 32.80 ng/spot for LOS. The recoveries of AML and LOS were found to be 99.48-99.56% and 99.51-99.89% respectively. The drugs were subjected to acidic, alkaline, oxidative, neutral and thermal degradation conditions. The degradation product of Losartan in acidic condition was carried out, and its degradation product is successfully separated and isolated by HPTLC method. Degradation product was identified by using the MS technique.
INTRODUCTION: Amlodipine besylate (AML, Fig. 1), chemically, (RS)-3-ethyl-5-methy-l -2 -(2-amino ethoxymethyl) -4 -(2-chlorophenyl) -1, 4-dihydro -6 -methyl -3, 5- pyridinedi carboxylate benzene sulphonate 1.
QUICK RESPONSE CODE
DOI:
10.13040/IJPSR.0975-8232.10(5).2456-64
The article can be accessed online on
www.ijpsr.com
DOI link: http://dx.doi.org/10.13040/IJPSR.0975-8232.10(5).2456-64
It is a long-acting calcium channel blocker, which is used as an antihypertensive agent. The dose is 5-10 mg once a daily orally 2.
Amlodipine is a dihydropyridine calcium
antagonist (calcium ion antagonist or slow-channel blocker) that inhibits the transmembrane influx of calcium ions into vascular smooth muscle and cardiac muscle, which results in a dilatation of the main coronary and systemic arteries, decreased myocardial contractility, increased blood flow and oxygen delivery to the myocardial tissue, and decreased total peripheral resistance 3, 4.
Keywords:
HPTLC, Amlodipine besylate, Losartan potassium, Stability indicating method development,
Validation, Hypertension Correspondence to Author: Dr. Janhavi R. Rao
Department of Pharmaceutical Chemistry, Bharati Vidyapeeth Deemed University’s, Poona College of Pharmacy, Erandwane, Pune -411038, Maharashtra, India.
[image:1.612.50.299.645.731.2]Losartan potassium chemical name is 2-butyl-4-chloro-1-[[2'-(1H-tetrazol-5-yl) [1, 1'- biphenyl]-4-yl] methbiphenyl]-4-yl]- 1H-imidazole-5 -methanol, mono potassium salt Fig. 2. Losartan is an angiotensin-receptor blocker that may be used alone or with
other agents to treat hypertension. It may also be used as an alternative agent for the treatment of systolic dysfunction, myocardial infarction, coronary artery disease, and heart failure 2, 5.
FIG. 1: CHEMICAL STRUCTURE OF AML FIG. 2: CHEMICAL STRUCTURE OF LOS
Literature survey reveals the availability of several methods for estimation of both AML 6 - 34 and LOS
35 - 47
includes UV, HPLC, LC-MS as alone or in combination with other drugs. However, no stability indicating HPTLC method has been reported for the estimation of AML and LOS in the combined dosage form. Present work emphasizes the quantitative estimation of AML and LOS and their degradation products in the combined dosage form by HPTLC. As compared to the other analytical techniques, HPTLC is the most simple and less time-consuming technique. This technique has an advantage that many parameters can be performed at one time, which is not possible with other analytical techniques.
MATERIALS AND METHODS:
Material: AML and LOS were provided as gift samples by Apotex Pharmaceuticals Pvt. Ltd., Marketed formulation tablets (Repace-A Mfg. by Sun Pharmaceuticals) with a dose of 5 mg Amlodipine besylate and 25mg Losartan potassium were procured from the local market, Pune. Analytical grade solvents and TLC aluminum plates pre-coated with silica gel 60 F254 used for
this study were purchased from Merck Pvt. Ltd., Mumbai.
Equipment: Chromatographic separation of the drug was performed by using TLC aluminium plates pre-coated with silica gel 60 F254 (10 × 10)
with 250 µm thickness. Samples were applied on the plate in the form of bands of width 6 mm using Hamilton microliter syringe (100 µl). Linear ascending development was carried out in 10 × 10 cm twin trough glass chamber (CAMAG) by using
as chloroform: methanol: toluene: acetic acid (5.5:2.5:2:0.05 v/v/v/v) mobile phase. The slit dimension was kept at 5 × 0.45 mm. The optimized chamber saturation time for the mobile phase was 30 min. The length of the chromatogram run was 9 cm. After development plates were air-dried and densitometric scanning was performed on a Camag TLC Scanner equipped with winCATS software version 1.4.4.6337 at 237 nm. The source of radiation utilized was a deuterium lamp.
Method Development:
Preparation of the Standard Stock Solution I: An accurately weighed 10 mg of AML, and 10 mg of LOS were transferred to 10 ml volumetric flasks, and the volume was made up to the mark with methanol, to get standard stock solution of AML A1 (1000 μg/mL) and Losartan L1 (1000 μg/mL) respectively.
Preparation of the Working Standard Solution: 1 ml of standard stock solution of A1 (1000 μg/mL) was diluted with 10 ml methanol to get working standard solution of AML (A2) 100 μg/mL. 5 ml of the standard solution of L1 (1000 μg/mL) was diluted with 10 ml methanol to get 500 μg/mL working standard solution of LOS (L2).
Optimization of Chromatographic Method: The major objective in developing this stability indicating HPTLC method is to achieve the resolution of AML and LOS and its degradation products.
FIG. 3: REPRESENTATIVE DENSITOGRAM OF
AMLODIPINE BESYLATE AND LOSARTAN
POTASSIUM BY HPTLC METHOD
The separation was achieved by linear ascending development in 10 cm × 10 cm twin trough glass chamber using chloroform: methanol: toluene: acetic acid (5.5: 2.5: 2: 0.05 v/v/v/v) as mobile phase and detection was carried out at 237 nm. The retention factors were found to be 0.24 ± 0.02 and 0.73 ± 0.02 for AML and LOS respectively.
Representative densitograms of a mixed standard solution of AML and LOS is shown in Fig. 3. Validation of Analytical Methods: The method was validated as per the ICH guideline 48, 49, 50, 51 for linearity, precision, accuracy, the limit of detection (LOD), the limit of quantification (LOQ), robustness and specificity.
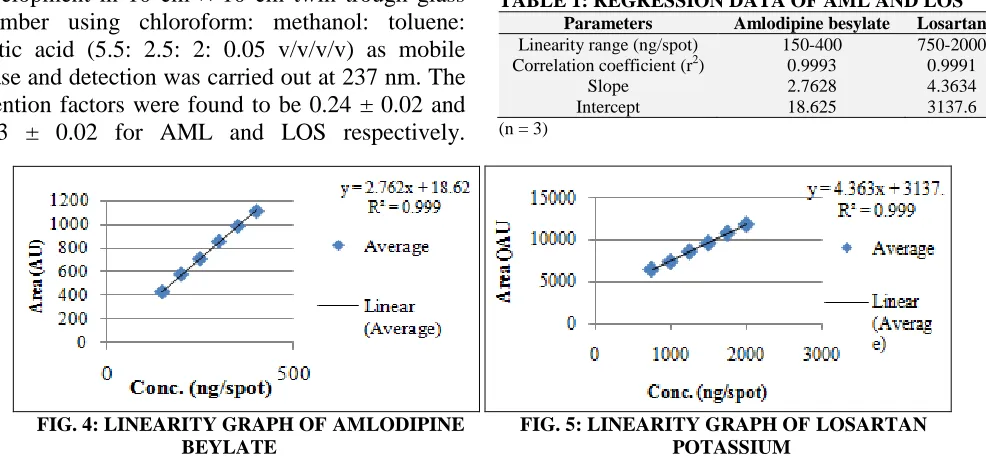
Linearity: The Mixed standard solution (M) containing Amlodipine besylate (100 μg/mL) and Losartan potassium 500 μg/mL was applied on TLC plate in a range of 1.5, 2, 2.5, 3, 3.5 and 4 µl. The linear regression data for calibration curves (n = 3) showed a good linear relationship over a concentration range of 150-400 ng/spot for AML and 750-2000 ng/spot for LOS. The calibration curves were developed by plotting peak areas vs.
[image:3.612.47.301.132.291.2]concentrations shown in Table 1 and Fig 4 and 5.
TABLE 1: REGRESSION DATA OF AML AND LOS Parameters Amlodipine besylate Losartan
Linearity range (ng/spot) 150-400 750-2000
Correlation coefficient (r2) 0.9993 0.9991
Slope 2.7628 4.3634
Intercept 18.625 3137.6
(n = 3)
FIG. 4: LINEARITY GRAPH OFAMLODIPINE FIG. 5: LINEARITY GRAPH OFLOSARTAN BEYLATE POTASSIUM
[image:3.612.65.558.325.556.2]Precision: The precision of the method was demonstrated by intraday precision and inter-day precision studies. Intra-day precision was deter-mined by applying 3 spots of 2.5, 3 and 3.5 μl of mixed standard solution (M) on TLC plate for three times with different time intervals on the same day.
TABLE 2: INTRA-DAY PRECISION
Drug Conc. (ng/spot) Avg. Area % RSD
AML
250 796.7 0.74
300 896.26 0.90
350 1038.38 1.18
LOS
1450 8090.86 0.18
1500 8935.63 0.34
1550 9714.7 0.58
% RSD = Relative Standard deviation (n=3)
Inter-day precision was determined by applying 3 spots of 2.5,3 and 3.5 μl of mixed standard solution (M) on the TLC plate within three consecutive days. The percentage of RSD was calculated. The results obtained are shown in Table 2 and 3.
TABLE 3: INTER-DAY PRECISION
Drug Conc. (ng/spot) Avg. Area % RSD
AML
250 749.43 1.18
300 879.6 1.31
350 1095.5 1.24
LOS
1450 8054.63 0.33
1500 8882.3 0.25
1550 9771.2 1.02
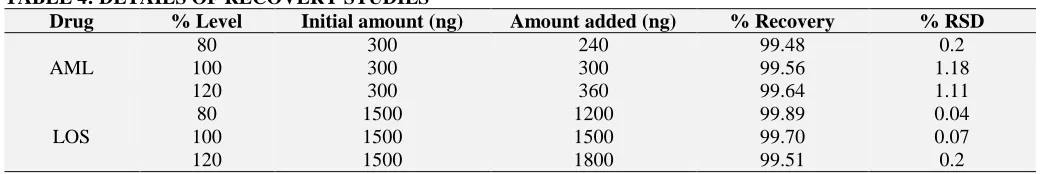
[image:3.612.49.299.662.739.2]Recovery Study: Accuracy of the method was determined by applying the method to the drug sample AML 5 mg and LOS 25 mg combination tablet (REPACE-A) to which a known amount of Amlodipine besylate and Losartan potassium
[image:4.612.46.567.141.228.2]standard drug corresponding to 80, 100 and 120% of label claim have been added. The recovery was carried out by standard addition method. Percentage recoveries were calculated given in Table 4.
TABLE 4: DETAILS OF RECOVERY STUDIES
Drug % Level Initial amount (ng) Amount added (ng) % Recovery % RSD
AML
80 300 240 99.48 0.2
100 300 300 99.56 1.18
120 300 360 99.64 1.11
LOS
80 1500 1200 99.89 0.04
100 1500 1500 99.70 0.07
120 1500 1800 99.51 0.2
Limit of Detection (LOD) and Limit of Quantitation (LOQ): LOD and LOQ of both drugs were calculated by using the signal-to-noise ratio following equations as per ICH guideline. Values were given in Table 5.
TABLE 5: LOD AND LOQ DETAILS OF AML AND LOS
Drug LOD (ng/spot) LOQ (ng/spot)
AML 24.46 74.14
LOS 10.82 32.80
LOD: Limit of Detection, LOQ: Limit of Quantitation
LOD = 3.3 × σ / S and LOQ = 10 × σ / S
Where, σ = the standard deviation of the response. S = slope of the calibration curve.
Robustness: The robustness of the method was assessed by making small, deliberate changes in optimized condition like mobile phase composition ± 0.5 ml; wavelength ± 10 nm and saturation time ±10 min. percentage RSD was calculated given in Table 6 and Table 7.
TABLE 6: ROBUSTNESS DETAILS OF AML
Condition Rf Peak Area %RSD
Mobile Phase Composition (± 0.5 ml Toluene)
Toluene: Methanol: Chloroform: Acetic Acid (1.5:2.5:5.5:0.05 v/v/v/v) 0.24 746.3 1.62 Toluene: Methanol: Chloroform: Acetic Acid (2:2.5:5.5:0.05 v/v/v/v) 0.25 742.86
Toluene: Methanol: Chloroform: Acetic Acid (2.5:2.5:5.5:0.05 v/v/v/v) 0.26 746.3 Wavelength (± 10 nm)
227 nm 0.23 751.23 0.40
237 nm 0.23 746.2
247 nm 0.24 738.4
Duration of Saturation (± 10 min)
25 0.23 740.9 1.4
30 0.24 746.2
35 0.25 751.5
Rf: Retention factor, % RSD: Relative Standard Deviation
TABLE 7: ROBUSTNESS DETAILS OF LOS
Condition Rf Peak Area %RSD
Mobile Phase Composition (± 0.5ml methanol )
Toluene: Methanol: Chloroform: Acetic Acid (1.5:2.5:5.5:0.05 v/v/v/v) 0.73 9834.5 0.95 Toluene: Methanol: Chloroform: Acetic Acid (2:2.5:5.5:0.05 v/v/v/v) 0.73 9819.4
Toluene: Methanol: Chloroform: Acetic Acid (2.5:2.5:5.5:0.05 v/v/v/v) 0.74 10007.5 Wavelength (± 10 nm)
247nm 0.73 9839.7 0.70
237nm 0.73 9819.4
257nm 0.74 9954.56
Duration of Saturation (± 10 min)
20 0.72 10762.8 0.89
30 0.73 9852.73
40 0.73 10366.9
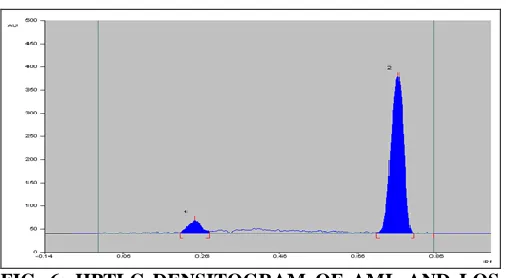
Assay: To determine the content of Amlodipine besylate and Losartan potassium in tablets (containing 5 mg Amlodipine besylate and 25 mg Losartan potassium), 20 tablets were weighed accurately, crushed and average weight was calculated. The amount equivalent to 1 tablet was taken and dissolved and diluted up to the mark in with methanol to obtain a concentration equivalent to 100 μg/mL Amlodipine besylate and 500 μg/mL Losartan potassium. 3 μl spot of mixed standard solution, M (Amlodipine besylate 100 μg/mL and Losartan potassium 500 μg/mL) and marketed formulation solution were spotted on TLC plate. The plate was dried and scanned at 237 nm using Camagwin software version 1.4.4.6337. The dendrograms recorded are shown in Fig. 6
FIG. 6: HPTLC DENSITOGRAM OF AML AND LOS IN TABLET FORMULATION
Forced Degradation Studies: Forced degradation study was performed to ensure that the degradation products generated due to stress condition are not interfering with the API peak. API and drug product should be forcefully stressed by treating with acid, alkali, hydrolysis, photolysis and oxidizing agent by controlling stress agent concentration and exposure time to achieve degradation about 10-30%.
Preparation of Acid Induced Degradation Product: A 5 ml of mixed standard solution M (AML 100 μg/mL and LOS 500 μg/mL) and 5 ml of 0.1N HCl was kept at room temperature for 3 h. 3µl of the resulting solution was applied on TLC plates to get concentration equivalent to 300 ng/spot of AML and 1500 ng/spot of LOS and the plate was run with the mobile phase, dried and scanned at 237 nm The representative densitogram after Acid-induced degradation is shown in Fig. 7. Preparation of Base Induced Degradation Product: A 5 ml of mixed standard solution M
(AML 100 μg/mL and LOS 500 μg/mL) and 5 ml of 0.1N NaOH was kept at room temperature for 3 h. 3 µl of the resulting solution was applied on TLC plates to get concentration equivalent to 300 ng/spot of AML and 1500 ng/spot of LOS and the plate was run with the mobile phase, dried and scanned at 237 nm The representative densitograms after Base induced degradation is shown in Fig. 8. Preparation of Hydrogen Peroxide-Induced Degradation Product: A 5 ml of mixed standard solution M (AML 100 μg/mL and LOS 500 μg/mL) and 5 ml of 3% hydrogen peroxide was kept at room temperature for 3 h. 3 µl of the resulting solution was applied on TLC plates to get concentration equivalent to 300 ng/spot of AML and 1500 ng/spot of LOS and the plate was run with the mobile phase, dried and scanned at 237 nm. The representative densitograms after Base induced degradation is shown in Fig. 9.
Preparation of Neutral Induced Degradation Product: A 5 ml of mixed standard solution M (AML 100 μg/mL and LOS 500 μg/mL) and 5 ml distill was kept at room temperature for 3 h. 3ul of the resulting solution was applied on TLC plates to get concentration equivalent to 300 ng/spot of AML and 1500 ng/spot of LOS and the plate was run with the mobile phase, dried and scanned at 237 nm. The representative densitograms after Neutral induced degradation is shown in Fig. 10. Preparation of Thermal Induced Degradation Product: 30 mg of Amlodipine besylate and 150 mg of Losartan potassium powder was mixed and put in a petri dish. Petri dish was kept in a hot air oven at 60 ºC. A powdered sample of 30 mg was withdrawn after 30 min, 1h, 2h, 3h, and 4h intervals. Spot of mixed standard solution, M (Amlodipine besylate 500 μg/mL and Losartan potassium 5 μg/mL) and the resultant degraded solution was applied on TLC plate, and the plate was run with the mobile phase. The plate was dried and scanned at 237 nm using Camagwin software version 1.4.4.6337 and densitograms were recorded in Fig. 11.
[image:5.612.48.301.281.420.2]The resulted solution was refluxed in a round bottom flask on a temperature controlled precision water bath at 70 °C for 3.0 h. The acid degradation of the LOS was confirmed by newly developed HPTLC method, where the major degradant formed in alkaline stressed condition was isolated through preparative HPTLC technique. Working standard of LOS and isolated degradant was further
subjected to Mass spectral studies. Mass spectral data provided the information regarding the molecular weight of the compound. The peak area was determined, and quantitative estimation of LOS and degradant formed in acid-stressed condition was carried out from the corresponding regression equation.
FIG. 7: ACID DEGRADATION OF AML AND LOS FIG. 8: BASE DEGRADATION OF AML AND LOS
FIG. 9: HYDROGEN PEROXIDE DEGRADATION OF FIG 10: NEUTRAL DEGRADATION OF AML AND LOS AML AND LOS
FIG. 11: THERMAL DEGRADATION OF AML AND LOS ISOLATION OF ACID DEGRADATION PRODUCT OF LOSARTAN
RESULTS AND DISCUSSION: The developed HPTLC method was validated as per ICH guidelines. The developed method found to be linear within the range of 100-400 ng/spot (r2 = 0.9993) and 500-1750 ng/spot (r2 = 0.9991) for AML and LOS respectively. The accuracy of the method was determined at 80%, 100%, 120% level.
The % recoveries of AML and LOS were found to be 99.48-99.56% and 99.51-99.89% respectively. The LOD and LOQ of AML were found to be 24.46, and 74.14 ng/spot and the LOD and LOQ of LOS was found to be 10.82 and 32.80 ng/spot. The developed method was found to be precise as the % RSD values for intra-day and inter-day were found to be less than 2%. The method was also found to be robustness indicated by the % RSD values which are less than 2%. The summary of the validation parameters of proposed HPTLC method is shown in Table 8. The stress degradation studies were carried out for the drug in acid, base, oxidation, neutral and thermal conditions.
[image:6.612.45.552.177.626.2]Fig. 12 shows the appearance of molecular ion peak at m/z 422 which indicates the molecular weight of Losartan while the spectral data of acid degradant Fig. 13 characterized by the breaking of
the secondary amine group in imidazole ring from the structure of LOS confirms the appearance of molecular ion peak at m/z 339. The tallest peak in the spectrum appeared at m/z 395.
TABLE 8: SUMMARY OF VALIDATION PARAMETER S.
no.
Validation Parameters
Results
AML Los
1 Linearity Range:150-400
R2: 0.9993 Slope: 2.7628 Intercept: 18.625
Range: 750-2000 R2: 0.9991 Slope: 4.3634 Intercept: 3137.6
2 LOD 24.46 74.14
3 LOQ 10.82 32.80
4 Precision
(% RSD)
Inter-day: 1.18-1.24 Intra-day: 0.2-1.18
Inter-day: 0.25-1.02 Intra-day: 0.18-.58
[image:7.612.42.562.109.736.2]5 Robustness (% RSD) 0.40-1.62 0.70-.095
TABLE 9: SUMMARY OF FORCED DEGRADATION STUDY S.
no.
Degradation Condition
% Degradation Rf of degradants
AML LOS AML LOS
1 Acid - 10.04 - 0.74
2 Base 8.5 13.57 0.07 0.78
3 Oxidation 0.77 4.2 - 0.63
4 Neutral 7.6 1.1 .11 0.59
5 Thermal 13.6 - 0.35 -
Acid Hydrolysis:
FIG. 12: MASS SPECTRA OF LOSERTAN (API) FIG. 13: MASS SPECTRA OF 0.1 N HCl AFTER 3 h
Losartan (Mass - 422 m/z)
[image:7.612.94.521.389.747.2]Further, the major fragments were obtained at m/z 137, and 101 indicates the breakage of the imidazole ring. All predicted structures were satisfied with the double bonds, N-atom, and ring present in structure. The major degradation product and fragmentation of Losartan were obtained according to the suggested mechanism for the acid degradation process as indicated in Fig 14. From functional group and mass spectral data, Acid hydrolysis sample of Losartan was found major two degradant which 1-chloro-1-[[2'-(1H- tetrazol-5-yl) [1, 1'-biphenyl]-4-yl] methyl] -5-methanol of degradant 1 and 2-hexyleneimine of degradant 2.
CONCLUSION: A simple, specific, precise and accurate HPTLC method has been established as stability indicating a method for simultaneous estimation of AML and LOS respectively in bulk and in their pharmaceutical dosage form. ICH guidelines were followed throughout the study for method validation and stress testing. Developed HPTLC method effectively separate principle drug peak from degradation product peaks; it can be employed as stability indicating method.
ACKNOWLEDGEMENT: The authors are thankful to Bharati Vidyapeeth University’s Poona College of Pharmacy, Pune, India, for providing necessary facilities. The authors are also thankful to Apotex Pharmaceuticals, Pune for providing the gift sample of standard AML and LOS respectively.
CONFLICT OF INTEREST: Nil REFERENCES:
1. Indian Pharmacopoeia: Vol. II, 2007: 96-98.
2. Sharma HL and Sharmaa KK: Principles of pharmacology, Edition 2nd, 259-270.
3. Hoffman BB. Therapy of Hypertension. Goodman and Gilman’s Pharmacological Basis of Therapeutics. New York: McGraw-Hill Professional, Edition 11th, 2006: 845-68
4. Budavari S: The Merck Index. Whitehouse Station, NJ, USA: Merck and Co. Inc., Edition 13th, 2001: 86.
5. Indian Pharmacopeoia: Vol. II, 2007: 701-703.
6. Ilango K: Simple and rapid HPTLC estimation of Amlodipine from the pharmaceutical dosage form. Indian Journal of Pharmaceutical Sciences 1997; 336-37. 7. Bhide N: LC-UV method development & validation of
Amlodipine in pure and tablet dosage form. Research J of Pharmaceutical Sciences 2016; 5(2): 1-3.
8. Saha R: Development and validation of an HPLC
analytical assay method for Amlodipine besylate tablets: A Potent Ca+2 channel blocker. Journal of Advanced Pharmacy Education & Research 2012; 2(3): 93-00.
9. Shah SK: Simultaneous quantitative analysis of
Olmesartan medoxomil and Amlodipine besylate in
plasma by HPTLC technique. European J of
Pharmaceutical and Medical Research 2016; 3(9): 410-15. 10. Inamdar N: Analytical method development for estimation
of s (-) Amlodipine besylate & Olmesartan medoxomil by UV spectroscopy. Int J of Biological & Pharmaceutical Research 2015; 6(5): 400-05.
11. Wankhede SB: Simultaneous estimation of Amlodipine besylate and Olmesartan medoxomil in the pharmaceutical dosage form. Indian Journal of Pharmaceutical Sciences 2009; 71(5): 563-7.
12. Qutab SS: Simultaneous quantitation of Olmesartan medoxomil and Amlodipine besylate in combined tablets using HPLC. J Chil Chem Soc 2009; 54(3): 234-37. 13. Mundra G: Simultaneous estimation of Amlodipine
besylate and Olmesartan medoxomil in combined tablet dosage form using UV-Spectroscopy and RP-HPLC method. International Journal of Biomedical and Pharmaceutical Sciences 2011; 5(1): 49-52.
14. Kumar SA: A new and rapid analytical method
development & validation for simultaneous estimation of Hydrochlorothiazide, Amlodipine & Olmesartan in tablet dosage form by using RP-HPLC. Journal of Chemical and Pharmaceutical Research 2014; 6(5): 1208-13.
15. Rao JR: Simultaneous quantitation of Olmesartan medoxomil, Amlodipine besylate and Hydrochlorothiazide in Pharmaceutical dosage form by using HPLC. Int J Pharm Tech Res 2011; 3(3): 1435-40.
16. Darwis HW: Sequential spectrophotometric method for the simultaneous determination of Amlodipine, Valsartan, and Hydrochlorothiazide in co-formulated tablets. International Journal of Spectroscopy 2013; 8.
17. Shaikh MM: Development and validation of an rp-hplc method for simultaneous estimation of amlodipine besylate and irbesartan, International Bulletin of Drug Research 2014; 4(7): 1-15.
18. Haque MA: Development and validation of RP-HPLC method for the simultaneous estimation of atenolol and amlodipine in tablet dosage form, Dhaka Univ J Pharm Sci 2010; 9(2): 131-138.
19. Bindu M: Method development and validation of
simultaneous estimation of amlodipine and candesartan by reverse phase hplc in tablet dosage forms, Indo American Journal of Pharmaceutical Research 2014; 4(10): 3923-28.
20. Mhaske RA: RP-HPLC method for simultaneous
determination of amlodipine besylate,valsartan,
telmisartan, hydrochlorothiazide and chlorthalidone: application to commercially available drug products. IJPSR 2012; 3(1): 141-149.
21. Vasantharaju SG: Analytical method development and validation of simultaneous estimation of amlodipine and
atorvastatin by RP-UPLC. Mintage Journal of
Pharmaceutical & Medical Sciences 2014; 3(2): 22-25. 22. Rambabu C: Development and validation of rphplc
method for simultaneous estimation of amlodipine besylate and benazepril hcl in tablet dosage from. Int J Curr Pharm 2012; 4(3): 80-84.
23. Rajput PS: Simultaneous estimation of ramipril and amlodipine in bulk and tablet dosage form by Rp-Hplc method, Journal of Applied Pharmaceutical Science 2012; 2(07); 160-165.
24. UPLCMS method development and validation of
25. Jena A: Analytical method development and validation of simultaneous determination of atorvastatin calcium and amlodipine besilate in tablet dosage form by RP-HPLC. IJPSR 2010; 1(11): 100-106.
26. Ashou S: A Validated Stability-Indicating Liquid
Chromatographic Method for the Simultaneous
Determination of Amlodipine and Benazepril in Capsules Dosage, Form. Canadian Chemical Transactions Year 2014; 2(4): 418-33.
27. Safeer K: Analytical method development and validation of amlodipine and hydrochlorothiazide in combined dosage form by RP-HPLC. International Journal of Chem Tech Research 2010; 2(1): 21.
28. Ahmed M: RP-HPLC method development and validation
for Simultaneous estimation of Atorvastatin calcium and Amlodipine besylate, Chem Tech Res 2012; 4(1) 337-345. 29. Rao NM: Development and validation of HPTLC method
for the simultaneous estimation of amlodipine besylate and atorvastatin calcium combined dosage form. Eurasian Journal of Analytical Chemistry 2016; 11(3): 155-68. 30. Ghodke D: Method development and validation of
amlodipine besylate and hydrochlorothiazide in their bulk and combined dosage form. Der Pharmacia Lettre 2015; 7(6): 220-24.
31. Tengli AR: Method for simultaneous estimation of
aliskiren hemifumarate, amlodipine besylate and
hydrochlorothiazide in bulk and pharmaceutical dosage forms. IOSR-JPBS 2014; 9(1): 114-23.
32. Rajeswari KR: RP-HPLC method for the simultaneous method for the simultaneous determination of atorvastatin (ATV) and tablet dosage. Indian J Pharm Sci 2006; 68(2): 275-77.
33. Das P: Simultaneous estimation of aliskiren and amlodipine in tablet dosage form by UV spectroscopy. Int. J Drug Dev & Res 2012; 4(2): 265-70.
34. Chabukswar AR Simultaneous HPTLC estimation of
Telmisartan (TEL) and Amlodipine Besylate in tablet dosage form. Arch Apll Sci Res 2010; 2(3): 94-100 35. Naveed S: Analytical method for estimation of losartan by
using UV spectrophotometer. IOSR-JAC 2014; 6(5): 72-77.
36. Shinde A: Development and validation of reverse phase liquid chromatography method for estimation of losartan in bulk drug. IOSR-JAC 2014; 6(5): 72-77.
37. Rathee P: Indicating UV spectrophotometric method for the estimation of losartan potassium in bulk and tablet dosage form. 2008; 1(2): 188-92.
38. Kaur U and Mintage JR: Development and validation of RP-HPLC method for the simultaneous estimation of
amlodipine besylate, losartan potassium and
hydrochlorothiazide in tablet dosage. Journal of Pharmaceutical and Medical Devices 2014; 3(3): 31-35. 39. Yadav S: RP-HPLC method for simultaneous estimation
of losartan, hydrochlorothiazide and amlodipine in tablet dosage form. Asian J Pharm Clin Res 2014; 7(1): 137-40. 40. Rao J: Analytical method development and validation of
losartan potassium and hydrochlorothiazide in combined dosage form by RP-HPLC. Int J Chemtech Res 2013; 5(6): 3007-14.
41. Meenala: Reverse phase high‑performance liquid
chromatography method for simultaneous estimation of atenolol, hydrochlorothiazide and losartan in bulk and pharmaceutical dosage form. Asian J Pharm Clin Res 2016; 9(2): 118-24.
42. Haritha P: Stability indicating RP-HPLC method for
simultaneous estimation of hydrochlorothiazide,
amlodipine besylate and losartan potassium in bulk and tablet dosage form , Int J Chem Sci 2016; 14(1): 335-3. 43. Lalitha KV: UV spectrophotometric method development
and validation for the determination of atenolol and losartan potassium by Q-analysis. International Bulletin of Drug Research 2013; 3(4): 54-62.
44. Sharma R: RP-HPLC method for simultaneous estimation of atenolol, hydrochlorothiazide and losarton in tablet dosage form. Chem Sci Trans 2013; 2(s1): s1-s6.
45. Bodiwala KB: Estimation of losartan potassium and ramipril in their combined dosage form by validated hptlc method. Eurasian Jou of Analytical Chem 2017; 12(3): 8. 46. Kaur G: Development and validation of stability indicating
analytical method for simultaneous estimation of perindopril and losartan potassium in their combined marketed dosage form. J Pharm Sci Bioscientific Res 2016; 6(4): 542-46.
47. Kollipara S: Stability-indicating reversed-phase liquid chromatographic method for simultaneous determination of losartan potassium and ramipril in tablets. Indian Journal of Pharmaceutical Sciences 2012; 74(3): 201-10. 48. ICH Q2A: Text on validation of analytical procedure:
International conference on harmonization; Geneva 1994; 1-5.
49. ICH Q2B: Validation of analytical procedure;
methodology; International conference on harmonization; Geneva 1996; 1-8.
50. ICH Q1B: Photostability Testing of New Drug Substances and Products 1996; 1-12.
51. International Conference on Harmonization Q1A (R2). Stability Testing of New Drug Substances and Products 1996; 1-24.
All © 2013 are reserved by International Journal of Pharmaceutical Sciences and Research. This Journal licensed under a Creative Commons Attribution-NonCommercial-ShareAlike 3.0 Unported License.
This article can be downloaded to Android OS based mobile. Scan QR Code using Code/Bar Scanner from your mobile. (Scanners are available on Google Play store)
How to cite this article: