IJPSR (2019), Volume 10, Issue 5 (Research Article)
Received on 31 August 2018; received in revised form, 10 October 2018; accepted, 12 October 2018; published 01 May 2019
FORMULATION AND EVALUATION OF TRANSDERMAL PATCH FOR TREATMENT OF INFLAMMATION
A. Kharia * 1, R. Gilhotra 1 and A. K. Singhai 2
Suresh Gyan Vihar University 1, Jaipur - 302017, Rajasthan, India.
Lakshmi Narain College of Pharmacy 2, Bhopal - 474006, Madhya Pradesh, India.
ABSTRACT: Background: Quercetin is one of the important bioflavonoids present in more than twenty plants material and which is known for its anti-inflammatory, antihypertensive, vasodilator effects, antiobesity, antihyper-cholesterolemic and antiatherosclerotic activities. Free-radical is one of the key factors for the development of diseases such as hypertension, vascular disorders, and metabolic syndrome. The objective of this study was to develop a transdermal drug delivery system for Quercetin as a once-daily dosage form. Methods: Transdermal patches were prepared by solvent casting technique employing controlled release grades of HPMC and ethyl cellulose in the presence of plasticizer PEG. Standard procedures were used to analyze the prepared films for various physicochemical parameters, drug release (Franz diffusion cell) and skin irritation test. Results: The formulations were uniform in their physical characteristics with low water vapor absorption, uniformity in patch characteristics. The patches were devoid of hypersensitivity reactions on rat skin. The in-vitro release of formulation Q1, Q2, Q3, Q4, Q5 & Q6 has shown the release of about 57.02%, 52.66%, 85.77%, 74.78%, 64.27%, and 48.08% at 24 h and respectively. The order of drug release was found to be Q3>Q4>Q5> Q1>Q2>Q6. Anti-inflammatory activity by Carrageenan induced Paw edema model formulation code Q3 reduced the paw edema in a 4th hour to 0.24 ± 0.020 which was found to be highly significant when compared to control 0.69 ± 0.069 and standard Nu Patch 200 mg, i.e. 0.20 ± 0.024. In Xylene induced mouse ear edema model formulation code Q3 showed 31.16 (% edema) which was found significant to when compared to controlled 88.15 (% edema).
INTRODUCTION: Transdermal drug delivery systems (TDDSs) can be defined as self-contained discrete dosage forms which, when applied to the intact skin, deliver the drug(s) through the skin portal at a predetermined and reproducible rate into the systemic circulation over a prolonged period 1, 2, 3
.
QUICK RESPONSE CODE
DOI:
10.13040/IJPSR.0975-8232.10(5).2375-84
The article can be accessed online on www.ijpsr.com
DOI link: http://dx.doi.org/10.13040/IJPSR.0975-8232.10(5).2375-84
The goal of dosage design for transdermal products is to maximize the flux through the skin into the systemic circulation and simultaneously minimize the retention and metabolism of the drug in the skin. Transdermal delivery provides a leading edge over injectable and oral routes by increasing patient compliance and avoiding first-pass metabolism, respectively 4.
The market share for transdermal delivery was $12.7 billion in the year 2005, which rose to $21.5 billion in the year 2010 and is expected to increase to $31.5 billion in the year 2015. In the recent past, several innovative technologies have come up in an attempt to enhance transdermal drug delivery for
Keywords:
Inflammation, Quercetin, Transdermal Patch
Correspondence to Author: A. Kharia
Research Scholar,
Suresh Gyan Vihar University, Jaipur - 302017, Rajasthan, India.
therapeutic and diagnostic purposes for targeting the delivery of the drugs to specific tissues 5, 6. The formulation of drugs into a transdermal drug delivery system requires a selection of physicochemical and biological properties 7, 8.
MATERIALS AND METHODS:
Selection of Drug: Quercetin is one of the most abundant natural flavonoids and was selected for the preparation of transdermal patch.
Preformulation Studies of Drug: It includes Identification, Melting point, calibration curve, Fourier Transform Infra-Red analysis, Solubility Studies, Partition coefficient, thin layer chromatography,and Drug- Excipient Interaction.
Identification of Drug:
Organoleptic Properties: Organoleptic
characteristics of the drug on following parameters Color, Odor, Taste, and State.
Melting Point: Melting point determination of quercetin was done by using Melting Point Apparatus.
UV Absorption Maxima: The identification of drug was done by UV spectrophotometric method. From the spectra, λmax of quercetin was observed at 256 nm. The spectral data from this scan was used for the preparation of a calibration curve of quercetin 9.
Fourier Transform Infra-Red Analysis: The FTIR analysis of the sample was carried out for compound identification (FTIR-8400S Shimadzu). The powdered drug was placed carefully over sample holder ensuring no air entrapment; after that the sample was scanned.
Solubility: The solubility analysis for Quercetin was done by solubility determination in different solvents like Ethanol, Methanol, Water, PBS (pH 7.2), Methanol: PBS pH 7.4 (05: 95), Methanοl: PBS pH 7.4 (10:90), Methanol: PBS pH 7.4 (20:80).
Partition Coefficient: Partition coefficient determination of quercetin was done by simple Shaking Flask method. 10 mg. of the drug was dissolved in 10 ml. of phosphate buffer pH 7.2 system and 10 ml. of octanol in separating funnel.
It was shaken well for 24 h by orbital shaker then allowed to stand for complete phase separation. The concentration of drug was measured by UV spectrophotometric method. The remaining conc. of the sample in the water phase was calculated by deduction from the total amount of drug 10.
Po/w = Coil/Cwater
Calibration of Quercetin: Standard stock solution of quercetin was prepared by dissolving 100 mg drug in 100 ml methanol (i.e., 1000μg/mL) and Methanοl: PBS pH 7.4 (20: 80). An aliquot of desired concentration was prepared. The linearity was observed in the concentration range of 0.5-1.5 μg/mL for quercetin. The absorptivity coefficient of the drug at the desired wavelengths was determined.
Drug- Excipients Compatibility Studies:
A. A small amount of drug substance with an excipient that is, physical mixture of the drug and excipient (in 1:1 ratio were prepared to have maximum likelihood interaction between them) was placed in a vial, and rubber stopper was placed on the vial and sealed properly. A storage period of 2 weeks at 60 °C and the same sample was retained for 2 months at 40 °C. After storage, the sample was observed physically for liquefaction, caking, odor or gas formation, discoloration 11.
B. The drug-excipient interaction study was performed using Silica gel-coated TLC (Thin Layer Chromatography) plates and a mixture of Chloroform: Methanol (9.5: 0.5). The TLC plates were prepared using a slurry of Silica gel -G. The prepared plates were activated at 110 °C for 15 min. On the activated plates, spots of each solution in methanol containing (a) Quercetin and (b) Quercetin containing a different experimental ratio of excipients, were applied. The Rf values were calculated from the chromatogram obtained and compared with the Rf values of quercetin alone 12.
Formulation Development of Medicated Transdermal Patch:
Then Eugenol and Linseed oil were added as a permeation enhancer, Polyethylene glycol used as plasticizer and Menthol as Counter irritant were added in the polymeric solution, mixed thoroughly using the magnetic stirrer. To the above solution Quercetin, was added and poured in Petri dish. It was covered with a funnel in an inverted position. The solvent was allowed to evaporate at ambient conditions for 24 h. The patches were then covered with backing membrane cut into appropriate sizes, packed in aluminum foil and stored in desiccators. The so prepared films stuck to the adhesive layer of bandage which was purchased from the local market.
TABLE 1: DIFFERENT FORMULATIONS OF
TRANSDERMAL PATCH
Formulation Q1 Q2 Q3 Q4 Q5 Q6
Quercetin (mg) 18 18 18 18 18 18 HPMC (mg) 25 50 75 100 125 150 Ethyl Cellulose(mg) 150 125 100 75 50 25
Eugenol (ml) 0.5 0.5 0.5 0.5 0.5 0.5 Menthol (ml) 5% 5% 5% 5% 5% 5% Linseed oil (ml) 3% 3% 3% 3% 3% 3% Poly Ethylene Glycol 3% 3% 3% 3% 3% 3% Solvent Q.S Q.S Q.S Q.S Q.S Q.S
Evaluation of Transdermal Patches: The physical parameters such as thickness, weight variation, folding endurance of various films were determined.
Physical Appearance: All the prepared patches were visually inspected for color, clarity, flexibility, and smoothness.
Weight Variation: Uniformity of weight was determined by weighing five matrices of each formulation. Each film unit was weighed individually on a digital balance, the average weight of film was taken as the weight of the film.
Thickness Uniformity: The thickness of the films was determined by measuring the thickness at five sites on three films of each formulation using digital Vernier calipers and the average was calculated.
Folding Endurance: The folding endurance is expressed as the number of films folded at the same place to break the specimen or to develop visible cracks. Three films of each formulation of size were cut by using a sharp blade. The mean value of triplicate and standard deviation were calculated 13.
Flatness: A transdermal patch should possess a smooth surface and should not constrict with time. This can be demonstrated with flatness study. For flatness determination, one strip is cut from the center and two from each side of patches. Zero percent constriction is equivalent to 100 percent flatness.
% constriction = (L1-L2) × 100 / L1
L2 = Final length of each strip L1 = Initial length of each strip
Surface pH Determination: For the determination of surface pH of the patch a small area of the film was cut and was allowed to swell by keeping it in distilled water for 1 h in glass tubes. The surface pH was then noted by bringing a combined glass electrode near the surface of the film and allowing it to equilibrate for 1 min.
Water Vapor Absorption: The percent moisture absorption test was carried out to check the physical stability and integrity of the films in high humid conditions. The prepared films (3.14 cm2) were individually weighed accurately and exposed to 85 ± 5% relative humidity in a desiccator containing 100 ml of a saturated solution of potassium chloride at room temperature. During this period, the films were weighed at regular time intervals of 24, 48, and 72 h. The percent moisture absorption was determined from the following formula:
% moisture uptake = (Final weight - Initial weight) × 100 / Initial weight
In-vitro Permeation Studies: An in-vitro
The isolated rat skin piece was mounted between the compartments of the diffusion cell, with the epidermis facing upward into the donor compartment. A sample volume of 5 mL was removed from the receptor compartment at regular intervals, and an equal volume of fresh medium was replaced. Samples were filtered through Whatman filters and were analyzed using
Shimadzu UV 1800 double-beam
spectro-photometer (Shimadzu, Kyoto, Japan). Flux was determined directly as the slope of the curve between the steady-state values of the amount of drug permeated (mg∗cm2) versus time in hours and permeability coefficient was deduced by dividing the flux by the initial drug load (mg∗cm2).
Preliminary Pharmacological Screening: The Pharmacology Screening was performed in Modern Institute of Pharmaceutical Sciences approved by
CPCSEA (Approval no. 1509/PO/RE/S/11
CPCSEA).
Acute Dermal Toxicity Study: Healthy young albino rats, were used as the experimental animals were acclimatized to the laboratory conditions for at least 5 days before the test, according to Acute dermal toxicity, Section no. 402. Before the test, animals were randomized and assigned to the treatment groups. Approximately 24 h before the test, fur was removed from the dorsal area of the trunk of the test animals by clipping or shaving. Care was taken to avoid abrading the skin. Different formulations of a transdermal patch, as the test substance, were applied to an area of skin. The patch was loosely held in contact with the skin for 4 h and was then removed. Observations were recorded an hour after the removal of the patch. No clinical signs of dermal toxicity were observed in any of the animals treated with the test substance upon repeated application of the transdermal patch for up to 28 days (Acute dermal toxicity, 402).
Anti-Inflammatory Activity by Carrageenan-Induced Rat Paw Edema Method: Anti-inflammatory activity was assessed by the method described by (Winter et al., 1962). Albino rats of either sex weighing 200 –250 gm were divided into 8 groups (n=6). Group-I received 0.5% CMC suspension (control), Group- II, III and IV, V, VI, VII applied a transdermal patch of different formulation Q1, Q2, Q3, Q4, Q5, and Q6
respectively at abdominal region after depilating the abdominal region. Group- VIII standard group NU Patch 200 mg. Animals were treated with transdermal patch and subsequently 1 h after treatment. 0.1ml of 1% suspension of carrageenan in normal saline was injected into the sub-planter region of the left hind paw to induce edema. The paw volume was measured initially at 0, 1, 2, 3 and 4hr after carrageenan injection using digital paw edema meter.
The inhibition of inflammation was calculated using the formula,
% inhibition = 100 (1-Vt/Vc)
Where ‘Vc’ represents edema volume in control and ‘Vt’ edema volume in the group treated with test extracts.
Anti-inflammatory Activity by Xylene Induced Mouse Ear Edema Model: The effect of different transdermal patch on acute edema was assessed by using xylene-induced ear edema in mice. Male Swiss albino mice weighing 18-27 g were divided into 8 groups (n=6). Group-I received 0.5% CMC suspension (control), Group- II, III and IV, V, VI, VII applied a transdermal patch of different formulation Q1, Q2, Q3, Q4, Q5, and Q6. Group-VIII standard group have applied the patch of NU Patch 200 mg. One hour after the application of transdermal patch and, 50 ml of Xylene was applied to the anterior and posterior surfaces of the right ear under light ether anesthesia. The left ear was considered as control. Four-hour later xylene application mice were sacrificed by cervical dislocation, and both ears were removed. Ear lobes were punched out in circular disc using a metal punch (6 mm diameter) and weighed. The difference in the weight of discs from the right treated and left untreated ear was calculated and was used as a measure of edema.
The difference in the weight of discs from the right treated and left untreated ears was calculated and used as a measure of edema. The level of inhibition (%) of edema was calculated using the relation:
Inhibition (%) = 100[1-(Et/Ec)]
RESULTS AND DISCUSSION:
Preformulation Studies: The prefοrmulatiοn study was performed to assure the authenticity of sample drug and determination parameters for the development of Transdermal patch.
Identification of Drug:
[image:5.612.313.565.215.347.2]Organoleptic Properties: Organoleptic characteristics of the drug were found within standard limits as shown in Table 2.
TABLE 2: PHYSICAL PROPERTIES OF THE DRUG
S. no. Properties Inference
1 Color Yellowish
2 Odor Odorless
3 Taste Tasteless
4 State Crystalline Powder
Melting Point: The melting point of the drug sample (Quercetin) was fοund to be 316.76 which compared with reported value (310 ºC - 320 ºC) indicated that the drug sample was pure.
TABLE 3: MELTING POINT OF QUERCETIN S. no. Drug Melting Point
(ºC) Literature
Melting Point (ºC) Practical
1 Quercetin 310-320 316.76
UV Absorption Spectra of Quercetin: The maximum absorbance of the drug in methanol was found to be at λmax 256 nm which is matched with reference indicated that the drug sample was pure.
FIG. 1: ULTRAVIOLET ABSORPTION MAXIMA OF QUERCETIN
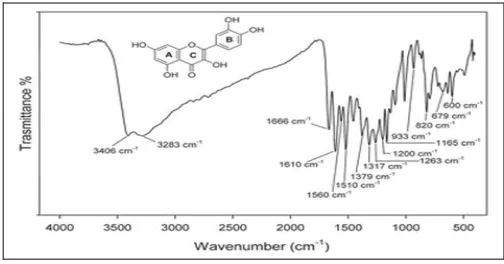
Fourier Transform Infra-Red Analysis: The FTIR analysis of the sample was carried out for compound identification. The powdered drug was placed carefully over sample holder ensuring no air entrapment; thereafter the sample was scanned. The FTIR spectrum for pure quercetin is shown in Fig. 2 where its characteristic bands were detected. OH, groups stretching were detectable at 3406 and 3283 cm−1, whereas OH bending of the phenol function
was detectable at 1379 cm−1. The C=O aryl kenotic stretch absorption was evident at 1666 cm−1. C=C aromatic ring stretch bands were detectable at 1610, 1560, and 1510 cm−1. The in-plane bending band of C–H in aromatic hydrocarbon was detectable at 1317 cm−1, and out-of-plane bending bands were evident at 933, 820, 679, and 600 cm−1. Bands at 1263, 1200, and 1165 cm−1 were attributable to the C–O stretching in the aryl ether ring, the C–O stretching in phenol, and the C–CO– C stretch and bending in ketone, respectively
FIG. 2: INFRARED SPECTRUM IR GRAPH OF DRUG SAMPLE
[image:5.612.48.300.469.591.2]Determination of Solubility: The solubility study revealed that the drug sample was freely sοluble in methanοl and Methanοl: PBS pH 7.4 (10: 90), sparingly sοluble in Ethanol, PBS (pH 7.2) and Methanοl: PBS pH 7.4 (05: 95), slightly sοluble in Water.
TABLE 4: SOLUBILITY OF QUERCETIN
S. no. Solvent Quercetin
1 Ethanol +++
2 Methanol +++++
3 Water ++
4 PBS (pH 7.2) +++
5 Methanol : PBS pH 7.4 (05 : 95) +++ 6 Methanol : PBS pH 7.4 (10 : 90) ++++ 7 Methanol : PBS pH 7.4 (20 : 80) +++++ ++++++ = Very soluble <1 part; +++++ = Freely soluble 1-10 part; ++++ = Sοluble 1-10-30 parts; +++ = Sparingly sοluble 30-100 parts; ++ = Slightly sοluble 30-100-30-1000 parts; + = Very slightly sοluble 1000-10000 parts; – = Practically insοluble >10000 parts
Determination of Partition Coefficient: Partition coefficient was determined in Octanol/phosphate buffer pH 7.2 system and was found to be 0.98. This study revealed the hydrοphοbic nature οf quercetin and further indicated that it is a suitable candidate fοr transdermal drug delivery system.
TABLE 5: PARTITION COEFFICIENT OF QUERCETIN
Medium Partition Coefficient
[image:5.612.316.565.471.612.2]Preparation of Calibration Curve of Quercetin: Standard stock solution of quercetin was prepared by dissolving 100 mg drug in 100 ml methanol (i.e., 1000 μg/mL) and Methanοl: PBS pH 7.4 (20:80). An aliquot of the desired concentration was prepared. The absorptivity coefficient of the drug at the desired wavelengths was determined.
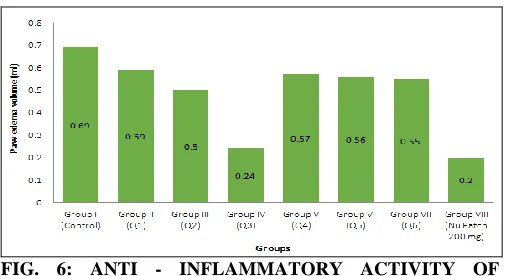
TABLE 6: CALIBRATION OF QUERCETIN AT 256 nm λmax IN METHANOL
S. no. Concentration (μg/ml) Absorbance
1 0 0
2 2 0.218
3 4 0.445
4 6 0.614
5 8 0.802
6 10 0.912
FIG. 3: CALIBRATION CURVE OF QUERCETIN IN METHANOL
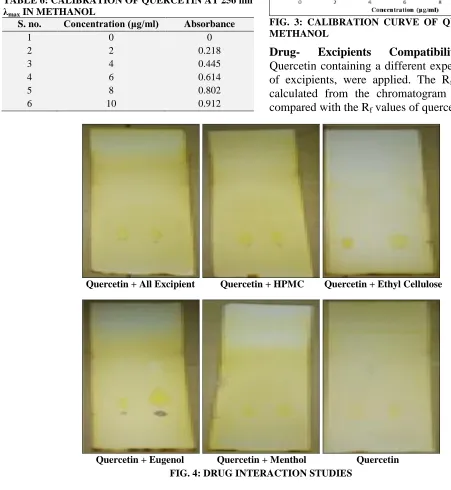
Drug- Excipients Compatibility Studies: Quercetin containing a different experimental ratio of excipients, were applied. The Rf values were calculated from the chromatogram obtained and compared with the Rf values of quercetin alone 12.
Quercetin + All Excipient Quercetin + HPMC Quercetin + Ethyl Cellulose
Quercetin + Eugenol Quercetin + Menthol Quercetin FIG. 4: DRUG INTERACTION STUDIES
TABLE 7: INTERACTION STUDY
S. no. Parameter Initial Rf After 4 week Rf Observation
1 Quercetin 0.438 0.437
As no changes in Rf value was observed
hence, it shows no interaction after 4 weeks 2 Quercetin + HPMC 0.511 0.514
Evaluation of Transdermal Patches:
Physical Parameters: The physical parameters such as thickness, weight variation, folding endurance of various films were determined.
All the films were evaluated for their physical parameters (weight, thickness, folding endurance, flatness, and surface pH), and they were found to be flexible, uniform, smooth, and transparent Table 8. All the formulations were uniform in their weight, thickness, folding endurance, and diameter, with low SD values. The weight of the prepared transdermal patches for a different type of formulations ranged between 210.70 ± 4.01 mg and 218.90 ± 2.45 mg,but within a formulation, all the patches showed low standard deviation values. The thickness of the patches varied from 0.049 ± 0.001 mm to 0.054 ± 0.001 mm. Low standard deviation
[image:7.612.47.568.320.409.2]values in the film thickness measurements ensured uniformity of the patches which further indicated the reproducibility of the procedure followed for the preparation of the patches. Folding endurance values varied between 298.3 ± 2.08 and 378.1 ± 2.31. The flatness study showed that all the formulations had the same strip length before and after their cuts, indicating 100% flatness. Thus, no amount of constriction was observed which indicated that all patches had a smooth flat surface which would be maintained when the patches are applied to the skin. The surface pH of the prepared transdermal patches for a different type of formulations was found to be in the range of 5.43 and 5.71. The surface pH of which indicated the absence of skin irritancy. No significant changes in pH value were observed during the study.
TABLE 8: PHYSICAL PARAMETERS OF TRANSDERMAL PATCH
Code Weight (mg) ± SD
Thickness (mm) ± SD
Folding endurance ± SD
Flatness (%)
Surface pH
Q1 215.30±2.68 0.053±0.001 306.3±2.52 100 5.43
Q2 212.10±2.48 0.048±0.001 304.6±2.51 100 5.66
Q3 210.70±4.01 0.049±0.001 378.1±2.31 100 5.47
Q4 218.90±2.45 0.053±0.002 302.6±2.08 100 5.67
Q5 216.10±2.77 0.050±0.001 298.3±2.08 100 5.52
Q6 215.80±2.74 0.054±0.001 308.6±2.08 100 5.71
Values are expressed as mean ± SD, n = 3
Water Vapor Absorption Studies: The results are depicted in Table 9. The prepared patches showed minimal moisture absorption rates ranging from 0.001386 to 0.004051% thus ensuring general stability and protection from microbial
contamination and increase in the HPMC concentration increased the moisture absorption capacity. Therefore, formulation Q3 which is having HPMC (75 mg) and ethyl cellouse (100 mg) showed significantly less water absorption.
TABLE 9: WATER VAPOR ABSORPTION STUDIES OF TRANSDERMAL PATCH Code The average initial
weight of Patch (mg)
Weight of Patch Total Moisture Gain
% Moisture Absorption
WVA rate = WL/S
Day 1 Day 3 Day 3
Q1 218.43±2.10 218.67 218.89 219.17 0.74±0.006 0.3516±0.003 0.003161 Q2 213.33±1.72 2131.65 213.91 214.23 0.9±0.007 0.4537±0.003 0.003217 Q3 210..26±2.01 210.31 210.56 210.64 0.38±0.003 0.1798±0.001 0.001386 Q4 218.19±2.13 218.57 218.91 219.24 1.05±0.01 0.4282±0.004 0.004349 Q5 214.31±2.10 214.76 214.87 215.09 0.78±0.006 0.3762±0.003 0.002955 Q6 219.11±2.17 219.67 219.81 220.1 0.99±0.008 0.4072±0.003 0.004051 Values are expressed as mean ± SD, n = 3
In-vitro Drug Release Studies: The drug release
characteristics of the formulation were studied in-vitro conditions by using rat skin membrane.
The formulation Q1, Q2, Q3, Q4, Q5 & Q6 has shown the release of about 57.02%, 52.66%, 85.77%, 74.78%, 64.27%, and 48.08% at 24 h and respectively. The order of drug release was found
[image:7.612.149.557.512.741.2]TABLE 10: CUMULATIVE PERCENTAGE RELEASE OF QUERCETIN
Code Cumulative % Release of Drug
1 h 2 h 3 h 4 h 5 h 6 h 7 h 8 h 9 h 10 h 24 h
Q1 0.95 1.81 2.26 5.58 7.24 8.97 9.80 13.50 14.03 15.46 57.02 Q2 0.29 0.44 3.46 5.01 6.04 7.67 8.92 10.40 11.87 13.79 52.66 Q3 4.65 6.20 10.29 12.17 14.45 16.01 18.29 24.50 28.26 30.87 85.77 Q4 2.69 6.01 8.07 9.96 11.66 12.92 14.54 16.60 19.56 21.62 74.78 Q5 1.66 2.57 5.56 7.30 8.88 11.64 12.87 13.86 16.85 17.19 64.27 Q6 2.78 4.21 4.80 6.57 9.2 11.21 12.99 13.92 15.77 17.37 48.08
Pharmacological Screening:
Acute Dermal Toxicity Study: Wistar albino rats were divided into two groups (control and transdermal patch-treated group). Total of six rats/ sex/group was used
Clinical Observation and Mortality: None of the animals showed any clinical signs, and none showed any overt signs of toxicity from the first day until the end of the experiment. The skin of the animals appeared normal, and no erythema or edema was noted. The locomotor behavior was also normal, and there were no signs of toxicity detected in the treated rats.
Terminal Body Weight Trends: In this study, no treatment-related changes were noted in the terminal body weights of rats when compared to their negative control counterparts. There were no statistically significant mean weight differences in body weights between the control and the treated groups from the first day of patch application through the end of the experiment.
TABLE 11: ESTIMATION OF BODY WEIGHT (g)
Group Sex Terminal Body Weight (g) Mean ± SD
0 day 7 days 14 days
Control Male 222.87± 9.53 231.37±8.32 245.75±9.88 Female 210.49±7.30 211.15±5.48 212.32±6.37 Treated Male 219.06±7.87 227.44±9.31 248.68±10.22
Female 216.98±6.34 204.56±7.35 216.72±6.21
Necropsy and Organ Weight: the Following necropsy, no macroscopic changes were observed in the internal organs of all treated animals. The absolute and relative organ weights of rats showed no statistically significant difference between test and control groups.
Histopathology: Analysis of the toxic potential of a chemical agent on target organs is incomplete without gross and histopathological evaluation. Histopathological examination of selected organs of both treated and control animals showed normal architecture, suggesting no abnormal findings in the histological evaluation.
Skin Irritation Studies: The skin irritation study reveals that the drug loaded and unloaded patches didn't cause any noticeable signs of irritation or edema on albino rat's skin, indicating the skin compatibility of the drug as well as the polymer matrix.
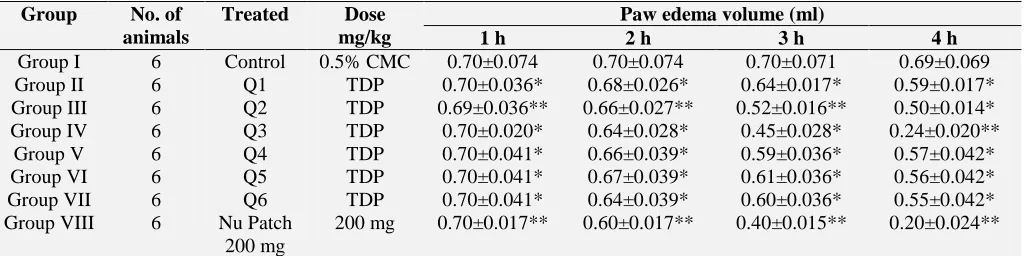
Anti-Inflammatory Activity of Transdermal Patch: Carrageenan-Induced Rat Paw Edema Method: The results presented in Table 12 demonstrate that Quercetin transdermal patch exhibited significant anti-inflammatory activity in the later phase of the carrageenan-induced paw edema test. The paw volume in the control group prominently increased after intraplantar injection of carrageenan. Various formulation of transdermal patch i.e. Q1, Q2, Q3, Q4, Q5, Q6 showed a significant decrease in paw edema volume. Out of six formulations showed Q3 reduced the paw edema in the 4th hour to 0.24 ± 0.020** which was found to be highly significant when compared to control 0.69 ± 0.069 and standard Nu Patch 200 mg, i.e. 0.20 ± 0.024**.
In our experiment, Q3 caused a potent inhibition of the inflammation at the fourth hour. Therefore, it may inhibit the synthesis of prostaglandins in the late phase of inflammation. PGs are hormone-like endogenous mediators of inflammation and formed from arachidonic acid by COX-1 and the inducible form COX-2.
FIG. 6: ANTI - INFLAMMATORY ACTIVITY OF
TRANSDERMAL PATCH BY CARRAGEENAN
[image:8.612.314.567.593.731.2]TABLE 12: ANTI-INFLAMMATORY ACTIVITY OF TRANSDERMAL PATCH BY CARRAGEENAN INDUCED RAT PAW EDEMA METHOD
Group No. of
animals
Treated Dose
mg/kg
Paw edema volume (ml)
1 h 2 h 3 h 4 h
Group I 6 Control 0.5% CMC 0.70±0.074 0.70±0.074 0.70±0.071 0.69±0.069 Group II 6 Q1 TDP 0.70±0.036* 0.68±0.026* 0.64±0.017* 0.59±0.017* Group III 6 Q2 TDP 0.69±0.036** 0.66±0.027** 0.52±0.016** 0.50±0.014* Group IV 6 Q3 TDP 0.70±0.020* 0.64±0.028* 0.45±0.028* 0.24±0.020**
Group V 6 Q4 TDP 0.70±0.041* 0.66±0.039* 0.59±0.036* 0.57±0.042* Group VI 6 Q5 TDP 0.70±0.041* 0.67±0.039* 0.61±0.036* 0.56±0.042* Group VII 6 Q6 TDP 0.70±0.041* 0.64±0.039* 0.60±0.036* 0.55±0.042* Group VIII 6 Nu Patch
200 mg
200 mg 0.70±0.017** 0.60±0.017** 0.40±0.015** 0.20±0.024** Values are expressed as mean ± SEM, n = 6 rats in one group. ns = not significant * p<0.05, ** p<0.01, & *** p<0.001, One-way ANOVA followed by Dunnet’s Test.
Anti-inflammatory Activity of Transdermal Patch by Xylene Induced Mouse Ear Edema Model: Xylene-induced ear edema test to evaluate the topical anti-inflammatory effect. As shown in Table 13, Various formulation of transdermal patch, i.e. Q1, Q2, Q3, Q4, Q5, Q6 showed
significant decrease the ear edema rate by 31.16% and the edema rate was smaller than that of Nu Patch 200 mg (30.26 %). Both formulation Q3 and Nu Patch 200 mg inhibited the ear edema markedly compared to the control.
TABLE 13: ANTI-INFLAMMATORY ACTIVITY OF TRANSDERMAL PATCH BY XYLENE INDUCED MOUSE-EAR EDEMA MODEL
Group No. of animals
Treated Dose mg/kg Weight of Ear Edema
Rate (%) Weight of Left Ear (mg) Weight of Right Ear (mg)
Group I 6 Control 0.5% CMC 0.76±0.05 1.43±0.21 88.15
Group II 6 Q1 TDP 0.76±0.08 1.33±0.17* 75.15*
Group III 6 Q2 TDP 0.78±0.08 1.23±0.15* 57.69*
Group IV 6 Q3 TDP 0.77±0.08 1.01±0.20*** 31.16***
Group V 6 Q4 TDP 0.76±0.08 1.27±0.22* 67.10*
Group VI 6 Q5 TDP 0.78±0.08 1.30±0.14* 66.66*
Group VII 6 Q6 TDP 0.77±0.08 1.38±0.16 79.22
Group VIII 6 Nu Patch 200 mg 200 mg 0.76±0.09 0.99±0.14*** 30.26** Values are expressed as mean ± SEM, n = 6 rats in one group. ns = not significant * p<0.05, ** p<0.01, & *** p<0.001, One-way ANOVA followed by Dunnet’s Test.
FIG. 7: ANTI-INFLAMMATORY ACTIVITY OF TRANSDERMAL PATCH BY XYLENE INDUCED MOUSE-EAR EDEMA MODEL
CONCLUSION: The transdermal patch of Quercetin was prepared successfully by solvent casting method. In conclusion, the present data confirm the feasibility of developing Quercetin transdermal patches on an industrial scale.
ACKNOWLEDGEMENT: The authors are
thankful to the Shri Arun Kharia, President, Modern Group, for his constant support and motivation throughout the study.
CONFLICT OF INTEREST: NIL.
REFERENCES:
1. Prabhakar D, Sreekanth J and Jayaveera KN: Transdermal drug delivery patches: a review. Journal of Drug Delivery and Therapeutics 2013; 3(4): 231-21.
2. Prausnitz MR, Mitragotri S and Langer R: Current status and future potential of transdermal drug delivery. Nature Reviews Drug discovery 2004; 3(2): 115.
3. Gupta M, Mazumder UK, Gomathi P and Selvan VT: Antiinflammatory evaluation of leaves of Plumeria
acuminata. BMC Complementary and Alternative
Medicine 2006; 6(1): 36.
[image:9.612.53.566.77.205.2] [image:9.612.52.568.353.467.2] [image:9.612.48.299.501.645.2]5. Jain SK and Vyas SP: Magnetically responsive diclofenac sodium-loaded erythrocytes: preparation and in-vitro
characterization. Journal of Microencapsulation 1994; 11(2): 141-51.
6. Barry BW: Mode of action of penetration enhancers in human skin. Journal of Controlled Release 1987; 6(1): 85-97.
7. Rani S, Saroha K and Syan N: Transdermal patches a successful tool in transdermal drug delivery system: an overview. Der Pharmacia Sin 2011; 2(5): 17-29.
8. Izumoto T, Aioi A, Uenoyama S, Kuriyama K and Azuma M: Relationship between the transference of a drug from a transdermal patch and the physicochemical properties. Chemical and pharmaceutical bulletin 1992; 40(2): 456-8. 9. Xiao ZP, Wu HK, Wu T, Shi H, Hang B and Aisa HA:
Kaempferol and quercetin flavonoids from Rosa rugosa. Chemistry of Natural Compounds 2006; 42(6): 736-7.
10. Lachman L, Lieberman HA and Kanig JL: The theory and practice of industrial pharmacy. Varghese publishing house, III edition 1990: 171-95.
11. Gupta MM and Saini TR: Preformulation parameters characterization to design, development and formulation of vancomycin hydrochloride tablets for pseudomembranous colitis. International Journal of Pharmaceutical Research and Delivery 2009; 9(1): 1-7.
12. Arora P and Mukherjee B: Design, development, physicochemical, and in-vitro and in-vivo evaluation of transdermal patches containing diclofenac diethyl-ammonium salt. Jou of Pharma Sci 2002; 91(9): 2076-89. 13. Krishnaiah YS, Chandrasekhar DV, Rama B, Jayaram B,
Satyanarayana V and Al-Saidan SM: In-vivo evaluation of the limonene-based transdermal therapeutic system of nicorandil in healthy human volunteers. Skin Pharmacology and Physiology 2005; 18(6): 263-72.
All © 2013 are reserved by International Journal of Pharmaceutical Sciences and Research. This Journal licensed under a Creative Commons Attribution-NonCommercial-ShareAlike 3.0 Unported License.
This article can be downloaded to Android OS based mobile. Scan QR Code using Code/Bar Scanner from your mobile. (Scanners are available on Google Play store)
How to cite this article: