INCREASED ALDEHYDE FORMATION AS A KEY COMPONENT OF THE METABOLIC SYNDROME IN
ADOLESCENTS: A MACHINE LEARNING STUDY
Kamila Landucci BONIFACIO, Ph.D1; Michael MAES, Ph.D2,3,4,Carine Coneglian de FARIAS, Ph.D 1; Andressa Keiko MATSUMOTO, MD1; Crisieli Maria TOMERELI, Ph.D5, Danilo Rodrigues Pereira da SILVA, Ph.D5; Edilson Serpeloni CYRINO, Ph.D5; Suzana
Lucy NIXDORF, Ph.D 6; Danielle VENTURINI, Ph.D 1,7; Décio Sabbatini BARBOSA, Ph.D
1,7.
1Laboratory of Graduation Research, State University of Londrina, University Hospital,
Londrina, Paraná, Brazil
2Department of Psychiatry, Faculty of Medicine, King Chulalongkorn Memorial Hospital,
Bangkok, Thailand
3Department of Psychiatry, Medical University of Plovdiv, Plovdiv, Bulgaria 4IMPACT Strategic Research Centre, Deakin University, Geelong, VIC, Australia
5Metabolism, Nutrition, and Exercise Research Group, Sport and Physical Education Center,
State University of Londrina
6Department of Chemistry, State University of Londrina, Londrina, PR, Brazil 7Department of Clinical Analysis and Toxicological, State University of Londrina,
Corresponding author:
Kamila Landucci Bonifacio, Ph.D
Laboratory of Graduation Research, State University of Londrina, University Hospital,
Londrina, Paraná, Brazil
E-mail address: [email protected]
ABSTRACT
Purpose: To investigate the alterations in nitro-oxidative stress (OS) and antioxidant status in adolescents with metabolic syndrome (MetS) and whether these alterations occur
independently from effects of overweight or obesity.
Methods: Blood was collected in 47 adolescents with MetS and 94 adolescents without MetS as assessed with the International Diabetes Federation criteria. The International Obesity
Task Force (IOTF) criteria were used to classify the subjects into those with overweight or obesity. We measured nitro-oxidative biomarkers including nitric oxide metabolites (NOx),
lipid hydroperoxides (LOOH), and malondialdehyde (MDA), and antioxidant biomarkers, i.e. total radical-trapping antioxidant parameter (TRAP), paraoxonase (PON)-1 activity, thiol
(SH-) groups, as well as tumor necrosis factor-α, glucose, insulin, triglycerides, uric acid and high-density lipoprotein cholesterol (HDL-C).
Results: Logistic regression analysis showed that increased MDA and NOx and a lowered TRAP/uric acid ratio were associated with MetS. Machine learning including soft independent modeling of class analogy (SIMCA) showed that the top-3 most important
features of MetS were increased glucose and MDA and lowered HDL-C. Support vector machine using MDA, glucose, insulin, HDL-C, triglycerides and body mass index as input variables yielded a 10-fold cross-validated accuracy of 89.8% when discriminating MetS
from controls. The association between MetS and increased MDA was independent from the effects of overweight-obesity. glucose, insulin, triglycerides and HDL-C.
Keywords: Metabolic Syndrome; Obesity; inflammation; Oxidative Stress; nitrosative stress; biomarkers
Emails:
[email protected] [email protected] [email protected]
List of abbreviations: oxidative stress (OS); Metabolic syndrome (MetS); International Diabetes Federation (IDF); International Obesity Task Force (IOTF); tobacco use disorder (TUD); body mass index (BMI); waist circumference (WC); high-density lipoprotein
cholesterol (HDL-C); low-density lipoprotein cholesterol (LDL-C); reactive oxygen species (ROS), reactive nitrogen species (RNS), oxidative and nitrosative stress (O&NS); malondialdehyde (MDA); lipid hydroperoxides (LOOH); nitric oxide metabolites (NOx);
total radical-trapping antioxidant parameter (TRAP); tumor necrosis factor α (TNFα); paraoxonase (PON)-1 activity; thiol groups (SH-); protein (PT); statistical isolinear multiple
INTRODUCTION
Key features of metabolic syndrome (MetS) are central obesity, insulin resistance and dyslipidemia as evidenced by increased levels of insulin, glucose and triglycerides, in
conjunction with lowered high-density lipoprotein cholesterol (HDL-C) [1].Central obesity is accompanied by a chronic mild inflammatory state mediated by an increased production of pro-inflammatory cytokines by immune cells and adipocytes, including tumor necrosis factor
alpha (TNF-α). This pro-inflammatory response is regarded to function as a homeostatic process that attenuates excess fat accumulation [2].
MetS is accompanied by increased reactive oxygen (ROS) and nitrogen (RNS) species and decreases in antioxidant defenses creating an environment that promotes oxidative and
nitrosative stress (O&NS) [3,4]. Decreased levels of antioxidant enzymes including catalase, superoxide dismutase and glutathione peroxidase, and increased levels of malondialdehyde (MDA, indicating lipid peroxidation) and protein carbonyls (indicating protein oxidation)
were observed in MetS [5]. Furthermore, concentrations of nitric oxide metabolites (NOx) are associated with MetS [6], while other studies reported lower concentrations of nitric oxide
(NO) formation biomarkers in adult MetS [7,8]. Another study found lower levels of thiol (-SH) groups in patients with MetS features as compared to controls, although there are also contradictory results [9]. The assay of -SH groups may be used as a marker of the redox
status of albumin reflecting non-enzymatic antioxidant defenses.
Nevertheless, obesity may impact the relationship between oxidative stress
biomarkers and MetS. For example, obesity is associated with low systemic antioxidant defenses and enhanced lipid peroxidation, as indicated by elevated MDA levels [10–12]. Lowered NO formation is not only reported in MetS but also in obese juveniles [7,8], while
are present [1,13]. Likewise, the activity of paraoxonse 1 (PON), a strong antioxidant
enzyme, is decreased in adult obese patients and in patients with MetS [14]. On the other hand, increased uric acid levels (which displays antioxidant and pro-oxidant effects) is a
component of the MetS in adults [15] as well as in adolescents and children [16] and is positively associated with waist circumference, fasting glucose and insulin, and insulin resistance, and inversely with HDL-cholesterol [17].
Therefore, it is not always clear whether changes in these redox biomarkers in MetS are a feature of MetS or overweight/obesity or both. In addition, only few studies in children
and adolescents focused on O&NS in MetS as compared with a much larger number of studies in adults [18]. Hence, the aims of the present study are to examine whether a)
increased O&NS biomarkers, including MDA and lipid hydroperoxides (LOOH), NOx, lowered antioxidant biomarkers, i.e. TRAP, SH- groups and PON-1 activity, and increased TNF-α are hallmarks of MetS in adolescents, b) these biomarkers contribute to an accurate
classification of MetS; and c) these O&NS measurements are biomarkers of MetS or overweight-obesity.
2SUBJECTS AND METHODS
2.1 Subjects
We included 47 adolescents with the MetS and 94 adolescents without the MetS. All subjects were 11-17 years old and both genders were included. They were recruited from
public schools located in the city of Londrina, Paraná, Brazil. Exclusion criteria were clinical or laboratory signs of medical disease, being under treatment for any disease, use of illicit drugs, and not being regularly enrolled in schools. All participants underwent a physical
structured interview. Both parents and adolescents gave their signed informed consent to
participate in the study. The protocol was approved by the Ethics Committee on Research Involving Human Subjects of the State University of Londrina.
The MetS was diagnosed according to the International Diabetes Federation (IDF) consensus criteria [19]. Most of our controls had no or less than 2 features of the MetS. The International Obesity Task Force (IOTF) [20] criteria were used to divide the subjects into
those with a normal BMI, overweight and obesity (BMI cut off values are adjusted for age and gender). The diagnosis tobacco use disorder (TUD) was made using DSM IV criteria.
Body weight and height were measured using standardized methods [21]. Body weight was assessed using a digital scale with an accuracy of 0.1 kg, and body height using a
portable wooden stadiometer with an accuracy of 0.1 cm. Waist circumference (WC) was measured at the level of the umbilicus. Hip circumference was measured over light clothing at the widest girth of the hip using an unstretched tape meter, without any pressure to body
surface. Systolic and diastolic blood pressure were assessed using the digital OMRON Model HEM-742 [22].
2.2. Methods
Fasting blood was collected from the antecubital vein between 8 a.m. and 10.00. a.m.
Uric acid, total cholesterol and HDL-C, triglycerides, glucose, insulin were determined by automated methods using the Dimension®RxL, (Deerfield, IL, USA) and i2000SR Architect
(Abbott, IL, USA). LDL-cholesterol was calculated using the Friedewald equation. Nitric oxide metabolites (NOx) levels were assessed by an adaptation of the technique described Navarro-Gonzálvez et al.[23] Lipid hydroperoxides (LOOH) were determined using the
TRAP/MDA ratio was computed as a biomarker of antioxidant defenses versus oxidative
stress. Thiol (SH-) groups were assessed as described by Hu [26]. Total plasma paraoxonase 1 (PON)-1 activity was determined as described by Richter et al. The activity was expressed
in U/mL based on the phenyl acetate molar extinction coefficient of 1.31 mMol/L cm-1 [27]. Malondialdehyde (MDA) was quantified according to the technique described by Bastos et al. [28]. TNFα was quantified by ELISA (Human TNF alpha ELISA Ready-Set-Go, catalog
number: 88-7346, eBioscience). The inter-assay coefficients of variability for all analytes were less than 10%.
2.3 Statistical analyses
Analyses of contingency Tables (2 -test) or Fisher's exact probability test were
employed to examine associations between grouping data. We assessed the differences in socio-demographic, clinical and biomarker data between groups using analyses of variance (ANOVAs) followed by the Tukey test to examine multiple comparisons among group
means. Automatic stepwise binary logistic regression analysis with the MetS as dependent variable (and no MetS as reference group) and the O&NS biomarkers as explanatory
variables was used to delineate the significant explanatory variables. Automatic, stepwise, multinomial logistic regression analysis was used to examine the significant predictors of groups divided according to the BMI into individuals with overweight and obesity. We
employed univariate and multivariate general linear model (GLM) analyses to examine the relationships between the O&NS biomarkers, on the one hand and the metabolic and central
obesity markers and the MetS, overweight and obesity, on the other. Exploratory factor analysis (principal component method with varimax rotation) was employed to interpret the associations between the O&NS biomarkers, the MetS, obesity / overweight and metabolic
of-fit test. The Levene test was used to test for homogeneity of variance. We used logarithmic
(Ln) transformations in case variables were not normally distributed or when there was a heterogeneity of variance between study groups. We used the IBM SPSS version 25 for
windows to perform all statistical analyses. All tests were 2-tailed and a p-value of 0.05 was used for statistical significance.
To classify MetS patients and controls based on the biomarkers we used Support
Vector Machine with linear kernel (linear SVM) or radial basis function (RBF SVM) (CAMO 2019). Input variables (biomarkers) were normalized with a standard deviation
weighting process and the model was cross-validated using a 10-fold scheme. The classification data are summarized in the confusion matrix and using the cross-validated
accuracy. Multilayer perceptron (MLP) neural network (NN) was used to delineate the associations between biomarkers (input variables) and MetS versus controls (output variables) using an automated feedforward architecture. Using SPSS25, we trained models
and used two hidden layers with up to 8 nodes and 200 epochs, minibatch training with gradient descent, and with one consecutive step with no further decrease in the error term as
stopping rule. We allocated cases to a training set (46.7%) to estimate the network parameters, a testing set (20%) to prevent overtraining, and a holdout sample (33.3%) to evaluate the predictive value of the network. Error, relative error, the importance of the input
variables and area under the ROC curve with sensitivity and specificity were computed. Soft Independent Modeling of Class Analogy or Statistical Isolinear Multiple
Component Analysis (SIMCA) was employed as a class modeling technique (CAMO 2019). Principal component analysis (PCA) models were used to construct PCA models of both MetS patients and controls in a training set (50% of MetS patients and controls) and the
residual values and leverages. In order to compute figures of merit (including the
model-to-model distance, the discriminatory power of the input variables, and the classification accuracy) we projected cases allocated to the testing set (the remaining 50% of patients and
controls) into the PCA models.
RESULTS
Features of MetS
Table 1 shows the socio-demographic and clinical data of the subjects with and without MetS. There were no significant differences in age, gender or TUD between both groups. Body weight, BMI, waist circumference, systolic and diastolic blood pressure,
glucose, insulin and triglyceride levels were significantly higher in individuals with the MetS as compared with those without. HDL-C levels were significantly lower in those with MetS. There were no significant differences in total cholesterol or LDL-C between both groups.
MetS was associated with significantly higher uric acid and MDA levels. Table 1 shows that there was a trend towards significantly higher NOx in MetS. The TRAP / uric acid ratio was
significantly lower in the MetS.
Results of logistic regression analyses predicting MetS.
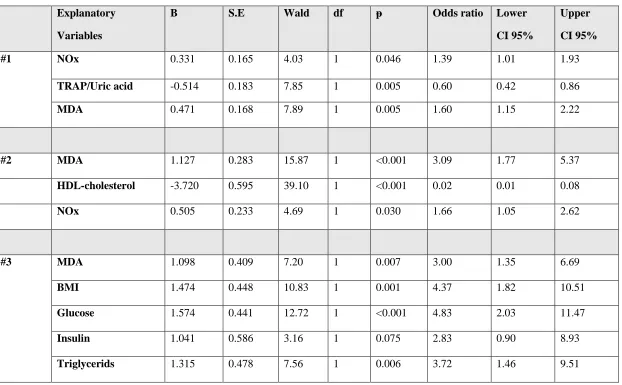
Table 2 shows the results of automatic logistic regression analysis with MetS as dependent variable (and controls as reference group). Regression #1 shows that MDA, NOx
(positively) and TRAP / uric acid ratio (inversely) were significantly associated with MetS (χ2=23.81, df=3, p<0.001, Nagelkerke=0.164; sensitivity=58.6% and specificity=66.0%).
Forced entry of age, gender and TUD showed that those factors were not associated with
oxidative and antioxidant biomarkers) we found that (regression #2) increased MDA and
NOx levels combined with lowered HDL-C best predicted MetS with a huge effect size (χ2=136.87, df=3, p<0.001, Nagelkerke=0.780; sensitivity=83.9% and specificity=85.1%).
Finally, regression #3 evaluates the combined effects of all oxidative and antioxidant biomarkers, BMI, and lipid and IR features of MetS. This regression shows that MetS was best predicted by MDA, BMI, glucose, triglycerides (all positively associated), HDL-C (inversely associated) while insulin showed a trend towards a positive association (χ2=184.59,
df=6, p<0.001, Nagelkerke=0.853; sensitivity=91.5% and specificity=89.7%, overall
accuracy=90.6%).
Results of SVM, SIMCA, PCA and NN
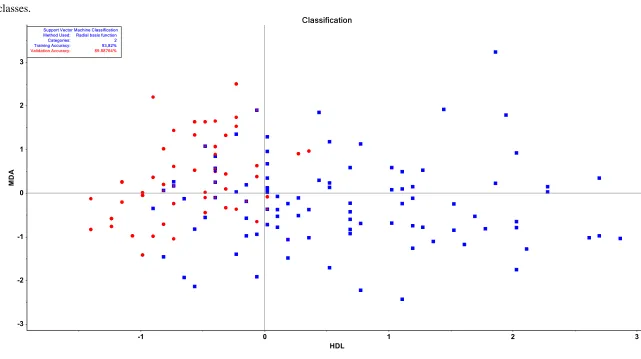
SVM with radial basis function and 10-fold cross-validation was employed for classification purposes. We found an accurate discrimination of MetS from controls with the
biomarkers shown in table 2, regression #2 (except insulin) yielding a training accuracy of 93.82% and a validation accuracy of 89.89%. Figure 1 shows the statistic table as well as a
2D scatter plot of the discrimination of MetS and controls using MDA and HDL-C only, whereby patients and controls are color and shape-coded according to their predefined classes). Consequently, we have examined the separation of both treatment groups employing
MDA, HDL-C, triglycerides, insulin, glucose and BMI as modelling and discriminatory variables in a SIMCA. We made a training set with 50% of all participants and a test set with
the remaining participants. Two controls were omitted as statistical outliers, while all patients with MetS could be included. We modelled both classes of MetS patients and controls using 5 PCs. The model-to-model distance was highly significant, namely 158.68. All MetS cases
and a specificity of 73.91%. Figure 2 shows the discrimination power of all input variables. The top-3 discriminatory variables were in descending order: glucose (14.1752), HDL-C (14.1664), MDA (14.1620), followed by BMI, and again at a distance by triglycerides and
insulin.
Figure 3 shows the outcome of the best neural network discriminating MetS patients from controls using all immune and oxidative stress biomarkers as well as BMI and waist
circumference. The feedforward network was trained with 2 hidden layers, with 6 units in layer 1 and 5 units in layer 2. As activation functions we used hyperbolic tangent in the
hidden layers and identity in the output layer. The sum of squares error term was much lower in the testing (4.810) than in the training (10.628) set, while the percentage of incorrect
classifications was even lower in the test (11.4%) than in the training (15.8%) set, indicating that the model learned to generalize from the trend. The AUC ROC was 0.932 and the holdout sample showed a sensitivity of 84.2% and specificity of 73.9%. Figure 3 shows the
importance chart indicating that waist circumference, MDA, -SH groups and BMI have the highest predictive power of the model, followed at a distance by NOx, TRAP and PON1. The
other input variables comprising gender, uric acid, LOOH and TNF-α have no or less predictive value.
MetS versus IOTF classification
Table 3 shows that there was a highly significant association between groups divided according to the IOTF and the MetS (χ2=33.30, df=2, p<0.001). All paired comparisons were significantly different from each other at p<0.05. More importantly, this table shows that some MetS patients have obesity (51.06%), overweight (34.04), or a normal BMI (14.89%),
In order to decipher the biomarkers which independently from IOTF diagnoses are
associated with MetS, we conducted a multivariate GLM analysis examining the association between the classification into MetS and IOTF and the biomarkers, namely MDA, uric acid,
SH groups, TRAP, glucose, insulin, HDL-C, and triglycerides (the other variables yielded non-significant results and are not shown). Table 4 shows that there are significant associations between the residualized biomarker levels and MetS. Figure 4 shows the residualized biomarker values after adjusting for IOTF, age, sex, and TUD and that MDA, SH, triglycerides, glucose, and insulin were higher in MetS, while HDL-C was significantly
lower in MetS as compared with adolescents without MetS. Table 4 and Figure 5 shows that there was a significant association between the residualized biomarker data (after adjusting
for MetS, age, sex and TUD) and the IOTF diagnosis whereby subjects with overweight and obesity show higher uric acid and triglyceride levels and lower HDL-C levels as compared with those without overweight or obesity.
4.DISCUSSION
The major findings of this study are that a) MetS in adolescents is characterized by increased MDA and -SH groups while increased uric acid is more specifically associated with overweight-obesity. Most importantly, machine learning techniques, including SIMCA,
showed that MDA has a discriminatory power in separating MetS from controls, which is as strong as that of glucose, HDL-C, and BMI. Finally, our classification models including
neural networks showed that MetS was significantly separated from controls with an AUC ROC curve of 0.932 using waist circumference, MDA, -SH groups, BMI and NOx as top-5 discriminatory variables.
increased MDA in MetS but not in obese individuals, suggesting that MDA is associated with
a cluster of cardiometabolic risks rather than with obesity per se [29]. On the other hand, Abdilla et al. (2007) found no relationship between MDA and MetS components and a weak
association with BMI [30,31]. Other studies reported increased MDA levels in adolescents with obesity as compared with adolescents without obesity [32]. Several other studies found strong associations of MDA or TBARS with overweight/obesity or waist circumference
(WC) [5,33,34]. In obese and overweight men and women, lipid peroxidation increases significantly with increasing BMI, while elevated MDA also occurs in obese adolescents and
children between 8 and 18 years old [35]. In addition, obese children show MDA levels that are twice as high as those in non-obese children [35,36].
Nevertheless, using machine learning techniques, including SIMCA and neural networks, we detected that increased MDA was a key feature of MetS in adolescents along with glucose, HDL-C and BMI. It is interesting to note that in our study, MDA levels were
not associated with obesity or overweight after considering the effects of MetS and that the association between MDA and MetS was not affected by overweight or obesity. Data in
adolescents are most important because the results allow to estimate the pathways that are involved in the development of this condition. Consequently, our results show that increased aldehyde formation is a key phenomenon in adolescents with MetS and, therefore, that
aldehyde formation starts at an early age and may participate in the development of the condition. Increased MDA formation indicates damage and toxicity to lipids as a
consequence of increased ROS production, which play a key in endothelial dysfunction, oxidation of LDL-C, and the development of atherosclerosis, as well as contributing to insulin resistance and diabetes type 2 [37–41]. Moreover, serum MDA levels significantly
cardiovascular heart disease, such as coronary artery fatty streaks, are already present in
childhood and rapidly increase during adolescence, particularly in adolescents with elevated BMI [43].
Another characteristic of the MetS, albeit less significant than MDA, is the increase in -SH groups. These findings are not in agreement with our a priori hypothesis and with previous findings on lowered SH-groups in adult MetS [44]. Increased ROS may cause
oxidation of -SH groups in albumin and consequently a depletion in their blood levels which, in turn, may exacerbate functional and structural disturbances of the damaged
macromolecules [45]. It is possible that the increase in -SH groups in our adolescents with MetS may be explained by dysfunctions in the folate-dependent methionine cycle, including
increased homocysteine levels in MetS [46]. It is also possible that the increases in -SH groups are a compensatory mechanism whereby -SH groups are being exposed due to protein unfolding (as a consequence of oxidative stress) followed by increases in -SH groups via
thioredoxin-related mechanisms. Such compensatory mechanisms could be prominent in the early phase of disease as observed in our study, whereas a depletion of -SH groups may be
detected in later phases of MetS [44].
Logistic regression and neural networks showed that increased NOx (when coupled with other data including MDA, -SH groups and HDL-C) contributes to the prediction of
MetS. Chedraui et al (2012) reported that NO levels were higher in women with MetS in association with altered serum HDL-C, triglycerides and glucose levels. Serum NOx levels
are also increased in adults with MetS in association with BMI, waist-to-hip ratio, and fasting plasma glucose levels [47]. Correia-Costa et al (2016) reported that NOx levels are increased in obese children and correlate with cardiometabolic risk, renal function and are positively
Codoner-Franch et al. (2011) reported an increase in plasma nitrite, nitrate, and nitrotyrosine levels
associated with markers of oxidative stress in obese children [49]. Gruber et al. (2008) found a decrease in NOx in obese juveniles compared to normal weight juveniles [8]. The
measurement of serum NOx levels estimate basal NO generation by endothelial cells. Therefore, it may be speculated that increased serum NOx in the MetS may be due to endothelial NO synthase (eNOS) inhibition and inducible NOS (iNOS) overexpression [6].
Moreover, high glucose induces activity of endothelial NOS and NOx leading to overproduction of NO and ROS, respectively, which may cause nitrosative stress-mediated
vascular endothelial cell dysfunctions [50]. NOx is believed to be a major player in endothelial dysfunction that influences vascular homeostasis and contributes towards
development of vascular complications such as atherosclerosis [51]. The higher NOx levels found in our adolescents may well reflect a compensatory feedback mechanism present in the earlier stage of the syndrome [52].
We found that uric acid was significantly associated with overweight or obesity rather than with the MetS. Our findings extend these of previous authors showing that serum uric
acid levels are increased in subjects with obesity, dyslipidemia, hypertension and impaired glucose tolerance, and are associated with the MetS and cardiovascular disease [53,54]. Most importantly, in a longitudinal study, Wang et al. [53] found that serum uric acid levels were
significantly correlated with future increases in waist circumference, systolic blood pressure, and triglyceride and HDL-C plasma levels and, thus, with an increased risk of MetS. These
results suggest that in adolescents, increased levels of uric acid are associated with obesity and consequently also with the MetS.
The interpretation of our TRAP findings is more difficult because uric acid (which is
TRAP values were normalized to uric acid or when the results are controlled for BMI we
found that lowered TRAP concentrations were associated with MetS. These findings extend those of Molnár et al. (2004)who showed that TRAP was decreased in the multimetabolic
syndrome group in spite of the slightly elevated concentrations of uric acid [13].
In the present study we found no significant association between lowered PON-1 activity and MetS or obesity, which contrasts our a priori hypothesis. PON-1 is a HDL-C
associated enzyme, which plays a significant role in inhibiting the oxidation of HDL-C particles thereby contributing to most of the antioxidant activity of HDL-C [55]. Ferre et al
(2013) reported that PON1 may play a role in the onset and development of metabolic alterations in childhood obesity [56]. In a juvenile population, decreased PON-1 activity is
potentially relevant for the development of atherosclerosis and this may occur independently from effects on HDL-C [57]. However, some studies found contradictory results, hypothesizing that a regulatory increase of the antioxidant system could be present to
compensate for the higher oxidative stress levels [48,58]. For example, in obese subjects, lowered PON-1 activity in HDL-C particles could be due to the presence of circulating
inhibitors such as lipid peroxidation products [59].
This study has some strengths and limitations that must be considered in the interpretation of the results. This is a cross sectional study and, therefore, we cannot draw
firm conclusions on causal associations. Strengths are that the results are analyzed with machine learning including deep learning which allow for a better prediction as well as
feature description.
In conclusion, adolescents with MetS have a redox imbalance, characterized by increased aldehyde formation following lipid oxidation, increased NOx production, increased
phenomenon of MetS with a discriminatory power comparable to that of atherogenic and
glucotoxicity biomarkers. The results suggest that early increases in lipid peroxidation and aldehyde formation are involved in the development of MetS.
Acknowledgements
The authors acknowledge the Health Sciences Postgraduate Program of the State University
of Londrina, Brazil, and the Ministry for Sciences and Technology of Brazil (CNPq), Brazilian Federal Agency for Support and Evaluation of Graduate Education (CAPES).
Author Disclosure Statement
The authors declare no conflict of interest
Funding source
Ministry for Science and Technology of Brazil (CNPq).
REFERENCES
[1] Faienza MF, Francavilla R, Goffredo R, Ventura A, Marzano F, Panzarino G, et al. Oxidative stress in obesity and metabolic syndrome in children and adolescents. Horm
Res Paediatr 2012;78:158–64. https://doi.org/10.1159/000342642.
[2] Aballay LR, Eynard AR, Díaz MDP, Navarro A, Muñoz SE. Overweight and obesity:
a review of their relationship to metabolic syndrome, cardiovascular disease, and cancer in South America. Nutr Rev 2013;71:168–79. https://doi.org/10.1111/j.1753-4887.2012.00533.x.
metabolic syndrome. Med Sci Monit 2008;14:CR97-101.
[4] Hutcheson R, Rocic P. The metabolic syndrome, oxidative stress, environment, and cardiovascular disease: the great exploration. Exp Diabetes Res 2012;2012:1–13.
https://doi.org/10.1155/2012/271028.
[5] Awadallah S, Hasan H, Attlee A, Raigangar V, Unnikannan H, Madkour M, et al. Waist circumference is a major determinant of oxidative stress in subjects with and
without metabolic syndrome. Diabetes Metab Syndr Clin Res Rev 2019;13:2541–7. https://doi.org/10.1016/j.dsx.2019.07.010.
[6] Ghasemi A, Zahediasl S, Azizi F. Nitric oxide and clustering of metabolic syndrome components in pediatrics. Eur J Epidemiol 2010;25:45–53.
https://doi.org/10.1007/s10654-009-9382-3.
[7] Gomes VA, Casella-Filho A, Chagas ACP, Tanus-Santos JE. Enhanced concentrations of relevant markers of nitric oxide formation after exercise training in patients with
metabolic syndrome. Nitric Oxide - Biol Chem 2008;19:345–50. https://doi.org/10.1016/j.niox.2008.08.005.
[8] Gruber H-J, Mayer C, Mangge H, Fauler G, Grandits N, Wilders-Truschnig M. Obesity reduces the bioavailability of nitric oxide in juveniles. Int J Obes 2008;32:826–31. https://doi.org/10.1038/sj.ijo.0803795.
[9] Żurawska-Płaksej E, Grzebyk E, Marciniak D, Szymańska-Chabowska A, Piwowar A. Oxidatively modified forms of albumin in patients with risk factors of metabolic
syndrome. J Endocrinol Invest 2014;37:819–27. https://doi.org/10.1007/s40618-014-0111-8.
[10] Vincent HK, Innes KE, Vincent KR. Oxidative stress and potential interventions to
[11] Kiran BSR, Mohana Lakshmi T, Srikumar R, Prabhakar Reddy E. Total antioxidant
status and oxidative stress in diabetes mellitus and metabolic syndrome. Int J Pharm Sci Rev Res 2016;40:271–7.
[12] Singh S, Dwivedi A, Kumar S, Mittal PC. Total Antioxidant Status and Other Markers to Distinguish Severely Obese Volunteers with and without Metabolic Syndrome. Food Nutr Sci 2019;10:648–63. https://doi.org/10.4236/fns.2019.106048.
[13] Molnár D, Decsi T, Koletzko B. Reduced antioxidant status in obese children with multimetabolic syndrome. Int J Obes Relat Metab Disord 2004;28:1197–202.
https://doi.org/10.1038/sj.ijo.0802719.
[14] Garin MCB, Kalix B, Morabia A, James RW. Small, dense lipoprotein particles and
reduced paraoxonase-1 in patients with the metabolic syndrome. J Clin Endocrinol Metab 2005;90:2264–9. https://doi.org/10.1210/jc.2004-1295.
[15] Onat A, Hergenç G, Türkmen S, Yazici M, Sari I, Can G. Discordance between insulin
resistance and metabolic syndrome: Features and associated cardiovascular risk in adults with normal glucose regulation. Metabolism 2006;55:445–52.
https://doi.org/10.1016/j.metabol.2005.10.005.
[16] Ford ES, Li C, Cook S, Choi HK. Serum concentrations of uric acid and the metabolic syndrome among US children and adolescents. Circulation 2007;115:2526–32.
https://doi.org/10.1161/CIRCULATIONAHA.106.657627.
[17] Simão ANC, Dichi JB, Barbosa DS, Cecchini R, Dichi I. Influence of uric acid and
gamma-glutamyltransferase on total antioxidant capacity and oxidative stress in patients with metabolic syndrome. Nutrition 2008;24:675–81.
https://doi.org/10.1016/j.nut.2008.03.021.
Int J Pediatr Obes 2010;5:56–63. https://doi.org/10.3109/17477160903055945.
[19] Zimmet P, Alberti KGM, Kaufman F, Tajima N, Silink M, Arslanian S, et al. The metabolic syndrome in children and adolescents - an IDF consensus report. Pediatr
Diabetes 2007;8:299–306. https://doi.org/10.1111/j.1399-5448.2007.00271.x. [20] Cole TJ, Bellizzi MC, Flegal KM, Dietz WH. Establishing a standard definition for
child overweight and obesity worldwide : international survey. BMJ 2000;320:1240–3.
[21] Lohman T, Roche A, Martorell R. Anthropometric standardization reference manual. Stature, recumbent length, Weight., Champaign IL: Human Kinetics Books; 1988, p.
3–8.
[22] Christofaro DGD, Casonatto J, Polito MD, Cardoso JR, Fernandes R, Guariglia DA, et
al. Evaluation of the Omron MX3 Plus monitor for blood pressure measurement in adolescents. Eur J Pediatr 2009;168:1349–54. https://doi.org/10.1007/s00431-009-0936-x.
[23] Navarro-Gonzálvez J a, García-Benayas C, Arenas J. Semiautomated measurement of nitrate in biological fluids. Clin Chem 1998;44:679–81.
https://doi.org/10.1093/clinchem/44.3.679.
[24] Jiang ZY, Hunt J V, Wolff SP. Ferrous ion oxidation in the presence of xylenol orange for detection of lipid hydroperoxide in low density lipoprotein. Anal Biochem
1992;202:384–9.
[25] Repetto M, Reides C, Gomez Carretero ML, Costa M, Griemberg G, Llesuy S.
Oxidative stress in blood of HIV infected patients. Clin Chim Acta 1996;255:107–17. [26] Hu ML. Measurement of protein thiol groups and glutathione in plasma. Methods
Enzymol 1994;233:380–5.
https://doi.org/10.1161/CIRCGENETICS.108.811638.
[28] Bastos AS, Loureiro APDM, de Oliveira TF, Corbi SCT, Caminaga RMS, Júnior CR, et al. Quantitation of malondialdehyde in gingival crevicular fluid by a
high-performance liquid chromatography-based method. Anal Biochem 2012;423:141–6. https://doi.org/10.1016/j.ab.2012.01.016.
[29] Venturini D, Simão ANC, Scripes N a, Bahls LD, Melo P a S, Belinetti FM, et al.
Evaluation of oxidative stress in overweight subjects with or without metabolic syndrome. Obesity (Silver Spring) 2012;20:2361–6.
https://doi.org/10.1038/oby.2012.130.
[30] Klisic A, Kocic G, Kavaric N, Pavlovic R, Soldatovic I, Ninic A. Nitric oxide products
are not associated with metabolic syndrome. J Med Biochem 2019;38:361–7. https://doi.org/10.2478/jomb-2018-0035.
[31] Abdilla N, Tormo MC, Fabia MJ, Chaves FJ, Saez G, Redon J. Impact of the
components of metabolic syndrome on oxidative stress and enzymatic antioxidant activity in essential hypertension. J Hum Hypertens 2007;21:68–75.
https://doi.org/10.1038/sj.jhh.1002105.
[32] Sun M, Huang X, Yan Y, Chen J, Wang Z, Xie M, et al. Rac1 is a possible link between obesity and oxidative stress in Chinese overweight adolescents. Obesity
2012;20:2233–40. https://doi.org/10.1038/oby.2012.63.
[33] Maslov LN, Naryzhnaya N V., Boshchenko AA, Popov S V., Ivanov V V., Oeltgen
PR. Is oxidative stress of adipocytes a cause or a consequence of the metabolic syndrome? J Clin Transl Endocrinol 2019;15:1–5.
https://doi.org/10.1016/j.jcte.2018.11.001.
Invest 2004;114:1752–61. https://doi.org/10.1172/JCI21625.
[35] Haszon I, Papp F, Kovács J, Bors M, Németh I, Bereczki C, et al. Platelet aggregation, blood viscosity and serum lipids in hypertensive and obese children. Eur J Pediatr
2003;162:385–90. https://doi.org/10.1007/s00431-003-1156-4.
[36] Mohn A, Catino M, Capanna R, Giannini C, Marcovecchio M, Chiarelli F. Increased oxidative stress in prepubertal severely obese children: effect of a dietary
restriction-weight loss program. J Clin Endocrinol Metab 2005;90:2653–8. https://doi.org/10.1210/jc.2004-2178.
[37] Khan MA, Baseer A. Increased malondialdehyde levels in coronary heart disease. J Pak Med Assoc 2000;50:261–4.
[38] Maes M, Galecki P, Chang YS, Berk M. A review on the oxidative and nitrosative stress (O&NS) pathways in major depression and their possible contribution to the (neuro)degenerative processes in that illness. Prog Neuro-Psychopharmacology Biol
Psychiatry 2011;35:676–92. https://doi.org/10.1016/j.pnpbp.2010.05.004. [39] Yang X, Li Y, Li Y, Ren X, Zhang X, Hu D, et al. Oxidative stress-mediated
atherosclerosis: Mechanisms and therapies. Front Physiol 2017;8:1–16. https://doi.org/10.3389/fphys.2017.00600.
[40] Matsuda M, Shimomura I. Increased oxidative stress in obesity: Implications for
metabolic syndrome, diabetes, hypertension, dyslipidemia, atherosclerosis, and cancer. Obes Res Clin Pract 2013;7:1–12. https://doi.org/10.1016/j.orcp.2013.05.004.
[41] Jezovnik M, Poredos P. Oxidative stress and atherosclerosis. Eur Soc Cardiol 2007;6:306–11.
[42] Jakus V, Bauerova K, Michalkova D, Carsky J. Values of markers of early and
[43] Steinberger J, Daniels SR, Eckel RH, Hayman L, Lustig RH, McCrindle B, et al.
Progress and challenges in metabolic syndrome in children and adolescents: a scientific statement from the American Heart Association Atherosclerosis,
Hypertension, and Obesity in the Young Committee of the Council on Cardiovascular Disease in the Young; Circulation 2009;119:628–47.
https://doi.org/10.1161/CIRCULATIONAHA.108.191394.
[44] Ziobro a, Duchnowicz P, Mulik A, Koter-Michalak M, Broncel M. Oxidative damages in erythrocytes of patients with metabolic syndrome. Mol Cell Biochem
2013;378:267–73. https://doi.org/10.1007/s11010-013-1617-7.
[45] Lepedda AJ, Zinellu A, Nieddu G, Zinellu E, Carru C, Spirito R, et al. Protein
sulfhydryl group oxidation and mixed-disulfide modifications in stable and unstable human carotid plaques. Oxid Med Cell Longev 2013;2013.
https://doi.org/10.1155/2013/403973.
[46] Hajer GR, van der Graaf Y, Olijhoek JK, Verhaar MC, Visseren FLJ. Levels of
homocysteine are increased in metabolic syndrome patients but are not associated with
an increased cardiovascular risk, in contrast to patients without the metabolic syndrome. Heart 2007;93:216–20. https://doi.org/10.1136/hrt.2006.093971.
[47] Morelli NR, Scavuzzi BM, Miglioranza LH da S, Lozovoy MAB, Simão ANC, Dichi
I. Metabolic syndrome components are associated with oxidative stress in overweight and obese patients. Arch Endocrinol Metab 2018;62:309–18.
https://doi.org/10.20945/2359-3997000000036.
[48] Correia-Costa L, Sousa T, Morato M, Cosme D, Afonso J, Areias JC, et al. Oxidative stress and nitric oxide are increased in obese children and correlate with
[49] Codoñer-Franch P, Tavárez-Alonso S, Murria-Estal R, Megías-Vericat J,
Tortajada-Girbés M, Alonso-Iglesias E. Nitric oxide production is increased in severely obese children and related to markers of oxidative stress and inflammation. Atherosclerosis
2011;215:475–80. https://doi.org/10.1016/j.atherosclerosis.2010.12.035.
[50] Bitar MS, Wahid S, Mustafa S, Al-Saleh E, Dhaunsi GS, Al-Mulla F. Nitric oxide dynamics and endothelial dysfunction in type II model of genetic diabetes. Eur J
Pharmacol 2005;511:53–64. https://doi.org/10.1016/j.ejphar.2005.01.014.
[51] Rani V, Deep G, Singh RK, Palle K, Yadav UCS. Oxidative stress and metabolic
disorders: Pathogenesis and therapeutic strategies. Life Sci 2016;148:183–93. https://doi.org/10.1016/j.lfs.2016.02.002.
[52] Chedraui P, Escobar GS, Ramírez C, Pérez-López FR, Hidalgo L, Mannella P, et al. Nitric oxide and pro-inflammatory cytokine serum levels in postmenopausal women with the metabolic syndrome. Gynecol Endocrinol 2012;28:787–91.
https://doi.org/10.3109/09513590.2012.671395.
[53] Wang J-Y, Chen Y-L, Hsu C-H, Tang S-H, Wu C-Z, Pei D. Predictive value of serum
uric acid levels for the diagnosis of metabolic syndrome in adolescents. J Pediatr 2012;161:753–6. https://doi.org/10.1016/j.jpeds.2012.03.036.
[54] Mangge H, Zelzer S, Puerstner P, Schnedl WJ, Reeves G, Postolache TT, et al. Uric
acid best predicts metabolically unhealthy obesity with increased cardiovascular risk in youth and adults. Obesity 2013;21:E71-77. https://doi.org/10.1002/oby.20061.
[55] Zaki ME, El-Bassyouni H, Kamal S, El-Gammal M, Youness E. Association of serum paraoxonase enzyme activity and oxidative stress markers with dyslipidemia in obese adolescents. Indian J Endocrinol Metab 2014;18:340–4.
https://doi.org/10.4103/2230-8210.131173.
Impaired paraoxonase-1 status in obese children. Relationships with insulin resistance
and metabolic syndrome. Clin Biochem 2013;46:1830–6. https://doi.org/10.1016/j.clinbiochem.2013.08.020.
[57] Krzystek-Korpacka M, Patryn E, Hotowy K, Czapińska E, Majda J,
Kustrzeba-Wójcicka I, et al. Paraoxonase (PON)-1 activity in overweight and obese children and adolescents: association with obesity-related inflammation and oxidative stress. Adv
Clin Exp Med 2013;22:229–36.
[58] Eren E, Abuhandan M, Solmaz A, Taşkın A. Serum paraoxonase/arylesterase activity
and oxidative stress status in children with metabolic syndrome. JCRPE J Clin Res Pediatr Endocrinol 2014;6:163–8. https://doi.org/10.4274/jcrpe.1454.
[59] Aviram M, Rosenblat M, Bisgaier CL, Newton RS, Primo-Parmo SL, La Du BN. Paraoxonase inhibits high-density lipoprotein oxidation and preserves its functions. A possible peroxidative role for paraoxonase. J Clin Invest 1998;101:1581–90.
Table 1. Clinical and socio-demographic data, and biochemical, inflammatory and oxidative stress biomarkers in adolescents with and without metabolic
syndrome (MetS).
Variables No MetS (n=94) MetS (n=47) F df p-values
Age (years) 13.02(±1.53) 13.04(±1.71) 0.006 1/139 0.940
Gender (M/F) 53 / 41 27 / 20 0.01 1 0.904
TUD (no / yes) 88 / 6 42 / 5 0.79 1 0.374
Body weight (kg) 54.73(±11.23) 68.63(±17.08) 33.47 1/139 <0.001
BMI (kg/m2) 22.03(±3.59) 26.97(±4.80) 46.98 1/139 <0.001
WC (cm) 71.52(±7.41) 82.56(±9.89) 55.25 1/139 <0.001
Systolic blood pressure (mm Hg) 112.49(±11.08) 124.38(±10.08) 38.29 1/139 <0.001
Diastolic blood pressure (mm Hg) 64.54(±6.99) 70.65(±7.29) 23.24 1/139 <0.001
Glucose (mg/dL) 89.47(±4.97) 94.43(±7.30) 22.55 1/139 <0.001
Insulin*(µU/mL) 7.04(±4.52) 14.90(±9.31) 50.41 1/130 <0.001
Total cholesterol (mg/dL) 162.76(±31.86) 165.55(±29.54) 0.25 1/139 0.615
HDL-C(mg/dL) 49.19(±11.23) 34.15(±5.71) 74.43 1/139 <0.001
Triglycerides*
(mg/dL)
66.53(±29.07) 131.87(±114.32) 43.77 1/139 <0.001
NOx (uM/L) 4.13(±1.57) 4.75(±2.15) 3.73 1/139 0.06
LOOH (mM/L) 0.75(±0.22) 0.77(±0.22) 0.15 1/139 0.69
TRAP (uM Trolox) 867.46(±118.13) 899.47(±131.70) 2.19 1/139 0.15
Uric acid (mg/dL) 4.66(±1.15) 5.48(±1.32) 12.75 1/122 0.001
TRAP/Uric acid 193.92(±40.03) 171.21(±33.40) 9.95 1/122 0.002
TNF-α*(pg/mL) 17.41(±27.87) 24.52(±67.49) 0.58 1/139 0.45
PON-1 (U/mL) 206.70(±52.11) 205.32(±45.50) 0.02 1/139 0.88
SH-group (uM/mg PT) 41.97(±6.19) 43.92(±7.37) 2.71 1/137 0.10
MDA (uM/mg PT) 99.50(±19.07) 109.61(±19.48) 8.61 1/137 0.004
All results are shown as mean (±SD). All results of ANOVAs.
*These variables are processed in Ln transformation.
TUD: tobacco use disorder; BMI: body mass index; WC: waist circumference; HDL-C: high-density lipoprotein cholesterol; LDL-C: low-density lipoprotein
cholesterol.
NOx: nitric oxide metabolites. LOOH: lipid hydroperoxides. TRAP: Total radical-trapping antioxidant parameter. TNF-α: Tumor necrosis factorα; PON-1:
Table 2. Results of binary logistic regression analysis with metabolic syndrome as dependent variable (healthy controls as reference group) and the
inflammatory, oxidative stress and antioxidant biomarkers as explanatory variables.
Explanatory
Variables
B S.E Wald df p Odds ratio Lower
CI 95%
Upper
CI 95%
#1 NOx 0.331 0.165 4.03 1 0.046 1.39 1.01 1.93
TRAP/Uric acid -0.514 0.183 7.85 1 0.005 0.60 0.42 0.86
MDA 0.471 0.168 7.89 1 0.005 1.60 1.15 2.22
#2 MDA 1.127 0.283 15.87 1 <0.001 3.09 1.77 5.37
HDL-cholesterol -3.720 0.595 39.10 1 <0.001 0.02 0.01 0.08
NOx 0.505 0.233 4.69 1 0.030 1.66 1.05 2.62
#3 MDA 1.098 0.409 7.20 1 0.007 3.00 1.35 6.69
BMI 1.474 0.448 10.83 1 0.001 4.37 1.82 10.51
Glucose 1.574 0.441 12.72 1 <0.001 4.83 2.03 11.47
Insulin 1.041 0.586 3.16 1 0.075 2.83 0.90 8.93
HDL-cholesterol -3.584 0.849 17.82 1 <0.001 0.03 0.01 0.147
NOx: nitric oxide metabolites; TRAP: Total radical-trapping antioxidant parameter; MDA: malondialdehyde; BMI: body mass index.
All explanatory variables are entered in z scores
Table 3. Association between the metabolic syndrome (MetS) and the International Obesity Task Force classification into subjects with a normal body mass
index (BMI), overweight and obesity.
Groups Normal BMI Overweight Obesity
No MetS 55 (58.51%) 28 (29.78%) 11 (11.70%)
Table 4. Results of multivariate GLM analysis which examine the association between nitro-oxidative biomarkers and diagnoses.
Tests Dependent variables
Explanatory
variables F df p
Partial η2
Multivariate*
MDA, uric acid, SH groups, TRAP, glucose, insulin, HDL-C, and triglycerides.
MetS 13.39 8/127 ˂0.001 0.459
IOTF 2.75 16/256 <0.001 0.147
Sex 3.88 8/127 <0.001 0.197
Age 3.15 8/127 0.003 0.166
Smoking 1.00 8/127 0.436 0.059
Univariate*
Glucose MetS
34.26 1/134 <0.001 0.204
Insulin MetS
26.87 1/134 <0.001 0.167
HDL-C MetS
39.01 1/134 <0.001 0.225
Triglycerides MetS
22.67 1/134 <0.001 0.145
MDA MetS
10.03 1/134 0.002 0.070
-SH MetS
5.08 1/134 0.026 0.037
Triglycerides IOTF
5.99 1/135 0.016 0.042
Uric acid IOTF
13.25 1/135 <0.001 0.089
classes.
Figure 2. Results of Soft Independent Modeling of Class Analogy (SIMCA) showing the discrimination power of the input variables. The top-4 discriminatory variables are in descending order: glucose, HDL-C, MDA, and body mass index (BMI) followed at a distance by
by NOx (nitric oxide metabolites), TRAP (total radical-trapping potential of plasma), and paraoxonase-1 (PON1). Sex, uric acid, LOOH (lipid
obesity/overweight, age, sex, and tobacco use disorder (TUD). No differences in the other biomarkers were detected including TRAP (total radical
Figure 5. Uric acid and triglycerides are significantly higher and high density lipoprotein (HDL) cholesterol significantly lower in overweight and obesity as compared with healthy controls (HC) after adjusting for metabolic syndrome, age, sex, and tobacco use disorder