IJPSR (2019), Volume 10, Issue 1 (Research Article)
Received on 27 April 2018; received in revised form, 11 July 2018; accepted, 18 July 2018; published 01 January 2019
HPLC METHOD FOR ESTIMATION OF DRUG RELEASE OF SOFOSBUVIR IN PHARMACEUTICAL FORMULATION
Kaushlendra Singh *1, 2, Sachin Bhatt 1 and Ramesh Prasad 1, 2
Department of Chemistry 1, Sarvepalli Radhakrishnan University, Bhopal - 462026, Madhya Pradesh, India.
Macleods Pharmaceuticals Limited 2, Mumbai - 400093, Maharashtra, India.
ABSTRACT: Pharmaceutical industry and quality control laboratories needs of robust methods for analysis of drugs used in the treatment of life-threatening diseases such as hepatitis C. Using HPLC technique, a rapid, selective, precise and accurate method was developed and validated for the estimation of % drug release of Sofosbuvir in a pharmaceutical formulation. Stability indicating HPLC method was developed using Zorbax eclipse plus C18 (100 × 4.6 mm), 3.5 µ as analytical column and a combination of ammonium acetate buffer pH 5.3 and methanol in the ratio (45: 55) was used as mobile phase in isocratic mode. UV detection was carried out at 260 nm, column temperature was maintained at 25 °C, and the flow rate was 1.5 ml/min. The method was validated as per internationally accepted ICH guideline and found to be specific for blank and placebo solution, precise, robust, accurate and linear in range 9.2 to 69.0 µg/ml of Sofosbuvir. This method can be used for routine analysis of pharmaceutical formulation in any quality control laboratory leading to delivery of good quality healthcare solution.
INTRODUCTION: Hepatitis C disease is a disease of the liver which is caused by the hepatitis C virus. Sofosbuvir is helpful in the treatment of chronic hepatitis C (CHC) infection. Sofosbuvir (SOF) is a hepatitis C virus (HCV) nucleotide analog NS5B polymerase inhibitor indicated for the treatment of genotype 1, 2, 3 or 4 chronic hepatitis C virus (HCV) infection in adults. Sofosbuvir is absorbed with a peak plasma concentration
observed at, 0.52 h post-dose. Following absorption, Sofosbuvir is metabolized in hepatocytes, where it is converted to the active nucleoside triphosphate form 1.
QUICK RESPONSE CODE
DOI:
10.13040/IJPSR.0975-8232.10(1).367-72
The article can be accessed online on
www.ijpsr.com
DOI link: http://dx.doi.org/10.13040/IJPSR.0975-8232.10(1).367-72
Very few research papers are available for estimation of the content of Sofosbuvir in a pharmaceutical formulation. A reverse phase HPLC method is reported for the estimation of the content of Sofosbuvir in tablets 2, 3, RP-HPLC method is available for simultaneous estimation of Sofosbuvir and Ledipasvir in tablet dosage form 4, RP-HPLC method is available for simultaneous estimation of Sofosbuvir and Velpatasvir in tablet dosage form 5,
6
. But no HPLC method is available for determination of in-vitro drug release of Sofosbuvir in a pharmaceutical formulation.
FIG. 1: CHEMICAL STRUCTURE OF SOFOSBUVIR Keywords:
A pharmaceutical formulation, Dissolution, HPLC, UV, Sofosbuvir
Correspondence to Author: Kaushlendra Singh
Team Leader,
Macleods Pharmaceuticals,
Hiral Green Building, Flat no. - 120, E-wing, Mira Road (East) - 401107, Maharashtra, India.
In this research work, HPLC is used for estimation of drug release of Sofosbuvir (S)-Isopropyl 2-((S)-(((2R, 3R, 4R, 5R)-5 -(2, 4-dioxo-3, 4-dihydro pyrimidine-1 (2H) -yl)- 4- fluoro- 3- hydroxy-4-methyl tetrahydrofuran-2-yl) methoxy)-(phenoxy) phospho- rylamino) propanoate Fig. 1.
MATERIALS AND METHODS:
Reagents and Materials: All reagents used for method development purpose were of Analytical Reagent Grade. Acetonitrile (Merck) and methanol (Merck), orthophosphoric acid (Rankem), ammonium acetate (Merck) sodium hydroxide (Rankem) and potassium dihydrogen orthophosphate (Merck) were used for solution and mobile phase preparations. Milli-Q water was used for all solution preparations. Working standards of
Sofosbuvir were obtained from Macleods
Pharmaceuticals Limited, Mumbai, India.
[image:2.612.50.300.426.517.2]Determination of Wavelength Maxima: Diluted solutions of Sofosbuvir were prepared, and the absorption spectrum was obtained in the UV range using UV-Vis Spectrophotometer. λmax of Sofosbuvir was determined from the respective absorption spectrum of the drugs. 260 nm was found to be suitable based on UV spectrum Fig. 2.
FIG. 2: UV ABSORPTION SPECTRA OF SOFOSBUVIR
Chromatographic System: Shimadzu HPLC with UV-Visible detector and quaternary gradient pump was used for this study. Zorbax eclipse plus C18 (100 × 4.6 mm), 3.5 µ HPLC column was used for chromatographic separation. Ammonium acetate buffer with pH 5.3 and methanol was used as mobile phase in an isocratic mode in the ratio (45:55) respectively. The flow rate was 1.5 ml/min, and detection was carried out at 260 nm. HPLC was equipped with Lab solutions software for data collection.
Solution Preparation: Standard Preparation:
Sofosbuvir Standard Solution: About 46 mg of Sofosbuvir was accurately weighed, dissolved in
the diluent and made up to volume with dissolution medium in a 50 ml volumetric flask. 5 ml of Sofosbuvir standard solution was further diluted to 100 ml with dissolution medium and mixed.
Sample Preparation: In dissolution tester, 900 ml of dissolution medium was poured in each dissolution vessel. To obtain 37 °C ± 0.5 °C sufficient time was allowed for the dissolution medium. USP type II (paddle) was used as a stirring element and speed adjusted to 75 rpm. At the end of specified time, 10 ml aliquot was withdrawn using a sampling cannula and filtered immediately through Whatman GF/C filter paper, discarding first 5 ml of the filtrate. Further diluted 5 ml to 50 ml with dissolution media, mixed.
Dissolution Parameter Selection: Based on USFDA recommendation for Sofosbuvir tablets, dissolution parameters should be set as 900 ml of phosphate buffer pH 6.8 with paddle apparatus rotating at 75 rpm. Same was selected for the present research work.
Mobile Phase Optimisation: Mobile phase was optimized to achieve shorter run time and longer HPLC column life. Ammonium acetate buffer at pH 5.3 was evaluated and found to be suitable.
HPLC Column Optimisation: Zorbax eclipse plus C18 (100 mm × 4.6 mm), 3.5 µ was the column of choice. 100 mm column was chosen to achieve a shorter run time with sharper peak shapes.
Selection of HPLC Pump Mode: Sofosbuvir retain more with a low solvent mobile phase. Hence a mixture of ammonium acetate pH 5.3 and methanol in the ratio (45:55) respectively with a flow rate of 1.5 ml/min was chosen to elute Sofosbuvir within 5 min run time.
Diluent Optimisation: Due to higher solubility and longer stability of Sofosbuvir, water, and acetonitrile in the ratio of 60:40 was chosen as diluent.
RESULTS AND DISCUSSION:
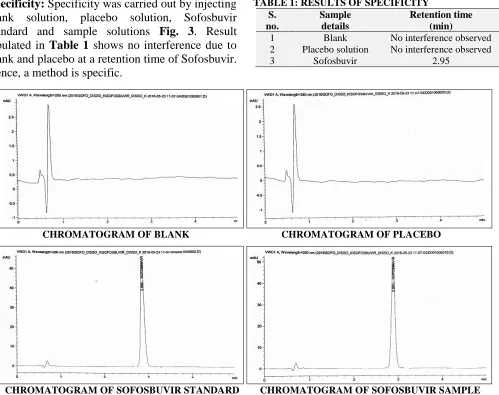
Specificity: Specificity was carried out by injecting blank solution, placebo solution, Sofosbuvir standard and sample solutions Fig. 3. Result tabulated in Table 1 shows no interference due to blank and placebo at a retention time of Sofosbuvir. Hence, a method is specific.
TABLE 1: RESULTS OF SPECIFICITY S.
no.
Sample details
Retention time (min)
1 Blank No interference observed 2 Placebo solution No interference observed
3 Sofosbuvir 2.95
CHROMATOGRAM OF BLANK CHROMATOGRAM OF PLACEBO
CHROMATOGRAM OF SOFOSBUVIR STANDARD CHROMATOGRAM OF SOFOSBUVIR SAMPLE
FIG. 3: CHROMATOGRAMS OF SPECIFICITY
Solution Stability: Solution stability was calculated and evaluated by storing standard and sample solutions at 25 °C to 24 h. The absolute difference between solutions after storing for 24 h
at 25 °C concerning the initial solution was within the acceptance criteria of not more than 2. Results are tabulated in Table 2.
TABLE 2: RESULTS OF SOLUTION STABILITY
Time (h)
Sofosbuvir standard Sofosbuvir Sample
Area Absolute difference Area Absolute difference
0 315215 - 272977 -
16 314454 0.2 272540 0.2
24 314277 0.3 271756 0.4
Filter Compatibility: Sample solution was prepared by spiking Sofosbuvir into placebo powder containing equivalent to one dosage unit. At filtration stage, a solution of Sofosbuvir tablets was filtered through Whatman GF/C filter (25 mm). First 5.0 ml of filtrate was discarded. The filtrate was collected for further analyzed. The unfiltered sample solution was centrifuged. The absolute difference between the results obtained for the centrifuged solution and filtered solution of
Sofosbuvir tablets is tabulated in Table 3. The absolute difference between the results obtained for the centrifuged sample solution and filtered sample solution was within acceptance criteria of NMT 2.
TABLE 3: RESULTS OF FILTER COMPATIBILITY STUDY
Filter type
Sofosbuvir sample Area Absolute difference
Hence, Whatman GF/C (25 mm) filter is considered suitable for sample filtration.
Filter Saturation: At the filtration stage, three filtrates were obtained using three separate Whatman GF/C filters (25 mm) by discarding 1 ml, 3 ml, and 5 ml respectively. The filtrates were collected for further analysis. The absolute difference between the results obtained for sub-sequently filtered solutions is tabulated in Table 4. TABLE 4: RESULTS OF FILTER SATURATION STUDY
Volume discarded
Sofosbuvir sample
Area Absolute difference
1 ml 292812 2.2
3 ml 293553 2.0
5 ml 294504 1.3
The absolute difference at 5 ml for filtered solutions was found to be within acceptance criteria of NMT 2. Hence, 5 ml volume was considered as sufficient to saturate the filter.
Accuracy: Accuracy study was performed at 50% of 100% and 120% of the working concentration of active ingredient. Recovery solutions were prepared by spiking Sofosbuvir stock solution prepared to placebo powder in a specified volume of dissolution medium. Results tabulated in Table 5 show that method is accurate.
TABLE 5: RESULTS OF ACCURACYSTUDY Sofosbuvir
Level Area % Recovery
50 % 193570 99.2
193592 99.3
192973 99.2
100% 314281 99.5
315074 99.7
315183 99.8
120% 382451 100.9
384022 101.3
382814 101.0
Mean % Recovery 100.0
Linearity: By using standard stock solution a series of diluted solutions were prepared to obtain solutions at 20% to 150% of the working concentration of active ingredient Fig. 4. Each solution was injected, and the peak area was recorded. Slope, Y-intercept and Correlation coefficient of the regression line were calculated. Results are tabulated in Table 6. The correlation coefficient is well within acceptance criteria of not less than 0.999.
FIG. 4: LINEARITY CHART OF SOFOSBUVIR
TABLE 6: RESULTS OF LINEARITY
% Level
Sofosbuvir
Concentration (ppm) Area
20 9.2 63119
50 23.0 156498
80 37.5 255015
100 46.0 315530
120 55.2 383053
150 69.0 489072
Slope 7090.8
Y-Intercept 6596.3
Correlation coefficient 0.9992
Precision: Precision test was carried out at 100 % level of target concentration. Six sample preparations were prepared and injected. The mean and relative standard deviation of the results was calculated. The results obtained for % release are tabulated in Table 7.
TABLE 7: RESULTS OF PRECISION
Sofosbuvir Area % Release
Sample-1 297555 99.3 Sample-2 290301 96.7 Sample-3 290210 96.5 Sample-4 278905 93.2 Sample-5 283512 94.4 Sample-6 294110 97.8
Mean 96.3
% RSD 2.3
TABLE 8: RESULTS OF INTERMEDIATE PRECISION
Sofosbuvir
Area % Release
Sample-1 293.316 99.3
Sample-2 296.167 96.7
Sample-3 292.319 96.5
Sample-4 300.315 93.2
Sample-5 286.069 94.4
Sample-6 295.569 97.8
Mean 96.6
% RSD 1.7
TABLE 9: COMPARATIVE RESULTS OF PRECISION AND INTERMEDIATE PRECISION
Content Mean %
release in precision
Mean % release in intermediate
precision
Absolute difference
Sofosbuvir 96.3 96.6 0.3
Based on the above results, it was concluded that the method is precise.
Robustness: Robustness of the method was evaluated by making the following alterations in the analytical parameters.
Changing the flow of mobile phase (1.3 ml/ min, 1.7 ml/min)
Changing the rpm of the dissolution medium (73 rpm, 77 rpm)
Results for analysis with the above-mentioned alterations are tabulated in Table 10. Comparative results tabulated in Table 11 shows that the method is robust for deliberate changes in methodology.
TABLE 10: RESULTS OF ROBUSTNESS
Unit % Release of Sofosbuvir
Unaltered Dissolution 73 rpm Dissolution 77 rpm Flow 1.3 ml/min Flow 1.7 ml/min
1 99.3 97.5 98.2 96.0 97.0
2 96.7 97.0 96.3 96.0 95.1
3 96.5 94.0 95.8 92.8 94.3
4 93.2 97.0 92.8 95.5 91.8
5 94.4 94.9 93.8 93.4 92.7
6 97.8 95.8 97.4 94.5 96.3
Mean 96.3 96.0 95.7 94.7 94.5
% RSD 2.3 1.4 2.2 1.4 2.1
TABLE 11: COMPARATIVE RESULTS OF ALTERED
vs. UNALTERED CONDITION S. no. Changed parameter Sofosbuvir Mean % release Absolute difference
1 Unaltered 96.3 -
2 RPM 73 96.0 0.3
3 RPM 77 95.7 0.6
4 Flow 1.3 94.7 1.6
5 Flow 1.7 94.5 1.8
CONCLUSION: HPLC method developed for dissolution of Sofosbuvir tablets has been proved to be simple, accurate, precise and robust to changes in analytical methodology. This method can be used for estimation of % release of Sofosbuvir in the pharmaceutical formulation in quality control laboratory of any pharmaceutical industry.
ACKNOWLEDGEMENT: The author is grateful to the Research and Development Center of Macleods Pharmaceuticals Limited, Mumbai, India, for granting permission to use the Analytical Research and Development section for this research work. The author is also thankful to his colleagues for providing all the facilities to carry out the research work.
CONFLICT OF INTEREST: There is no conflict of interest
REFERENCES:
1. Sovaldi tablets prescribing information, Gilead Sciences, Inc.https://www.accessdata.fda.gov/drugsatfdadocs/label/2 015/204671s002lbl.pdf
2. Vejendla R, Subramanyam CVS and Veerabhadram G: Estimation and validation of a Sofosbuvir in bulk and tablets dosage form by RP- HPLC. International Journal Pharmaceutical 2016; 121-127. 3. Shaikh SN and Dabhade MP: Development and validation
of RP-HPLC method for quantitative analysis of Sofos-buvir in a pure and pharmaceutical formulation. World Journal of Pharmacy and Pharmaceutical Sciences 2017; 6(8): 2249-2258.
4. Zaman B, Siddique F and Waseem: RP-HPLC method for simultaneous determination of Sofosbuvir and Ledipasvir in the tablet dosage form and its application to in-vitro
dissolution studies. Chromatographia 2016; 79: 1605-1613.
5. Jahnavi B and Ganapaty S: Stability indicating RP-HPLC method development and validation for the simultaneous determination of Sofosbuvir and Velpatasvir in tablet dosage forms. Indian Journal of Pharmaceutical and Biological Research (IJPBR) 2017; 5: 10-16.
7. ICH guidance Validation of Analytical Procedures, Text and Methodology Q2-R1; 2005.
8. Mohan VP, Satyanarayana T, Vinod KD, Mounika E, Sri Latha M, Anusha R and Satish Y: Development and validation of new RP-HPLC method for the determination
of Sofosbuvir in pure form. World Journal of Pharmacy and Pharmaceutical Sciences 2006; 5: 775-781.
9. Asselah T: Sofosbuvir for the treatment of hepatitis C virus. Expert Opin Pharmacother 2014; 15: 121-130.
All © 2013 are reserved by International Journal of Pharmaceutical Sciences and Research. This Journal licensed under a Creative Commons Attribution-NonCommercial-ShareAlike 3.0 Unported License.
This article can be downloaded to ANDROID OS based mobile. Scan QR Code using Code/Bar Scanner from your mobile. (Scanners are available on Google Play store)
How to cite this article: