Copyright © 1998, American Society for Microbiology
Comparative Study of Different Standardization Concepts in
Quantitative Competitive Reverse Transcription-PCR Assays
GERD HABERHAUSEN,* JUDITH PINSL, CARL-CHRISTOPH KUHN,
AND
CHRISTINE MARKERT-HAHN
Department of New Technologies, Laboratory Systems, Boehringer-Mannheim GmbH, D-82372 Penzberg, Germany
Received 7 July 1997/Returned for modification 3 October 1997/Accepted 18 November 1997
Four different standardization approaches based on a competitive reverse transcription (RT)-PCR assay
were compared with a noncompetitive assay based on an external standard curve. Criteria for assessment were
accuracy in quantitation, correctness of recovery, sensitivity, dynamic range, reproducibility, throughput, and
convenience of sample handling. As a model system, we used the 5
*
-noncoding region of hepatitis C virus
(HCV) for amplification in all quantitative RT-PCRs. A computer program that allowed parallel data
pro-cessing was developed. Surprisingly, all methods were found suitable for accurate quantitation and comparable
with respect to the criterion correctness of recovery. All results differed only by a factor of about 2. The reason
for this finding might be that all of our mimics, as well as the wild-type genome of HCV, exhibited exactly the
same amplification and hybridization efficacy. Moreover, minimal competition occurred in our experiments
over a 5-log dynamic range. A further topic of our investigation was the comparison of two different competitive
RNA fragments, mimics, with regard to their suitability as internal standards. One was a heterologous mimic,
in which only the primer binding sites were identical to the wild type. The second one was a homologous mimic
identical to the wild type except for a small region used for differential hybridization, which was replaced by
a permutated sequence of the same length. Both the homologous and heterologous internal mimics were found
appropriate for an accurate competitive RT-PCR assay, provided that amplification efficacy, as well as capture
efficacy, is proven identical for both analyte and mimic.
Quantitation of nucleic acids has become an essential tool in
molecular diagnostics. These quantitative determinations are
helpful not only in understanding the progress of infectious
diseases but also in monitoring antiviral drug therapy, e.g., for
human immunodeficiency virus (HIV) or hepatitis C virus
(HCV). In the past few years, there have been many
publica-tions dealing with the quantitation of PCR products. The first
approaches were only semiquantitative and were based on
limiting dilution of the analyte (25). Other methods used
ex-ternal standard curves for quantitation (27) or low-stringency
PCR (4). None of these approaches overcame the problem of
inhibition of individual probes. As a consequence, the next
generation focused on amplification reactions that were
inter-nally controlled, either by coamplification of internal
endoge-nous standards, such as housekeeping genes (5, 16), or by
introduction of an artificial exogenous mimic fragment (2, 9,
26). For detailed reviews, see Clementi et al. (6, 7).
This last approach was finally established in the molecular
diagnosis of many infectious disease parameters, either in
com-mercially available tests or in in-house assays. A greater
diver-sity can be found among standardization concepts. Frequently,
a serial-dilution method (referred to here as method A) (Table
1), where either the analyte is diluted and coamplified with a
constant amount of internal mimic or vice versa (16, 20, 22), is
applied. Another common standardization format is based on
the generation of an external standard curve, where known and
increasing amounts of cloned wild-type fragments are
coam-plified with one constant amount of a mutated competitor
mimic (method B) (Table 1). A third standardization method
(method C) (Table 1) relies on a standard curve generated only
by one mutated mimic template (18). A fourth standardization
approach is even more simple and requires no standard curve
(method D) (Table 1). In addition to the above internally
controlled amplifications, an external standardization and/or
quantitation approach based on a noncompetitive reverse
tran-scription (RT)-PCR was also compared in our investigation
(method E) (Table 1).
The aim of the present study was to compare all five
stan-dardization approaches in one distinct and well-described
for-mat. This was done both in a model system using two cloned
mimic fragments, pHCV-st1 and pHCV-wt1, and with clinical
material (HCV-positive plasma samples). The second purpose
of our investigation was to compare different RNA
competi-tors with respect to their capability to mimic the overall
RT-PCR efficacy. In vitro transcription and amplification has to be
identical for both internal mimic and analyte in order to ensure
accurate quantitation in a given dynamic range. This is usually
considered for mimics of the same size as the wild-type
tem-plate. But some have proposed that even the sequence itself
and the nucleotide content of both templates play an
impor-tant role in the above-mentioned efficacy (19). In order to
clarify this, we cloned and compared two different mimics, both
of the same length as the amplified wild-type region but
dif-fering in sequence.
MATERIALS AND METHODS
Patient samples. All plasma samples were from patients with historically proven hepatitis. Viral (HCV) status was determined by HCV antibody testing using the Abbott enzyme immunoassay and was confirmed by RT-PCR using the Amplicor HCV kit (Roche Molecular Systems).
Cloning and preparation of the mimics.First, an unmodified wild-type stan-dard, pHCV-wt1, was cloned based on amplification of wild-type HCV with primers KY80 (forward) and KY78 (reverse), both described by Young et al. (29), followed by blunt-end ligation into the vector pBluescript SK1(Stratagene, Heidelberg, Germany).
Subsequently, the homologous standard, pHCV-st1, was obtained from pHCV-wt1 by site-directed mutagenesis as described in Ho et al. (12). The
* Corresponding author. Mailing address: Boehringer-Mannheim
GmbH, Department LP-DN, Nonnenwald 2, D-82372 Penzberg,
Germany. Phone: 49 8856 602666. Fax: 49 8856 602819. E-mail:
[email protected].
628
on May 15, 2020 by guest
http://jcm.asm.org/
capture region was replaced by part of a sequence (21 bp) from a plastid-encoded gene (rbcL) of a green plant (11). This was done to avoid any cross-reactions between capture probe and human, animal, bacterial, or viral sequences. The 21-bp fragment (Ip102) has the same length, A1T content, and G1C content as the wild-type (p102) but differs from it in sequence.
The heterologous standard, pHCV-st2, also based on the above-mentioned primers, was constructed by using the PCR-mimic construction kit (Clontech, Palo Alto, Calif.). This fragment is derived from the v-erb B oncogene (24). The sequences of all standards were confirmed according to their ancestral sources. For RNA production, all standards were transcribed in vitro (1), treated twice with phenol and once with chloroform, and finally purified by gel filtration (Quick Spin columns; Boehringer Mannheim, Penzberg, Germany). The remain-ing DNA was digested twice with DNase I (Boehrremain-inger Mannheim), and RNA was checked for purity by PCR omitting the RT step and using Taq polymerase instead of Tth polymerase. The concentration of the RNA was determined photometrically by measuring the optical density at 260 nm. RNA was then serially diluted in water and frozen as aliquots at280°C. These aliquots were stable for months without any degradation. The terms st1, st2, and wt1, used below, refer to the RNAs of the plasmids pHCV-st1, pHCV-st2, and pHCV-wt1, respectively.
Sample preparation.Total RNA from HCV-positive plasma was extracted according to a method described in principle by Boom et al. (3) but slightly modified. In brief, virus particles present in 500ml of plasma were lysed in a total volume of 1 ml in the presence of guanidinium isothiocyanate during a 10-min incubation at room temperature. Binding of both nucleic acids (genomic RNA and mimic RNA) to glass magnetic particles took place in a buffer containing chaotropic salts, isopropanol, and silica surfaces. Unspecifically bound material was removed by several washing steps. Finally, nucleic acids were eluted in a total volume of 100ml at 80°C for 15 min. Ten microliters from the eluate was used for RT-PCR. In our model system, when only RNA competitor mimics were used, sample preparation was carried out in HCV-negative plasma in order to compensate for matrix effects.
RT-PCR assays.The 59-untranslated region of the HCV genome was used for amplification, since this region is known to be the most conserved among dif-ferent HCV genotypes (14, 25). Primers used for in vitro transcription as well as amplification were KY80 and KY78; the latter was biotinylated, corresponding to our detection format (see below). Our RT-PCR protocol was performed as a one-step assay in a total volume of 100ml containing 50 mM bicine, 115 mM potassium acetate, 8% (vol/vol) glycerol, 2.5 mM manganese acetate, 0.2 mM (each) dATP, dCTP, and dGTP, 0.6 mM dUTP, 0.3mM each primer, and 10 U of Tth polymerase. In all amplifications, 2 U of heat-labile uracil-N-glycosylase (UNG) was used to control carryover of amplicons and to reduce background signals. All reagents were from Boehringer Mannheim GmbH. RT-PCR was performed in a PE 9600 thermocycler (Perkin-Elmer Applied Biosystems) ac-cording to the following procedure. A 10-min incubation at 37°C (which allows UNG to digest possible amplicon contaminations) was followed by a RT reaction for 30 min at 60°C. Subsequently, RNA-DNA heteroduplexes were denatured for 1 min at 95°C. PCR amplification proceeded with 35 cycles at 95°C for 15 s and 60°C for 20 s, followed by a final extension at 72°C for 10 min. PCR products were kept at 50°C on the thermocycler until detection in order to circumvent UNG renaturation.
Detection protocol.For detection of amplified material, we used a very sen-sitive nonisotopic approach based on electrochemiluminescence (ECL). A ru-thenium-tris(bipyridyl)-labeled oligonucleotide (capture probe) was hybridized specifically to the biotinylated denatured amplicon. Subsequent, this hybrid was bound to the surface of streptavidin-coated magnetic beads. After the beads were captured on an electrode by using a permanent magnet, the ECL reaction of the ruthenium label was triggered by voltage application. For details of the ECL detection process, see Hoyle et al. (13). The totally automated ECL detection was performed on an instrumental platform (preprototype of Elecsys 1010; Boehringer Mannheim GmbH).
Capture probes used for hybridization with the wild-type and different mimic amplicons were as follows: p102 (for the wild type standard, pHCV-wt1), 59-G TCGTGCAGCCTCCAGGACCC-39; Ip102 (for the homologous mimic, pHCV-st1); 59-GGGGTAATGCGCCAGGTGCCG-39; and probe 3 (for the heterolo-gous mimic, pHCV-st2), 59-CCACACCAGGGCTTTTTCAACTGC-39. All cap-ture probes were ruthenium labeled at their 59ends.
Standardization methods.All RNA mimics were processed (unless otherwise stated) throughout the sample preparation with an initial concentration of 23
103to 23107copies per ml. Assuming that no loss occurs after sample
prep-aration, this corresponds to 102to 106copies of RNA per RT-PCR assay. Since
no sample preparation process leads to a quantitative isolation of nucleic acids, the real copy number in our assay is lower than this.
(i) Method A—internal standard curve.The sample to be determined (clinical plasma or wt1 RNA) was spiked with a serial dilution (102to 106copies per
assay; see above) of competitor mimic st1. Subsequent, five RT-PCRs were carried out, and the amplicon of each reaction was split and hybridized with its corresponding specific probe. Either all signal values were plotted onto a double-log scale and quantitation was made graphically, or, for greater accuracy, signal values were processed mathematically with our software tool.
(ii) Method B—external standard curve with two RNAs.Method B was first described by Gerna et al. (8) and was subsequently used for different applications (20, 23). First, a standard curve was generated by coamplification of increasing amounts of wt1 RNA (102to 106copies) and a constant amount of competitor
mimic st1 (103copies per assay). Signal ratios from differential hybridizations
(wt1/st1) were plotted onto a double-log scale against the initial wt1 RNA concentration. Quantitation of individual HCV samples was then obtained by coamplifying each sample with the same amount of st1 RNA (103copies) and
then mathematically plotting the signal ratio between the sample and st1 RNA on the external standard curve.
(iii) Method C—external standard curve with one RNA.An external standard curve was generated with st1 RNA in increasing amounts (102to 106copies).
HCV samples were then coamplified with one internal st1 concentration (103
copies), followed by differential hybridization. Subsequently, the obtained signal from st1 was used to calibrate the standard curve individually for each sample by a factor derived from the difference between the expected and the measured signal. The signal of this sample was then read from the corrected standard curve. (iv) Method D—without standard curve.The simplest method lacks any stan-dard curve and is based on coamplification of sample RNA and st1 RNA in one defined concentration (103copies). Quantitation of the initial sample
concen-tration was then derived from the following formula: initial sample concentra-tion5(signal from sample/signal from st1)3initial st1 concentration.
(v) Method E—without competitive RT-PCR.An external standard curve was generated by amplifying increasing amounts of wt1 RNA (102to 106copies).
Afterwards, the sample signal was plotted on the standard curve. This approach served as an example of a noninfluenced RT-PCR, since no competitor mimic was coamplified.
[image:2.612.52.549.82.215.2]Evaluation methods and software tool.A special computer program which supports all mathematical algorithms needed for the evaluation of the five stan-dardization approaches was developed. For each of the procedures, different curve-fitting algorithms are available, among them an especially adapted non-linear curve fitting for the Rodbard model (21). Statistics were calculated based on sample measurements. This allowed a direct comparison of the different procedures. Assay-specific numbers—the critical level, the detection limit, and the minimal distinguishable difference—are also available. The software adheres to common standards for software running under Windows 95 and Windows NT. To circumvent statistical phenomena, particularly at lower concentrations, multiple determinations were carried out as follows: fivefold determination for 10 copies of RNA, threefold determination for 100 copies of RNA, and twofold determination for every higher concentration. In addition, each individual ex-periment was carried out at least twice to confirm the results. In order to reduce interassay variations, most of our comparative studies were performed in the very
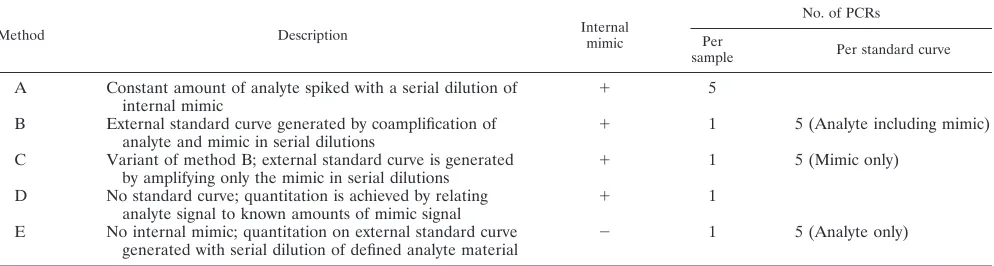
TABLE 1. Characterization of the five standardization methods
Method Description Internalmimic
No. of PCRs
Per
sample Per standard curve
A
Constant amount of analyte spiked with a serial dilution of
internal mimic
1
5
B
External standard curve generated by coamplification of
analyte and mimic in serial dilutions
1
1
5 (Analyte including mimic)
C
Variant of method B; external standard curve is generated
by amplifying only the mimic in serial dilutions
1
1
5 (Mimic only)
D
No standard curve; quantitation is achieved by relating
analyte signal to known amounts of mimic signal
1
1
E
No internal mimic; quantitation on external standard curve
generated with serial dilution of defined analyte material
2
1
5 (Analyte only)
on May 15, 2020 by guest
http://jcm.asm.org/
same run. This means that most samples were eluted during one sample prep-aration and that all mimics used and quantified were derived from one aliquot after in vitro transcription. All RT-PCRs and most of the detection experiments were carried out in parallel in any case where data were directly compared. The interassay coefficient of variation was 25% for method A, 70% for method B, 45% for method C, 35% for method D, and 20% for method E.
RESULTS
Evaluation of wt1, st1, and st2 RNA.
A well defined model
system requires that all mimics be amplified and captured with
the same efficacy. To prove this, amplification efficacy was
determined by amplifying different starting copy numbers
in-dependently for each mimic. Here, direct detection by agarose
gel electrophoresis was preferred in order to exclude any
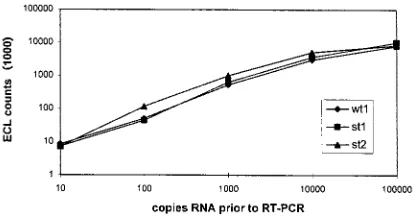
hy-bridization influence (Fig. 1). Afterwards, different capture
probes were evaluated on each mimic in order to ensure the
same capture efficacy on their corresponding templates (data
not shown). For each mimic, a capture probe which totally
fulfilled this requirement was chosen (Fig. 2). As can be seen
in Fig. 2, each specific capture probe generated a signal in the
same range for a given concentration. Copy numbers higher
than 10
4to 10
5led to a saturation of either amplification or
hybridization, as the curves in Fig. 2 indicate. For capture
probe 3, which hybridizes with the st2 amplicon, signals were
slightly higher. Hence, most of our competitive RT-PCRs were
performed either with st1 and clinical material, or with st1 and
wt1 when our model system was used.
Since all signal values in Fig. 2 were blank corrected, one can
also see that our analytical sensitivity is consistently in the
range of about 10 copies of RNA per amplification assay.
Competitive RT-PCR with homologous (st1) and
heterolo-gous (st2) mimics.
All competitive RT-PCRs were performed
either in our model system with wt1 as a wild-type analog and
st1 or st2 as the counterpart or with clinical material and st1. In
order to assess competition between both templates, two
ex-periments were designed; in the first, serial dilutions of wt1
were spiked with a constant amount of st2 (Fig. 3a), and in the
second, serial dilutions of st2 were spiked with a constant
amount of wt1 (Fig. 3b). As illustrated in Fig. 3, nearly no
competition was seen over a 5-log dynamic range, indicating
that our system is very stable and suitable for comparing
dif-ferent standardization approaches (see below). Only at the
extreme target/competitor ratio of 10
5:10
2could a very weak
competition be observed. The same results were obtained
when both experiments were repeated with st1 as the
counter-part to clinical material or to wt1 (data not shown). Hence, our
competitive RT-PCR is independent of the kind of mimic
introduced, homologous or heterologous.
Quantitation according to different standardization
ap-proaches.
In order to cover a wide dynamic range in those
experiments which require one internal mimic amount
(meth-ods B, C, and D), we have chosen a mean concentration of
competitor mimic of 20,000 copies per ml of plasma. Provided
that no loss of RNA occurs during sample preparation, this
would lead to 1,000 copies per RT-PCR assay.
In addition to our model system (wt1-st1), we also quantified
five different HCV-positive plasma samples, referred to as
no. 025, 043, 100, 114, and 122, undiluted and 10-fold
di-luted three times (1:10; 1:100; and 1:1,000) in HCV-negative
plasma.
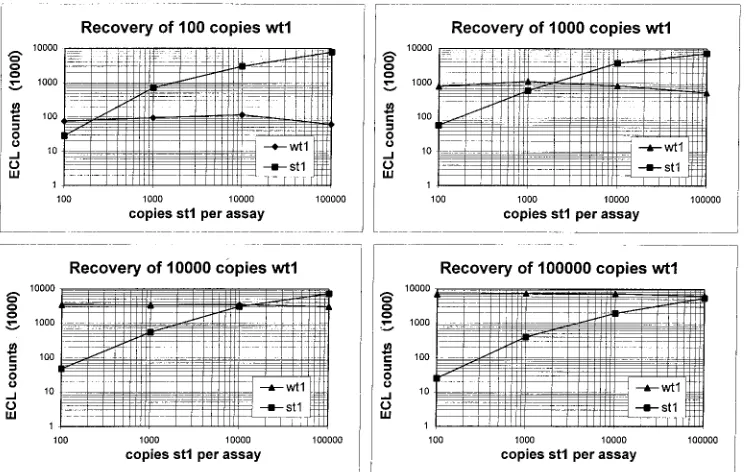
(i) Method A.
In the first experiments, the serial dilution
method was used in our model system without sample
prepa-ration, in which a constant amount of wt1 was coamplified with
increasing amounts of st1. With this method, 100 copies of wt1
RNA were quantified (recovered) with approximately 200
cop-ies of st1, 1,000 copcop-ies were found with approximately 1,900
copies, 10,000 copies were found with approximately 14,000
copies, and 100,000 copies could be found with nearly the given
nominal value (Fig. 4). As seen in former experiments, only
very weak competition was found across the entire tested
dy-namic range (Fig. 4). If the mimics were processed throughout
sample preparation, recovery appeared slightly reduced,
indi-cating little loss of RNA (in the range of 10% [data not
shown]). In the following quantitative experiments, we applied
this method on HCV-positive plasma. Again, only minimal
competition was seen. Data derived from these experiments
are partly summarized in Table 2.
(ii) Method B.
For determining the optimal concentration of
st1 RNA, 10
2to 10
6copies of wt1 RNA were coamplified with
varying amounts of st1 (10
2to 10
5copies). Standard curves
were generated by plotting the signal ratio of wt1/st1 against
the initial wt1 concentration on a logarithmic scale (Fig. 5). As
seen in Fig. 5, the linearity of the standard curves, which is a
prerequisite for accurate quantitation, is almost independent
of the concentration of coamplified st1; deviations were
ob-served only with the lowest concentration of st1. We therefore
decided to use 10
4copies of st1 for further coamplification
experiments. This concentration gives an excellent linearity of
the standard curve and also avoids possible competition effects
at higher concentrations or high variations due to statistical
distributions of st1 at lower concentrations.
[image:3.612.67.278.71.236.2](iii) Other methods.
For all other methods, data were not
depicted in detail but were processed with our software tool
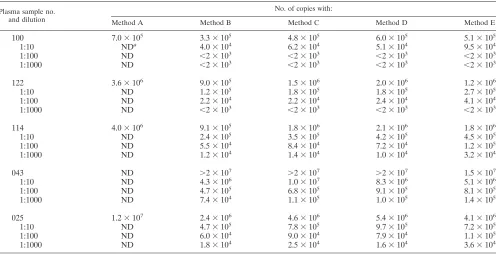
and are summarized in Table 2. As can be seen, all quantitative
FIG. 1. Amplification efficacies of different competitive mimics. The length marker is no. VIII from Boehringer Mannheim GmbH. The amplicon length is 244 bp.
FIG. 2. Illustration of the capture efficacies of different mimics hybridized with their corresponding capture probes. wt1, wild-type RNA; st1, homologous mimic RNA; st2, heterologous mimic RNA.
on May 15, 2020 by guest
http://jcm.asm.org/
[image:3.612.67.275.590.698.2]results are in the same range and differ only by a factor of
about 2. Sample readings greater than 2
3
10
7or smaller than
2
3
10
3(Table 2) are not facilitated by our software tool in the
current version.
DISCUSSION
PCR has become an important tool in the diagnosis of
in-fectious diseases because of its high sensitivity. Particularly in
those cases where monitoring of therapy is required (e.g., in
HCV viremia), quantitative determinations are mandatory.
The need for accuracy and correctness of recovery is obvious,
but beyond that and for routine applications, quantitative PCR
should offer maximal convenience and high sample throughput
(28). In order to achieve these goals, different quantitation
approaches have been used in the past. Presently, competitive
RT-PCR is considered most reliable and reproducible (7),
since this approach is solely able to recognize inhibitors in
individual samples. Besides the necessity of controlling those
tube-to-tube variations during amplification, a further
impor-tant requirement in a routine molecular diagnostic laboratory
is to standardize all processes, including sample preparation,
amplification, and detection. This can be achieved by
introduc-ing an RNA mimic for RT-PCR assays directly into the sample
preparation. It is highly imprecise to use DNA mimics for
RNA quantitation and to calculate reverse transcription
effi-cacy, since the efficacy of RT-PCR is controlled more by
re-verse transcription into cDNA than by the amplification of this
cDNA (7).
[image:4.612.57.528.70.229.2]These findings are widely accepted and taken into account,
FIG. 3. Competitive RT-PCR assay. (a) A constant amount of st2 RNA was coamplified with increasing amounts of wt1 RNA, followed by hybridization with an st2-specific capture probe. (b) A constant amount of wt1 RNA was coamplified with increasing amounts of st2 RNA, followed by hybridization with a wt1-specific capture probe. No competition could be seen in either case over a 5-log dynamic range.
FIG. 4. Accuracy of quantitation according to method A. In all experiments, a competitive RT-PCR was carried out with constant amounts of wt1 and increasing amounts of st1 RNA. The recovery of wt1 RNA in each experiment is depicted and can be read at the point of crossing of the two curves.
on May 15, 2020 by guest
http://jcm.asm.org/
[image:4.612.115.488.465.701.2]but great diversity can be found among standardization
con-cepts. In order to compare different standardization
ap-proaches in parallel, we developed a well-defined model
sys-tem based on the amplification of RNA mimics. In addition to
this model system, we applied these standardization methods
to clinical plasma samples from HCV-infected patients in
or-der to confirm our findings. Plasma samples were used because
significant RNA loss could sometimes be observed in serum
samples (17).
The serial-dilution approach (method A), often found in
research laboratories (2, 10, 15), is proposed to be most
accu-rate in absolute quantitation but is very cumbersome and has a
poor throughput with regard to routine applications. Every
sample has to be spiked with increasing amounts of RNA
mimic, usually four to five concentrations, and run throughout
the entire process. After amplification, each competitive
reac-tion has to be split into two hybridizareac-tion reacreac-tions, ending up
with eight to ten detections per sample.
In contrast to this internal standardization, different external
approaches exist to increase throughput and convenience. In
these approaches, an external standard curve is generated by
coamplification either of two different mimics (method B) (8,
20, 23) or of only one mimic (method C) (18). The theoretical
advantage of method B is that the hybridization efficacies of
the wild type and the internal mimic might be different, but the
ratio between the two curves is the same in both the external
standard curve and the sample. Method C further simplifies
calibration by using only one mimic and is therefore even more
convenient. Finally, method D completely omits any standard
curves and calculates the sample concentration just from the
signal ratios of the internal mimic and the analyte multiplied by
the initial mimic concentration. In addition to these internally
controlled assays, a noncompetitive RT-PCR quantified with
an external standard curve (method E) was also implemented
in our comparison in order to investigate a noninfluenced (no
mimic was coamplified) RT-PCR.
[image:5.612.52.551.80.334.2]Besides the criteria of convenience, throughput and
accu-racy, we also assessed reproducibility, dynamic range,
sensitiv-ity, and correctness of recovery. Interestingly, and in contrast
to our expectation, we found all methods comparable with
regard to the latter set of criteria. All results differed
approx-imately by a factor of 2 (Table 2). In our understanding there
are three main reasons for this finding. First, all of our mimics,
as well as the analyte, reveal exactly the same amplification and
hybridization efficacy, an important prerequisite for any
accu-rate quantitative test. The observation that minimal
competi-tion occurs in our experiments over a 5-log dynamic range
could be due either to this very same efficacy or to the fact that
our RT-PCR was not in any saturated condition because of our
highly sensitive ECL detection. Second, as can be concluded
from method E, we had no inhibition of individual samples,
[image:5.612.62.280.544.681.2]FIG. 5. Standard curves according to method B. In a competitive RT-PCR, serial dilutions of wt1 RNA were coamplified with a constant amount of st1 RNA. This was done for four different st1 RNA concentrations (100 to 100,000 copies). The signal ratio of each individual assay is depicted, showing linearity over the entire range.
TABLE 2. Comparison of different standardization/quantitation approaches applied on several HCV-positive plasma samples
Plasma sample no. and dilution
No. of copies with:
Method A Method B Method C Method D Method E
100
7.0
3
10
53.3
3
10
54.8
3
10
56.0
3
10
55.1
3
10
51:10
ND
a4.0
3
10
46.2
3
10
45.1
3
10
49.5
3
10
41:100
ND
,
2
3
10
3,
2
3
10
3,
2
3
10
3,
2
3
10
31:1000
ND
,
2
3
10
3,
2
3
10
3,
2
3
10
3,
2
3
10
3122
3.6
3
10
69.0
3
10
51.5
3
10
62.0
3
10
61.2
3
10
61:10
ND
1.2
3
10
51.8
3
10
51.8
3
10
52.7
3
10
51:100
ND
2.2
3
10
42.2
3
10
42.4
3
10
44.1
3
10
41:1000
ND
,
2
3
10
3,
2
3
10
3,
2
3
10
3,
2
3
10
3114
4.0
3
10
69.1
3
10
51.8
3
10
62.1
3
10
61.8
3
10
61:10
ND
2.4
3
10
53.5
3
10
54.2
3
10
54.5
3
10
51:100
ND
5.5
3
10
48.4
3
10
47.2
3
10
41.2
3
10
51:1000
ND
1.2
3
10
41.4
3
10
41.0
3
10
43.2
3
10
4043
ND
.
2
3
10
7.
2
3
10
7.
2
3
10
71.5
3
10
71:10
ND
4.3
3
10
61.0
3
10
78.3
3
10
65.1
3
10
61:100
ND
4.7
3
10
56.8
3
10
59.1
3
10
58.1
3
10
51:1000
ND
7.4
3
10
41.1
3
10
51.0
3
10
51.4
3
10
5025
1.2
3
10
72.4
3
10
64.6
3
10
65.4
3
10
64.1
3
10
61:10
ND
4.7
3
10
57.8
3
10
59.7
3
10
57.2
3
10
51:100
ND
6.0
3
10
49.0
3
10
47.9
3
10
41.1
3
10
51:1000
ND
1.8
3
10
42.5
3
10
41.6
3
10
43.6
3
10
4aND, not determined.
on May 15, 2020 by guest
http://jcm.asm.org/
and therefore it was not necessary to correct (calibrate) the
standard curves. The finding that no inhibition was observed
could be due either to the homogeneous specimen (plasma) or
to effective separation of all inhibitors during sample
prepara-tion. Besides this, the lack of sample inhibition might also be
due to the limited number of plasma samples tested in our
investigation. Artificial spiking with strong inhibitors, such as
ethanol or hemin, revealed the limitation of method E where
an internal amplification control is missing, whereas the other
methods gave comparable results because any inhibition was
indicated by the internal control used in each of these methods
(data not shown). Third, the equivalence of our
standardiza-tion methods may also be due to our particular system. Other
sample preparation methods, more cycles, or another
detec-tion process might lead to other results.
Beyond that, our results further indicate that equal
amplifi-cation and capture efficacy are independent from the kind of
mimic introduced, homologous or heterologous. Hence, both
mimics are suitable for competitive RT-PCR assays.
If the above-mentioned conditions are ensured, then method
D, the easiest standardization/quantitation concept, is as good
as any other approach and is therefore the method of choice.
ACKNOWLEDGMENTS
We are very grateful to G. Kagerer, S. Mitzel, and I. Egger for
technical assistance and to C. Berding and G. Ziegler for stimulating
discussions regarding statistical analysis.
REFERENCES
1. Ausubel, F. M., R. Brent, R. E. Kingston, D. D. Moore, J. G. Seidman, J. A. Smith, and K. Struhl.1995. Current protocols in molecular biology. John Wiley and Sons, Inc., New York, N.Y.
2. Besnard, N. C., and P. M. Andre. 1994. Automated quantitative determina-tion of hepatitis C virus viremia by reverse transcripdetermina-tion-PCR. J. Clin. Mi-crobiol. 32:1887–1893.
3. Boom, R., C. J. A. Sol, M. M. M. Salimans, C. L. Jansen, P. M. E. Wertheim-van Dillen, and J. Wertheim-van der Noordaa.1990. Rapid and simple method for purification of nucleic acids. J. Clin. Microbiol. 28:495–503.
4. Caballero, O. L., L. L. Villa, and A. J. G. Simpson. 1995. Low stringency-PCR (LS-stringency-PCR) allows entirely internally standardized DNA quantitation. Nucleic Acids Res. 23:192–193.
5. Chelly, J., D. Montarras, C. Pinset, Y. Berwald-Netter, and J.-C. Kaplan. 1990. Quantitative estimation of minor mRNAs by cDNA-polymerase chain reaction: application to dystrophin mRNA in cultured myogenic and brain cells. Eur. J. Biochem. 187:691–698.
6. Clementi, M., S. Menzo, P. Bagnarelli, A. Manzin, A. Valenza, and P. E. Varaldo.1993. Quantitative PCR and RT-PCR in virology. PCR Methods Applic. 2:191–196.
7. Clementi, M., S. Menzo, A. Manzin, and P. Bagnarelli. 1995. Quantitative molecular methods in virology. Arch. Virol. 140:1523–1539.
8. Gerna, G., F. Balfanti, A. Sarasini, M. Furione, E. Percivalle, M. G. Revello, D. Zipeto, D. Zella, and The Italian Foscarnet Study Group.1994. Effect of foscarnet induction treatment on quantitation of human cytomegalovirus (HCMV) DNA in peripheral blood polymorphonuclear leukocytes and aqueous humor of AIDS patients with HCMV retinitis. Antimicrob. Agents Chemother. 38:38–44.
9. Gilliland, G., S. Perrin, K. Blanchard, and H. F. Bunn. 1990. Analysis of cytokine mRNA and DNA: detection and quantitation by competitive
poly-merase chain reaction. Proc. Natl. Acad. Sci. USA 87:2725–2729. 10. Gretch, D., L. Corey, J. Wilson, C. dela Rosa, R. Willson, R. Carithers, Jr.,
M. Busch, J. Hart, M. Sayers, and J. Han.1994. Assessment of hepatitis C virus RNA levels by quantitative competitive RNA polymerase chain reac-tion: high-titer viremia correlates with advanced stage of disease. J. Infect. Dis. 169:1219–1225.
11. Haberhausen, G., and K. Zetsche. 1992. Nucleotide sequence of the rbcL gene and the intergenic promoter region between the divergently transcribed
rbcL and atpB genes of Ipomoea purpurea (L.). Plant Mol. Biol. 18:823–825.
12. Ho, S. N., H. D. Hunt, R. M. Horton, J. K. Pullen, and L. R. Pease. 1989. Site-directed mutagenesis by overlap extension using the polymerase chain reaction. Gene 77:51–59.
13. Hoyle, N. R., B. Eckert, and S. Kraiss. 1996. Electrochemiluminescence: leading edge technology for automated immunoassay analyte detection. Clin. Chem. 42:1576–1578.
14. Kleter, G. E. M., L.-J. van Doorn, J. T. Brouwer, S. W. Schalm, R. A. Heijtink, and W. G. V. Quint.1994. Sequence analysis of the 59untranslated region in isolates of at least four genotypes of hepatitis C virus in The Netherlands. J. Clin. Microbiol. 32:306–310.
15. Kumar, U., H. C. Thomas, and J. Monjardino. 1994. Serum HCV RNA levels in chronic HCV hepatitis measured by quantitative PCR assay; cor-relation with serum AST. J. Virol. Methods 47:95–102.
16. Mallet, F., C. Hebrard, J. M. Livrozet, O. Lees, F. Tron, J. L. Touraine, and B. Mandrand.1995. Quantitation of human immunodeficiency virus type 1 DNA by two PCR procedures coupled with enzyme-linked oligosorbent assay. J. Clin. Microbiol. 33:3201–3208.
17. Manzin, A., P. Bagnarelli, S. Menzo, F. Giostra, M. Brugia, R. Francesconi, F. B. Bianchi, and M. Clementi.1994. Quantitation of hepatitis C virus genome molecules in plasma samples. J. Clin. Microbiol. 32:1939–1944. 18. Mulder, J., N. McKinney, C. Christopherson, J. Sninsky, L. Greenfield, and
S. Kwok.1994. Rapid and simple PCR assay for quantitation of human immunodeficiency virus type 1 RNA in plasma: application to acute retro-viral infection. J. Clin. Microbiol. 32:292–300.
19. Nedelmann, J., P. Heagerty, and C. Lawrence. 1992. Quantitative PCR: procedures and precisions. Bull. Math. Biol. 54:477–502.
20. Ravaggi, A., A. Zonaro, C. Mazza, A. Albertini, and E. Cariani. 1995. Quan-tification of hepatitis C virus RNA by competitive amplification of RNA from denatured serum and hybridization on microtiter plates. J. Clin. Mi-crobiol. 33:265–269.
21. Rodbard, D. 1974. Statistical quality control and routine data processing for radioimmunoassay (RIA) and immunoradiometric assays (IRMA). Clin. Chem. 20:1255–1270.
22. Roth, W. K., J.-H. Lee, B. Ru¨ster, and S. Zeuzem. 1996. Comparison of two quantitative hepatitis C virus reverse transcriptase PCR assays. J. Clin. Mi-crobiol. 34:261–264.
23. Secchiero, P., D. Zella, R. W. Crowley, R. C. Gallo, and P. Lusso. 1995. Quantitative PCR for human herpesviruses 6 and 7. J. Clin. Microbiol. 33:2124–2130.
24. Siebert, P. D., and J. W. Larrick. 1993. PCR MIMICS: competitive DNA fragments for use as internal standards in quantitative PCR. BioTechniques 14:244–249.
25. Simmonds, P., F. McOmish, P. L. Yap, S.-W. Chan, C. K. Lin, G. Dusheiko, A. A. Saeed, and E. C. Holmes.1993. Sequence variability in the 59 non-coding region of hepatitis C virus: identification of a new virus type and restrictions on sequence diversity. J. Gen. Virol. 74:661–668.
26. Wang, A. M., M. V. Doyle, and D. F. Mark. 1989. Quantitation of mRNA by the polymerase chain reaction. Proc. Natl. Acad. Sci. USA 86:9717–9721. 27. Whitby, K., and J. A. Garson. 1995. Optimisation and evaluation of a
quan-titative chemiluminescent polymerase chain reaction assay for hepatitis C virus RNA. J. Virol. Methods 51:75–88.
28. White, T. J. 1996. The future of PCR technology: diversification of technol-ogies and applications. Trends Biotechnol. 14:478–483.
29. Young, K. Y., R. M. Resnick, and T. W. Myers. 1993. Detection of hepatitis C virus RNA by combined reverse transcription-polymerase chain reaction assay. J. Clin. Microbiol. 31:882–886.