The context dependence of network
response properties in
\<i
of primate^ and
cat^. ^
p n v \ (X/ y V \ SO C p r V ^ ' C
submitted in February, 1997,
for the degree o f Doctor o f Philosophy to the Faculty o f Science o f the University of London.
By
Justin Nicholas Davis
Department o f Visual Science Institute of Ophthalmology
ProQuest Number: 10045760
All rights reserved
INFORMATION TO ALL USERS
The quality of this reproduction is dependent upon the quality of the copy submitted. In the unlikely event that the author did not send a complete manuscript and there are missing pages, these will be noted. Also, if material had to be removed,
a note will indicate the deletion.
uest.
ProQuest 10045760
Published by ProQuest LLC(2016). Copyright of the Dissertation is held by the Author. All rights reserved.
This work is protected against unauthorized copying under Title 17, United States Code. Microform Edition © ProQuest LLC.
ProQuest LLC
789 East Eisenhower Parkway P.O. Box 1346
Abstract.
In the mammalian visual system, stimulus context was investigated with respect to the
ways it influenced neuronal mean response magnitude (the average number of spikes
fired per second), response temporal structure (the timing of spikes with respect to one
another), and the extent to which distributed neurones fired spikes synchronous due to
synaptic interaction between them. Neurones were presented with bipartite grating
stimuli, in which the spatio-temporal relationship between the grating activating the
excitatory receptive field and that presented to the surrounding visual space could be
varied systematically. Simultaneous extracellular recordings were made of the
responses of up to four single neurones separated by 750-1000pm, in the lateral
geniculate nucleus (LGN) of the thalamus in the cat, or the primary visual cortex (VI)
of non-human primates or cats.
Changing context systematically influenced the activity of groups of cells. The
responses of 83% of primate VI cells to discontinuous stimuli, in which the
centre/surround orientation difference was greater than 45°, contained stronger
oscillations at frequencies below 80Hz, than responses to continuous stimuli. Many
cat and primate V 1 neurones exhibited elevated response magnitudes to such stimuli.
In primate V I, the strength of a cell’s oscillatory discharge was dependent on stimulus
configuration rather than response magnitude. In the LGN and V I, cell pairs with
different orientation preferences fired synchronised responses when stimulated by
specific discontinuous grating configurations.
Stimulus specific synchronised LGN input, and reciprocal excitatory and inhibitory
cortico-cortical connections could generate these properties of cells, and the network
in which they exist. A model is proposed to account for the function significance of
contour discontinuities in generating coherent neural representations of objects in the
visual world. It involves response synchronisation in horizontal, feedforward and
Contents
page
Figures list 5
Tables list 8
Acknowledgements 9
1. Preamble 10
2. Introduction 12
Historical perspective. 13
Early ideas. 13
Modern ideas. 14
Historical experimental investigations. 18
Recent literature review. 24
The retina. 24
The lateral geniculate nucleus. 30
The thalamo-cortical projection. 35
Cortical pathways. 37
Cat primary visual cortex. 37
Inter-laminar projection patterns. 37
Horizontal projection patterns. 41
Primate primary visual cortex. 45
Inter-laminar projection patterns. 45
Horizontal projection patterns. 47
The spatial sensitivity of cells primary visual cortex. 52
Receptive fields in cat V 1. 52
Receptive fields in Primate V I. 54
Responses from beyond the classical 57
receptive field.
Integrated network properties of the visual cortex. 67
The temporal structure of visual responses. 68
Temporal response correlations and network 73
interconnectivity.
Synchronisation in the visual system. 80
4. Methods. 92
Preparation of mammalian models. 92
Cats. 92
Primates. 94
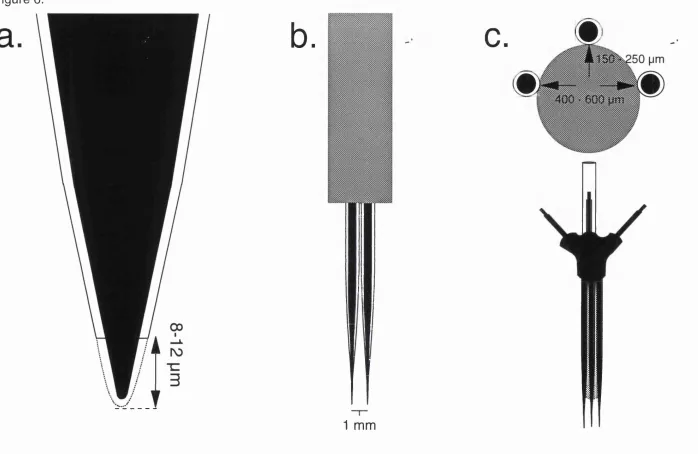
Electrodes. 96
Histology. 103
Data acquisition. 105
The visual stimulation system. 106
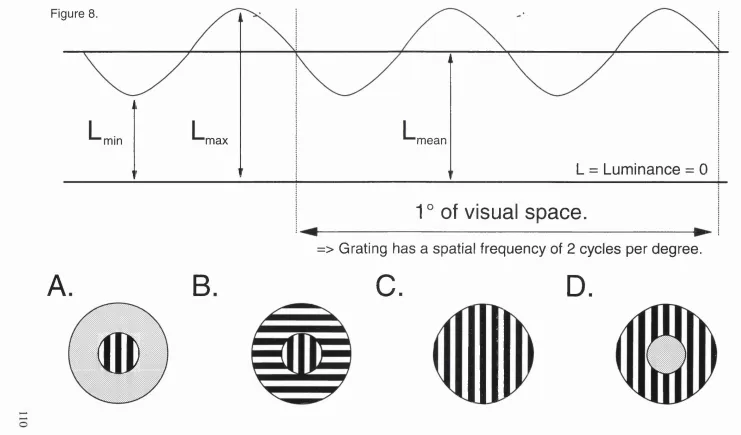
Visual stimuli. 109
Data Analysis. 113
Cross-correlation. 113
Receptive field configuration groups. 117
Auto-correlation. 118
Fast Fourier transformation. 119
5. Results. 130
Single unit analysis in primate VI. 130
Context dependent oscillatory responses. 130
Context dependent changes in mean response magnitude. 146
Single unit analysis in cat V 1. 156
Context dependent oscillatory responses. 156
Context dependent changes in mean response magnitude. 157
Responses of cat LGN cells. 164
Oscillatory responses of primate cortical cells to grating patches. 168
The distribution oscillation frequencies. 184
Cross-correlation analysis. 187
Cortical synchrony in responses to contextual stimuli. 188 Synchrony in the cat dLGN responses to contextual stimuli. 217
6. Discussion. 225
Temporal characteristic of responses to contextual stimuli. 225 Network connectivity underlying contextual response properties. 237
Context dependent network synchrony. 243
Appendix 1. Requirements for the completion of PhD thesis. 263
Figures.
Page
1. The retino-cortical visual pathway. 26
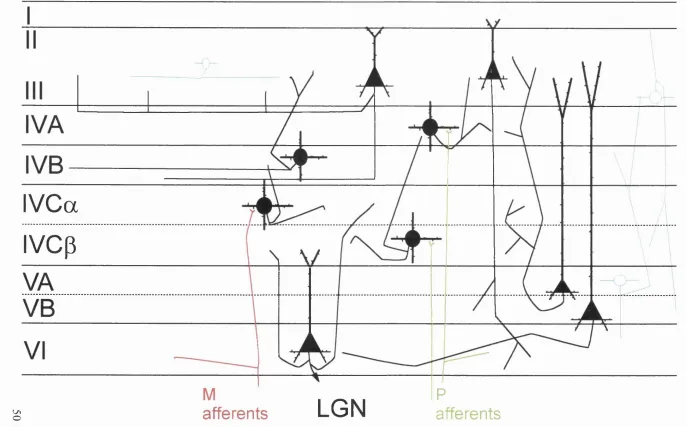
2. Inter-laminar and intra-laminar connectivity of cat V I. 38
3. Inter-laminar and intra-laminar connectivity of primate V I. 50
4. Cross-correlation function resulting from four types of connectivity. 77
5. Stages in electrode manufacture. 97
6. Further stages in electrode manufacture. 100
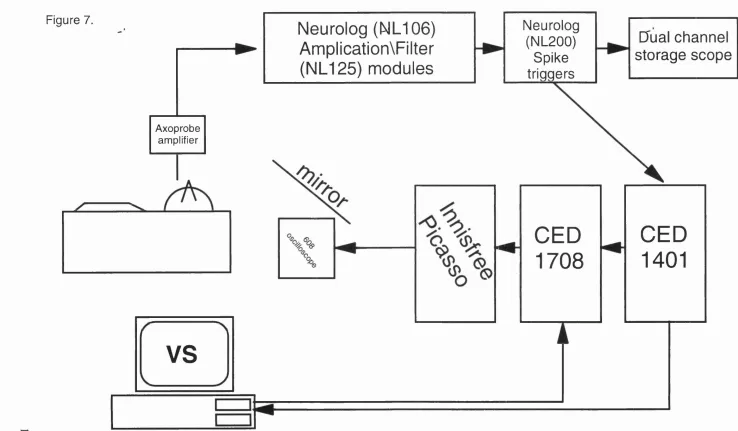
7. Experimental recording and online analysis apparatus set-up. 107
8. Sinusoidal gratings and typical stimulus configurations. 110
9. Implementation of cross-correlation analysis. 114
10-1. Simulated spike train with a firing rate of 1OHZ and FFT analysis. 124
10-2. Simulated spike train with a firing rate of lOOHZ and FFT analysis. 126
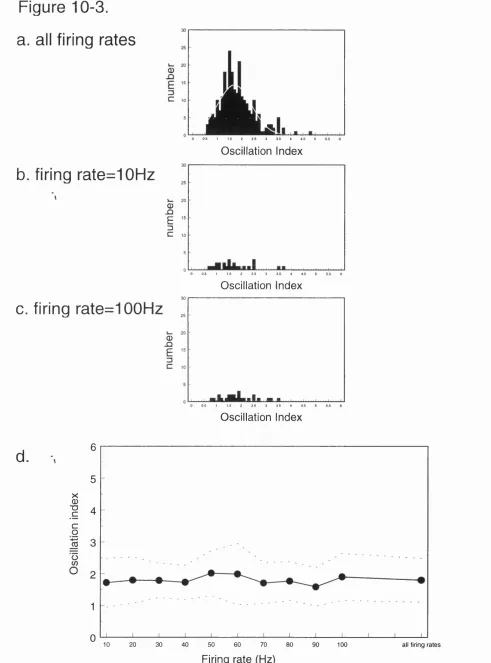
10-3. Summary of simulated data (lO-lOOHz) and Oscillation index analysis. 128
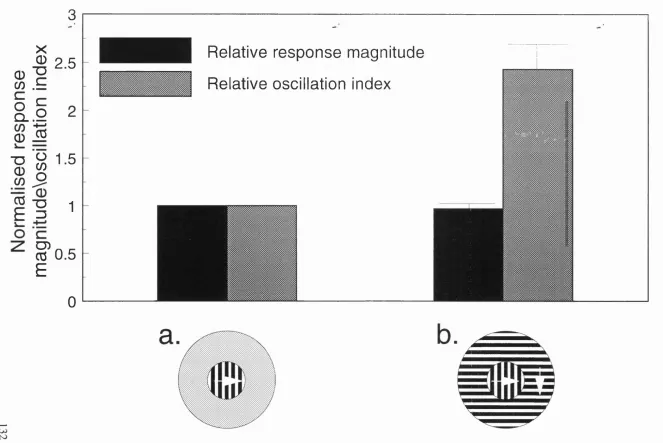
11. Oscillation strength to changes associated with continuous and 132
discontinuous stimuli in primate V 1.
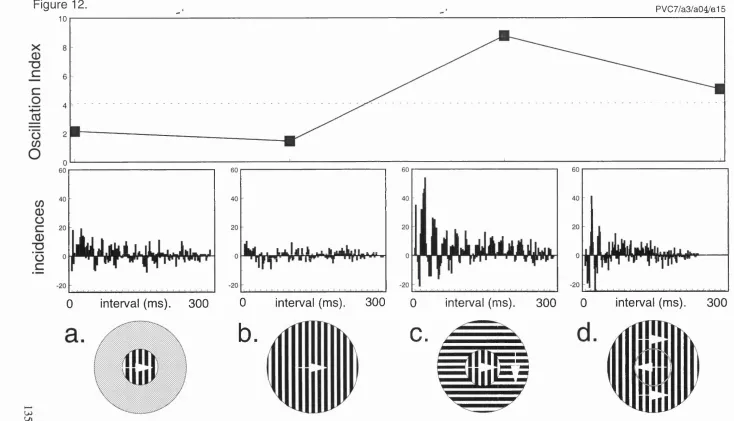
12. Gamma frequency oscillations within responses to 135
continuous and discontinuous stimuli, recorded in primate V 1.
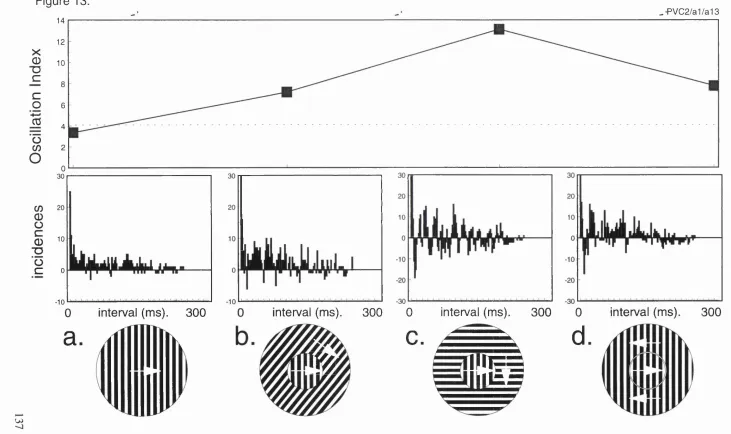
13. Gamma frequency oscillation within responses to continuous and 137
discontinuous stimuli, recorded in primate V 1.
14. 12-16Hz oscillations within responses to continuous and 139
discontinuous stimuli, recorded in primate VI.
15. Changes in oscillation strength as a function of centre diameter, 142
in responses to discontinuous stimuli, recorded in primate VI.
16. Gamma frequency oscillations within responses to continuous 144
stimuli recorded in primate VI.
17. Density maps showing changes in mean response magnitude 147
18. Changes in response magnitude plotted as a function of surround 151 orientation, recorded in primate V 1.
19. Two types of stimulus specificity exhibited by cells in primate V I, 154 and the relationship with changes in mean response magnitude.
20. Gamma frequency oscillation recorded from a cell in cat V 1, 158
responding to continuous and discontinuous bipartite grating stimuli.
21. Density maps depicting changes in mean response magnitude 160
associated with changes in stimulus context, recorded in cat V 1.
22. Changes in response magnitude plotted as a function of surround 162
orientation, recorded in cat V 1.
23. Changes in response magnitude and gamma oscillation strength 166
associated with presentation of continuous and discontinuous stimuli, recorded in cat LGN.
24. Density maps depicting changes in mean response magnitude during 169
exclusive presentation of centre or surround gratings, recorded in primate V 1.
25. Patch diameter tuning curves from responses recorded in primate V I. 172
26. Average response suppression plotted as a function of patch diameter 174 increase over optimal for a group of patch suppressed primate V 1
cells, and distribution of optimal diameters for this group.
27. Gamma oscillation strength plotted as a function of optimally oriented 177 patch diameter, recorded in primate VI.
28. Gamma oscillation strength plotted as a function of optimally oriented 179 patch diameter, recorded in primate V 1.
29. Distribution of optimal patch diameters using oscillation 181
strength as the criterion for a group of cells recorded in primate V 1, and an average patch diameter tuning curve using the same criterion.
30. Distribution of gamma range frequencies exhibited by responses 185
recorded from cells in primate V 1.
31. Response synchrony associated with responses to discontinuous 192
stimuli, single units recorded in primate V 1.
32. Response synchrony associated with responses to discontinuous 194
33. Response synchrony associated with responses to discontinuous 197 stimuli, single units recorded in cat VI.
34. Response synchrony associated with responses to discontinuous 199
stimuli, single units recorded in cat VI.
35. Response synchrony associated with responses to discontinuous 202
stimuli, single units recorded in primate VI.
36. Oscillatory response synchrony associated with responses to 206
discontinuous stimuli, single units recorded in primate V 1.
37. Oscillatory response synchrony associated with responses to 210
discontinuous stimuli, single units recorded in primate V 1.
38. Oscillatory response synchrony associated with responses to 213
discontinuous stimuli, single units recorded in primate V 1.
39. Oscillatory response synchrony associated with responses to 215
continuous stimuli, single units recorded in primate VI.
40. Response synchrony associated with responses to continuous 219
stimuli, single units recorded in the cat LGN.
41. Response synchrony associated with responses to continuous 222
stimuli, single units recorded in the cat LGN.
42. A schematic depiction of visual system network connectivity 247
that might underlie the observations reported.
43. Kanizsa Triangles, illustrating that continuous contours might 259
Tables.
page
1. The distribution of cells amongst groups stimulated with bipartite 151
stimuli, oscillating, in the gamma and 12-16Hz frequency ranges, to continuous and discontinuous stimuli.
2. The distribution of cells amongst four groups with different 189
Acknowledgements.
I would like to thank Professor Adam Sillito, Dr, Helen Jones, Dr. Ken Grieve and Dr.
Penny Murphy for their help, support and guidance during experiments, data analysis,
and in the writing of this thesis. Dr David West for help in developing software to
facilitate data analysis. I also thank Professor Jim Bowmaker and Paul Venters for
their advice and support. Steve Tassen and Sue Classey deserve great thanks for their
technical support, particularly in the development of electrodes and in the histology
lab. I am grateful to everybody at the Institute of Ophthalmology for providing and
maintaining an environment in which I could develop the ideas that are presented
here.
Finally I would like to thank my Parents, Grandparents and friends for their constant,
1. Preamble.
The central nervous system is a highly interconnected body of neural centres
concerned with processing information relevant to external and intrinsic events
necessary to an organisms survival. External events are processed by the visual
system, beginning at the retina, this being the first place where the visual world
impinges upon the us. From the retina, information is passed to the thalamus and then
to visual cortical centres. Conclusions drawn from early research in the visual system
(Hubei and Wiesel, 1962, 1965) emphasised this feedforward aspect of information
processing. A hierarchical architecture was proposed in which signals were passed
from neural centres directly connected to the retina such as the lateral geniculate
nucleus in a serial chain to others in the cerebral cortex, where the role of each
subsequent stage was to process the progressively more complicated information
passed to it. Recent evidence however suggests that paths of information flow, are not
as simple as was first supposed, and in fact there is much feedback connectivity
between 'higher' cortical and 'lower' sub-cortical and cortical centres (Van Essen et al,
1985). A feature of the system as a whole is that as information progresses from ‘low’
to ‘high’ centres, it is processed by cells that are sensitive to a larger areas of a visual
scene. The neurones in these centres have other properties that emphasise different
aspects of the visual world, such as form, motion and colour. Thus presence of
feedback influences should mean that at a given in point in the system, the activity of
a neurone is not simply the result of stimulation by the attribute to which it is
sensitive, but is also in part due to the form, motion and colour properties of the visual
scene around this optimal stimulus. Sensitivity to the context of a stimulus should be a
feature of neural activity. These influences on activity come about because cells
communication with others through synaptic mechanisms. The firing of an action
potential by one cell, changes the propensity of another to fire an action potential.
Action potentials represent aspects of a visual scene, however, how they do this is
still a critical point of debate (e.g. Barlow, 1972, Shadlen and Newsome, 1994, and
Singer and Gray, 1995). The debate centres on whether cells behave as integrators of
network activity and represent the visual world with changes in firing rate. Or
alternatively sense coincidences in their input from other cells and respond with
distinct temporal patterns of output that are synchronised with those of other cells.
This thesis is concerned with an investigation of these modes of processing and the
influence that stimulus context has upon them. The historical background of these
ideas will be covered in following chapters, from early and recent philosophical
proposals to experiments in the early part of this century which revealed some of the
basic features of the CNS, such as functional modularity and synaptic connectivity.
The feedforward and feedback connectivity between the LGN and primary visual
cortex is typical of the network of connections between cells in many centres in the
brain and therefore provides a good model for the investigation. Details of the
anatomical characteristics of this network, the visual sensitivity of cells and ideas
concerning the code used by these cells, representing visual stimuli, will be discussed
in detail. The results section will report the outcomes of experiments that were
designed to investigate network codes and the influence of context upon them. A
discussion will then examine the implications of the results reported, for what we
know about how the visual system functions, in the context of previous work done by
others. This will be done in attempt to at least partially answer the question, which is,
2. Introduction.
Historical perspective.
Early ideas.
There has been a long history of debate concerning visual perception, cognition and
all matters related to the mind (Griisser and Landis, 1991) ever since Greek
philosophers such as Pythagoras and Homer thought about them. These early
philosophers believed in a material body controlled by a transmaterial pneuma, and
concepts such as the transmigration of the soul and reincarnation. Plato (427-347 BC)
was one of the first people to consider where in the body this soul might reside, in his
work entitled 'Timaios'. He divided the soul into three parts the third of which was
located in the brain, this part was the divine, immortal, and human-specific
component. This immortal soul dealt with 'higher' sensations, its actions were seen as
expressions of will. The other parts, rational and mortal, dealt with emotions and
various drives and were located in the thorax and abdomen. Central to the beliefs of
Plato and his peers such as Empedocles, Diogenes, Pythagoras and Alcmaeon, with
regard to vision was the idea that pneuma was emitted from the eyes for the purpose
of vision. This pneuma interacted with light to form a 'cone of vision' which actually
touched objects in order that they should be seen, this is known as the 'extramission
theory of vision'. Early anatomical observations of the central nervous system were
made by Alcmaeon of Croton (530-470 BC), he, having observed that brain lesions
lead to impairment in perception and cognition, considered the brain to be the
'hegemonikon' of the soul. Alcmaeon discovered the optic nerve and chiasm and
proposed that the brain and eyes were reciprocally connected through these, and that
pneuma formed the medium inside the channels.
Aristotle (384-322 BC) had a slightly different view from this group, he believed in
the tripartite soul and proposed that it guided and organised living organisms. His soul
was structured hierarchically according to the type of organism in which it existed. All
living things contained a vegetative soul, only organisms such as animals and man
contained an animal soul, and only man possessed the rational component, that was
capable of thought. Aristotle attributed perception to the sensitive animal soul, though
he rejected the idea that perception and cognition are related to brain function. His
view was that the information from sense systems is integrated by the common sense
of the hegemonikon, and this extracted the general properties of objects. For Aristotle,
the brain was a distilling device for making 'ether', the essential spirit of life. This was
made from respired pneuma and energy gained from food. His physical experiments
lead him to suppose that the convoluted shape of the cortical mantle was a cooling
device for this process.
By the Middle Ages thoughts on brain function had started to be based on the use of
the ventricles. These had been discovered in 300 BC by Herophilos and Erasistratos.
The view put forward in the fourth century AD by the Christian Bishop Nemesios of
Emesa was that two lateral ventricles of the brain were central to perception and
cognition. They were thought to contain the soul's multi-modal power of integration
that was necessary for the perception of objects. These ventricles were thought to
contain the ether that Aristotle had postulated, only now it became known as spiritus
animalis ('anima', latin for soul). Anima in the ventricles was said to be the medium
for the soul. Further investigations took place in the Arab nations between 800 and
1200 AD, these scientist also believed in the role of ventricles, among the most
important pioneers were Costa ben Luca (864-923) and Alhazen (965-1040). Alhazen
made detailed drawings of the anatomy of the eye, and much later thought with regard
to brain function drew on the findings of this Arabic group.
Albertus Magnus (1198-1280) was one early scientist to recognise the importance of
the cortex. He divided brain tissue into three components, the first being the velum, or
as we know it today, the cortex, then there was the medulla or white matter, Albertus
included last in his classification the ventricles. He then went on to develop a
complicated theory of perception and cognition involving all three components. This
theory also involved the use of certain rare spirits, analogous to Aristotle's 'ether'.
Further theories espousing the use of these special liquids for the mediation of mental
processes were still being put forward at the end of the nineteenth century. As late as
In Renaissance times the ventricles were still pre-eminent in theories of brain
function, Leonardo da Vinci, famous for many things, investigated the anatomy of the
central nervous system and theorised on its function. He believed the retina sent the
visual image down the optic nerve, through the optic chiasm and into the ventricles.
When inside it was then projected onto the walls. He even calculated, based on his
observations of the bovine nervous system, that there should be enough room for a
significant amount of magnification of the retinal image. Aside from this view da
Vinci did believe that the representation of the visual image was achieved by the
formation of a physiological material image that maintained the geometrical order of
the original input. Leonardo also believed that each object hitting the retina possessed
ten properties that could be perceived by the visual system, light, dark, colour, shape,
size, position, distance, nearness, movement and rest. These are views which are
relevant to modem studies of the visual system.
Modern Ideas.
Western philosophy and thinking on mental processes has its roots in Greek
philosophy and Judaeo-Christian religion and these movements have in great part
been influenced by ancient cultures. It is only in the last few hundred years, since
developments in optical instruments such as microscopes, that theories have been
based on observations from nature (Russell, 1945). A treatise that dealt with vision
was that written by John Locke, in his Essay on Human Understanding published in
1690, he writes about vision.
The most comprehensive o f all our senses, conveying to our minds the ideas o f light
and colour, which are peculiar only to that sense; and also the fa r different ideas o f
space, figure and motion.
At this time a great source of debate that both John Locke and a philosopher named
George Berkeley entered into, was whether or not elementary abilities in vision are
dependent upon learning or are based predominantly upon innate neuronal
mechanisms. A question central to this problem at the time was proposed by William
Molyneux to John Locke in a letter of 1693. Basically Molyneux asked the question, if
a man, blind from birth, had tactile experience of a sphere and cube of the same size,
were he suddenly to become sighted, would he immediately know by sight which was
the cube and which the sphere ? Both Locke and Berkeley supposed that the subject
would not be able to perform the task, many observations of subjects then and since
have demonstrated this point. Such elementary visual tasks are impaired by prolonged
blindness from birth.
George Berkeley, made early anatomical observations of the retina and its optical
functionality, he set out some theories on vision in An Essay Towards a New Theory
o f Vision. Here he describes his ideas on perspective within the visual field and also
how the inverted picture on the surface of the retina generates what we sense. He
discusses the cognitive aspects of vision and touch and the problem set by Molyneux,
his view was that objects of sight and of touch make up two sets of ideas which are
widely different from one another, and that vision needs a frame of reference which is
based on tactile experience. His view of vision follows from his observations of the
flat picture on the surface of the retina, and is shown in the following quote.
All that is properly by the visive faculty amounts to no more than colours, with their
variations and different properties o f light and shade.
He feels that other aspects of vision such as form, size, and motion which we take for
granted when we open our eyes are actually generated by referring to tactile
experience, rather than being generated by mechanisms intrinsic to the visual system.
David Hume developed the empirical philosophies of Locke and Berkeley, into a
more rational set of ideas. In a section entitled Scepticism with Regard to the Senses,
in his book Treatise on Human Nature published in 1739, he dealt with issues that
relate to perception and what can be perceived. He discussed whether an object exists
while it is not being perceived, in general his thoughts on vision are related to the time
.... we may observe, that what we call a mind, is nothing but a heap or collection o f
different perceptions, united together by certain relations, and supposed though
falsely, to be endowed with a perfect simplicity and identity.
The certain relations that Hume mentions are causal relations, Hume believed that we
can never say that there is a connection between two perceptions, as we can never
properly perceive their cause, however based on spatio-temporal relations which he
believes we can sometimes infer, we infer causation. Hume's view of how we
perceive our world is empirical, we can only perceive what we are perceiving, the rest
of our world is based on experience, however this experience must not be based on a
view that events cause other events, but rather it must be framed in terms of one
events propensity to follow or be simultaneous with another.
A set of ideas that are more directly relevant to the subject of this thesis are those
published by Bertrand Russell in 1921 in a book entitled Analysis o f Mind. This book
contains a series of lectures given shortly before the book was published, a number of
these deal with issues that relate to visual perception. In these lectures he discusses
perception with reference to both physiology and psychology. Russell defines
perception in the following way.
Adhering fo r the moment to the standpoint of physics we may define a 'perception' o f
an object as the appearance o f that object from a place where there is a brain (or, in
lower animals, some suitable nervous structure), with sense organs and nerves
forming part o f the intervening medium.
Later Russell discusses the nature of sensations, and establishes that they are events
which have physical causes and mental effects. He suggests that mental phenomena
may be explicable in terms of the peculiarities of nervous tissue. In one passage he
alludes to the temporal characteristics of sensation.
We are at all times during or waking life receiving a variety o f impressions which are
aspects o f a variety o f things. We have to consider what binds together two
simultaneous sensations in one person, or more generally, any two occurrences which
form part o f one experience.
A further set of ideas that Russell uses to discuss cognition and perception were
formulated by Richard Semon in his book Die Mnemischen Empfindungen. In this
book Semon sets out his mnemic principles, there are two, the first being the Law of
Engraphy', which is.
All simultaneous excitements in an organism form a connected simultaneous
excitement-complex, which as such works engraphically, i.e. leaves behind a
connected engram-complex, which in so far, forms a whole.
The second mnemic principle, called the Law of Ekphory' is as follows.
The partial return o f the energetic situation which formerly worked engraphically
operated ekorphically on a simultaneous engram complex.
It follows from these two laws that a stimulus that has an excitatory effect, effects a
system in such a way that another stimulus with similar attributes to the first, may
regenerate the mechanism by which the first stimulus was processed. Russell defines
the state of the system before the original stimulus as the 'primary indifference state',
and that after as the 'secondary indifference state'. The difference in the system, that is
the result of the transition between these states can be qualitatively described as the
engram. In terms of the present discussion we might consider an engram to be a set of
connections between neurones in the primary visual cortex, this application however
appears to generate certain problems. These engrams it is suggested give rise to
mnemic phenomena, which have their roots in experience, a mnemic phenomenon can
only occur if the particular aspect of a system under investigation is in its secondary
indifference state. This characteristic of engrams, thus causes problems when we try to
says, in a section entitled Scepticism with Regard to the Senses in his book of 1739,
Treatise on Human nature, concerning the senses,
they give us no notion o f continued existence because they cannot operate beyond the
extent in which they really operate.
At first sight it might seem that Semon's ideas are more applicable to the maturation
of an embryonic nervous system, that develops in a use dependent manner, or to
higher cortical areas, where function depends upon unconscious shaping and
maturation of their signal processing properties, or to centres of the brain concerned
with memory and learning, where mechanisms such as 'long-term potentiation' lend
themselves very well to being considered as engraphic. However it is possible to
consider the primary visual cortex as functioning in two ways with reference to these
ideas. Firstly the high degree of convergent and divergent connections which have
been observed in many recent anatomical studies might be the substrate for engrams.
Each cell would be part of a multitude of overlapping and interacting engrams, and as
a consequence, in it's function the cortex would behave ekorphically. Alternatively the
cortex could be considered to be in continuous flux between primary and secondary
indifference states, engrams would not be hard wired as in the situation above. The
high degree of divergent and convergent connectivity, while obeying a few basic rules,
would be a 'free form' substrate for the formation of engrams in a stimulus dependent
manner. There would be a multitude of transient engrams, which rather than operating
within the spatial constraints of hard-wired anatomy, would function within temporal
constraints. These temporal constraints would then be governed by the electrotonic
characteristics of the cells involved, which would themselves be under the control of
the stimulus.
Historical experimental investigations.
Concurrent with philosophical investigations of the nature of the central nervous
system in the last few hundred years have been investigations of the anatomy of the
brain. Investigation has focused at all levels from the cellular right up to
characterisation of the shape of the cortical mantle.
The first developments in neuro-anatomy came shortly after Hume published his
ideas, in the early 1780's several anatomists were making the first descriptions of the
gross anatomy of the human brain. Alexander Monroe published a book in 1783, that
showed the major subdivisions of the brain, and also depicted the cortex as a uniform
grey strip as distinct from the white matter. At about the same time an Italian
anatomist named Francesco Genari also described the gross structure of the brain but
he also made more detailed observations of the substructure of the cortex, and found
that there was a white layer that divided the cortical grey matter in two and ran
parallel to the surface of the cortex. He also observed that this layer was most
prominent in posterior areas of cortex, he suggested that it might have some particular
and important function. This stripe later became called the Stria of Genari.
Luigi Galvani in 1791, discovered animal electricity, this was the first indication of
the essentially electrical nature of central nervous system function. Continued
exploration of the central nervous system yielded further insights, in the 1860's,
discoveries suggested that particular areas of the brain performed particular functions.
Among these early discoveries were those by British neurologist John Hughlings
Jackson, he observed a recurring epileptic seizure in one of his patients which when
started, spread systematically through the body in the same way each time it occurred.
From this he inferred that there might be a systematic organisation of the brain, with
areas of tissue that are in close proximity controlling movement in limbs that are also
in close proximity. These observations were supported by early physiological
experiments carried out by two Germans, Fritsch and Hitzig. They electrically
stimulated different areas of the frontal lobe and observed movements in different
limbs on the other side of the body from the hemisphere of the brain that they were
studying. They had thus found areas of the cortex with specialised functions, the
control of limb movements, and also that each side of the body is controlled by the
contralateral hemisphere of the brain.
Other work being carried out in the middle of the nineteenth century focused on the
neurones and the second, a larger group of cells called neuroglia, a name that means
'nerve glue', these cells were called this because they appeared to surround the
neurones, fill the spaces between them and generally hold the neurones in place. There
are two main types of glial cells, astrocytes, which are star shaped and
oligodendrocytes.
One early work which focused on vision was by a German scientist named Ernst
Mach, who in 1864 devised a mathematical description of the transformation of the
retinal image into a perceptual image. In his treatise which dealt with the
mathematical characteristics of the analysis of a visual scene. He proposed that the
spatial light distributions within the visual field and on the retinal surface are
respectively processed by retinal and cerebral neuronal mechanisms. The spatial light
distribution i(x,y) on the retina as well as the first and second order derivatives of this
distribution constitute the essential signals used for spatial perception and object
recognition. He asserted that the second spatial derivative is used in the perception of
object contours that separate one object from another.
The first reports of the discovery of a cortical centre which might perform the
manipulations on the retinal image that Mach proposed were made by the Briton
David Ferrier. In work on monkeys he electrically stimulated different areas of cortex
with an alternating current. Eventually he found one, which, when stimulated, caused
the animal to move it's eyes. Shortly afterwards he removed the area of brain, located
in the angular gyrus of the parietal lobe, and found that his subjects were unable locate
objects and pick them up. From much anecdotal evidence he reported that he had
found the area of cortex which dealt with visual function at the Royal Society of
London in 1875. This finding however was hotly contested at the time by a German
named Hermann Munk who had done a similar set of experiments and found that in
fact the occipital lobe was responsible for visual function, not the parietal lobe. Munk
found that lesioning the occipital lobe on one side of the brain resulted in
hemianopsia, blindness in one half of the visual field, and that removal of both lobes
resulted in complete blindness. He also suggested that each lobe was connected to
both eyes. This opened up a controversy not only because of Terrier's previous
observations, but also because Ferrier reported that when he lesioned the occipital
lobe he did not observe the blindness that Munk had done. This was later attributed to
the fact that Ferrier had probably not removed the occipital lobe as thoroughly as
Munk, he had left enough of the peripheral field, so that subjects could exploit greater
eye movements to perform basic visually guided tasks. It has been suggested that in
Perrier's original experiments in the angular gyrus, what he had actually removed was
a centre responsible for visually guided movements. After a number of further
experiments later in the 19th century it became generally accepted that the primary
visual centre was located in the occipital lobe.
The next step in the investigation of visual function involved the discovery that the
visual world is mapped systematically onto the surface of the occipital lobe. This
study was initiated by a Swede named Henchen in 1892, who collected together the
autopsy reports from people with brain damage, that had lead to impairments in
vision. From his data he confirmed Munk's findings and also attempted to map the
visual field onto the cortical surface. However his data was limited, it was not until
the Russo-Japanese war in 1904 that sufficient data was available to deal with this
issue properly. The investigation was carried out by a physician in the Japanese army
called Tatsuji Inouye, and facilitated by the rifle that the Russian Army used, it fired
bullets with a very high muzzle velocity, which meant that a bullet could enter and
leave the skull without shattering it or killing the victim (Glickstein and Whitteridge,
1987). Inouye had 29 patients that had been shot through the occipital lobe, and these
people had the visual deficits commensurate with this. Inouye then mapped the areas
of the visual field that each of his patients could not see, and reconstructed the
trajectory of the bullet relative to the visual cortex from the entry and exit wounds.
This allowed him to construct a clear and reasonably precise map of how the visual
world is mapped onto the cortical surface of the occipital lobe. He showed a number
of things which we would recognise today, firstly that the central visual field is
mapped onto the posterior region of the occipital lobe, and that a disproportionate
large amount of cortical surface is devoted to processing information from the central
visual field.
At about this time there was a great deal of debate about whether the nervous system
Central contributors to this debate were two great European neuroanatomists, Santiago
Ramon y Cajal and Camillo Golgi. Golgi was a passionate proponent of the reticular
theory, whereas Cajal felt that neurones were discrete elements within the nervous
system. Cajal went onto to show this using a technique that Golgi had developed, the
Golgi silver impregnation process. Both men were later to win the Nobel Prize for
their work.
Cajal in 1911 and Brodmann in 1905 initiated the first examination of the distribution
of cells as a function of depth within the striate cortex. As a result of this work, both
proposed lamination schemes for the distribution of cells throughout the depth of the
cortex. However prior to Cajal's lamination scheme other cytoarchitectonie
observations of cellular anatomy, lead him to suggest the presence of functional
systems within the striate cortex. In a report made in 1898 he discusses "isodynamic
groups of neurones that could be activated by elementary sensory impressions." These
observations are possibly the first that relate to the columnar organisation of the
cortex. A form of organisation which has been demonstrated using modem
physiological recording techniques to extend through the full depth of the cortex.
Where cells exhibiting particular properties are grouped in anatomically distinct
modules that are distributed tangentially to the cortical surface. Cajal's subsequent
scheme of cortical lamination was based on differences in morphology that could be
observed between cells at different depths within the cortex using the Golgi staining
technique. This scheme involved 9 layers, each layer containing cells with a different
morphology, particularly relevant to this design was the size and shape of each cell
body. Some layers contained large pyramid shaped soma, while others consisted of
cells with spherical cell bodies. Using the Nissl staining technique Brodmann's
scheme was based on observations of the distribution of total cell populations, it
consisted of a cortex with six basic lamina, these have since been further subdivided,
but these basic schemes still hold.
Other cytoarchitectonie observations of the central nervous system by Brodmann were
of a more global nature. After early reports by Theodore Meynert (1833-1892) and
Paul Flechsig (1847-1929), based on Flechsig's observations of the development of
myelination, and separate work by Meynert, it was pointed out that there were
correlations between structure and function in some areas of the cortical mantle.
Brodmann (1909) proposed a scheme that divided the entire cortical surface into
discrete areas on such grounds. His cytoarchitectonie maps are still used today, and it
was on the basis of these findings that the mammalian primary visual cortex was
denoted area 17.
Shortly after this time several discoveries were made that yielded insight into the
function of individual neurones. The first was by Charles Sherrington (1891) who
conducted detailed physiological and anatomical experiments on the mechanisms that
mediate spinal cord reflexes. This work lead Sherrington to define a pathway that
would be responsible for a reflex, in which information could ever travel in one
direction. He proposed that an intemeuron was involved somewhere in the pathway
making it discontinuous. Sherrington proposed that there should be a structure in his
pathway, known as the synapses, that allows transmission of information between
neurones in a unidirectional manner. At this point however he had not observed the
function or morphology of a synapse, but he had functionally defined it. Thus after the
anatomical reports of Cajal and the insights by Sherrington into how these discrete
entities might communicate, the central concepts on which modem neurophysiology is
based had been established. The first person to integrate these disparate concepts was
Wilhelm von Waldeyer in 1891, today his theories are generally known as the
'neurone doctrine'. He attributed the function of the CNS to the properties of the
neurones within it, this became one of the guiding principles on which studies of the
central nervous system were based until recently. One of the first people to publish
work on the connectivity of neurones, through synapses was the Viennese
physiologist, Sigmund Exner who published a book in 1894. He developed a theory of
neural networks and went on to suggest ways in which assemblies of connected
neurones might analyse aspects of a visual stimulus such as motion. Visual
neuroscience has developed into a reductionist science, in which the physics and
chemistry of the central nervous system are studied. Perception and cognition are
viewed as biological phenomena. We attempt to find out what tasks the brain is
carrying out, and how these come to have a meaning for the organism whose nervous
Recent literature review.
The neural representation of a point in visual space expands as the information
contained within it is conveyed from photoreceptors in the retina up to the cortex. A
point can be said to be represented by a single rod or cone in the retina, such a
neurone has a diameter of only a few microns. However in primate cortex, using
information about receptive field size the area of tissue processing a point in the visual
field, at 5° eccentricity is approximately 0.18 mm^ (Van Essen et al, 1984). There is,
as a consequence a vastly increased population of cells in the cortex that process any
point in visual space. This in turn has important implications for the behaviour of
cells at other points in the network which receive feedforward and feedback
projections. Divergence is a basic feature of network connectivity in the visual system.
Such population expansion provides a substrate for the formation of engram
complexes proposed by Semon and Russell, a process which is investigated here. The
features of this expansion and how it comes about, in terms of the morphology of
individual cells will be discussed below.
The Retina.
The process that occurs in the retina is known as visual transduction. When photons of
light pass into the eye and hit the retinal surface, they are converted into electrical
signals that the nervous system uses to process information. Visual transduction in the
cat and monkey occurs in two types of photoreceptor, rods and cones. These are
distributed over the retina, which is dominated by its population of cones, these are
either sensitive to long (red), medium (green) or short (blue) wavelength light, making
monkeys sensitive to colour in the visual scene, this is not a property of feline retinas
however, which are sensitive only to medium wavelengths. Photoreceptor output is
then further processed by horizontal, bipolar and amacrine cell networks until it
manifests itself in the spatially restricted photic sensitivity of ganglion cells (Hartline,
1940). These cells represent changes in contrast in a visual scene, OFF cells respond
to dark spots flashed on a bright background, or the off phase of a bright spot of light
on flashed dark background. ON cells have the opposite functionality, responding to
the on phase of a bright spot flashed on a dark background, or the off phase of a dark
spot on a bright background (Kuffler, 1953). The area of visual space in which a spot
can activate a cell is a small, circular, highly circumscribed zone, this is the receptive
field centre. The magnitude of the centre response is reduced when an antagonistic
zone surrounding this, is activated by a stimulus that is larger than the centre. A
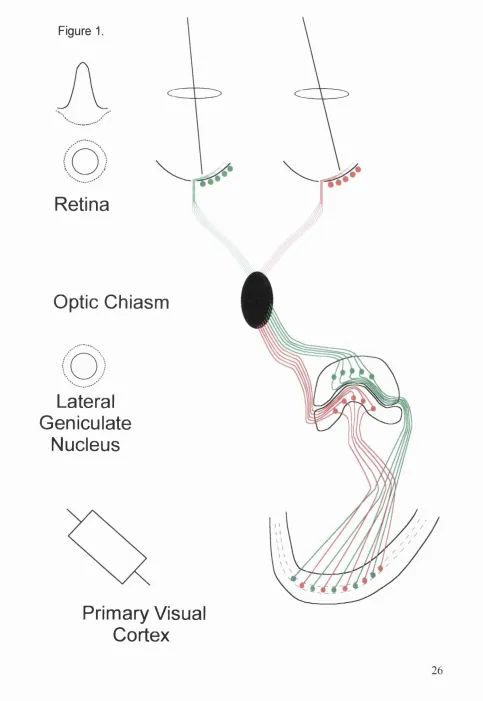
typical ganglion cell receptive field is depicted in figure 1. Detailed physiological
investigation of ganglion cells with visual stimuli has shown that they can be
classified into several groups according to their response properties.
In the cat retinal ganglion cells have been categorised as a, p and y on the basis of
their morphologies (Boycott and Wassle, 1974), subsequently these morphological
classes were shown to have correlates in the categorisation based on receptive field
properties, with Y, X and W cells (Cleland et al, 1975, Piechl and Wassle, 1979 and
Saito, 1983). A similar relationship is believed to be the case in the primate retina
where cells with P type receptive fields have cat P-type morphology, cells with M type
receptive fields have cat a-type morphologies (Perry and Cowey, 1981). In the cat a-
type ganglion cells have relatively large soma, thick axons and spatially extensive
dendritic fields (~200|xm in diameter at 1 mm from the area centralis), p-type ganglion
cells have smaller soma, thinner axons and dendritic fields covering a smaller area at a
given eccentricity, they are ~50|im in diameter 1 mm from the area centralis (AC), a
part of the retina with the highest density of cells, and capable of sampling the visual
field with the highest acuity. The diameters of these dendritic fields increase as a
function of eccentricity, so that 10 mm from the AC a-cell fields are 600-800|Lim
across and p-cell fields are -120pm in diameter, y-type ganglion cells were found to
have the smallest somas and thinnest axons, these cells did however have sparse
dendritic fields covering a large area, approximate 400-500pm in diameter, at an
eccentricity 1mm from the AC.
Enroth-Cugell and Robson, 1966, determined two physiologically distinctive types of
receptive field exhibited by retinal ganglion cells in the cat. The first type were
F igu re 1.
Retina
Optic Chiasm
Lateral
Geniculate
Nucleus
Primary Visual
Cortex
Figure 1.
A schematic diagram of the mammalian visual system, feature retinal output to layer
rV of Primary Visual Cortex via the Lateral Geniculate Nucleus. Spatial information
from the retina is preserved in a retinotopically distributed termination pattern in the
cortex from LGN relay cells. Also featured are typical spatial distributions of photic
manner when stimulated (Cleland et al, 1971), were insensitive to fast moving stimuli
and exhibited linear spatial summation. The second type they denoted Y cells, these
had larger receptive fields, responded with a phasic firing pattern, responded
vigorously to fast moving stimuli and exhibited non-linear spatial summation. The
diameter of both types of receptive field centre increases as a function of eccentricity.
In the centre of the area centralis X cells are 0.2° in diameter, while at 25° eccentricity
they are 0.4° wide. Y cells are bigger for a given eccentricity, in the middle of the AC
they are 0.6° across while at 25° they are 1.4° in diameter (Linsenmeier et al, 1982).
The remaining cell type is characterised by having axons with slower conduction
velocities and having subtly different receptive field properties from those exhibited
by X and Y cells, these cells were denoted W cells (Rodieck, 1967 and Stone and
Fukada, 1974). W cells are not necessarily characterised by the centre-surround
organisation that is detected in the receptive fields of X\Y cells. As a group these cells
exhibit more heterogeneous properties. W cells can either exhibit linear or non-linear
spatial summation, phasic or tonic responses can be evoked from them, some respond
to both the ON and the OFF of a flashed stimulus. These cells have been said to
account for approximately half of all those ganglion cells in the retina, with X cells
making another 45% and Y cells the remaining proportion.
The spatial characteristics of the concentric centre-surround receptive fields exhibited
by cells with X and Y type receptive fields have been investigated in quantitatively
(Rodieck, 1965). Experimental investigation of ganglion cell receptive fields with
small bar stimuli showed that the centre and surround interact antagonistically and
linearly. It was proposed that retinal centre-surround organisation could be described
by a sensitivity profile which was a difference of two gaussian distributions. A
spatially extensive negative one of low amplitude that described the surround, and a
smaller more focused centre of higher amplitude that described the centre, this is
schematically represented in figure 1. Later work (Hochstein and Shapley, 1976) using
a spatio-temporally modulated stimulus, consisting of a series of sinusoidal gratings,
showed that X and Y cells respond differently to such a stimulus. X cells with their
linear spatial summation respond with a modulated discharge at the frequency of the
stimulus, whereas Y cells respond with an unmodulated increase in mean firing rate.
This response mode exhibited by Y cells was denoted, non-linear. A model was
developed in which Y cell receptive fields consist of a linearly summating gaussian
centre with relatively low spatial resolution, and a series of superimposed non-linearly
summing gaussian subunits, that generate the antagonistic surround. An interesting
non-linear characteristic of retinal ganglion cells with Y type receptive fields is that
they are sensitive to stimuli that are presented to areas of visual space surrounding the
receptive field so far described. This response property is known as the 'shift effect',
cells can fire when the receptive field is occluded and the periphery is stimulated
(Mcllwain, 1964).
Macaque monkeys have a visual system sensitive to a similar range of spatial
frequencies (DeValois et al, 1982) as human, cells are also sensitive to colour.
Investigation of primate retinal cells has shown that they have properties that are not
well developed in the cat. The classification of primate retinal ganglion cells has little
in common with X, Y and W type cells in the cat. A major difference between the cat
and the primate was that because the primate retina is dominated by cone
photoreceptors, some retinal ganglion cells have properties consistent with analysis of
colour in a visual scene. Early work in the primate retina (Gouras, 1968, 1969)
showed that two types of responses could be evoked by stimulating a ganglion cell
with a flashed spot. Tonic cells were found to respond to the entire duration of a flash,
whereas phasic cells only responded to the onset of a flashed stimulus. Tonic cells
were also characterised by colour sensitivity, they had centre-surround fields in which
there was often spectral and sometimes spatial antagonism between the two regions.
Phasic cells on the other hand were not sensitive to the colour of their stimuli and
were characterised by broad-band spectral sensitivity profiles. Tonic cells were more
common near the fovea, whereas phasic cells were more often encountered in the
periphery. Further investigation revealed three types based on their responses to
visual stimuli (Demonasterio and Gouras, 1975). Some cells were found to be colour
opponent, others had broadband spectral sensitivity and yet other had non-concentric
receptive fields. Colour opponent cells were characterised by responding tonically and
having centre-surround receptive fields, the centres of which were found to receive
input from one type of cone (sensitive to long, medium or short wavelength light),
responded phasically to flashed stimuli, the fields exhibited by such cells reflect inputs
received from cones tuned to similar wavelengths.
Recording S potentials in the LGN, that are thought to originate from retinal afferents
has shown that there are two physiologically defined groups of cells in the retina,
based on their sensitivity to luminance contrast (Kaplan and Shapley, 1984). These
groups project to anatomically distinct sights in the LGN. The cells that projected to
the magnocellular layers of the LGN, M cells, were found to be 8-10 times more
sensitive to stimulus contrast than those that projected to the parvocellular layers, the
P cells. There are further differences between M and P populations. The receptive
fields of M cells have radii that are 2-3 times greater than those of P cells at a given
eccentricity. However it is thought that this does not mean that P cells are capable of
resolving stimuli with finer acuity, because the higher contrast sensitivity of M cells
makes up for the fact that they have larger fields. It is reported that in the primate
retina 80% of cells are P cells and 10% are M cells (Perry et al, 1984). Thus in the cat
the basis for functional grouping is the spatial summation properties of cells, whereas
in the primate it is contrast and colour sensitivity. It will be seen in the next section
that in both visual systems these functional properties will be conveyed to the next
node in the network, the dorsal lateral geniculate nucleus.
The lateral geniculate nucleus.
A feature of the input from the retina to the LGN is that it is retinotopically ordered,
that is, neighbouring ganglion cells in the retina send axons to LGN that terminate at
neighbouring points, and the spatial structure of the retinal image is conserved within
the network. Within the feline LGN each retinal afferent axon gives rise to a focused
terminal arbour (Sur et al, 1987). Thus when systematic investigations are made to
determine which part of the LGN contains cells that are sensitive to neighbouring
points in visual space, it is found that visual space is mapped clearly over the
horizontal planes of the LGN (Sanderson, 1971). This is represented schematically in
figure 7. Also evident in figure 7, is the separation of input and output paths from
either eye on their way to the cortex. In both the primate and cat retinal ganglion cells
terminate in eye specific layers, with some receiving input from the contralateral eye,
and others input from the ipsilateral eye. In the monkey visual system this separation
of LGN layers exists along with the topographic separation of populations of cells on
the basis of their functional properties
Within the LGN there are thought to be two types of postsynaptic targets, the largest
group, accounting for 75% of the total population are known as relay cells, they send
axons up to the cortex (Guillery, 1966 and Freidlander et al, 1979, 1981), while the
remaining group do not project out of the LGN, they are thought to have an inhibitory
function (Fitzpatrick et al, 1984) because they contain the inhibitory neuro-transmitter,
GAB A. Cells in the feline LGN have receptive fields that reflect those of their retinal
afferents, a given population has functional properties making it suited to perform a
particular role in processing visual information (Shapley and Hochstein, 1975,
Derrington and Fuchs, 1979, So and Shapley, 1979 and Freidlander et al, 1981). X and
Y cells both have low pass spatial frequency tuning profiles, however X cells have a
strong cut-off at the lowest frequencies. In comparison to Y cells, this makes X cells
specialised for processing higher spatial frequencies. These cells are sensitive to
frequencies up to 3 cpd, however they have low temporal resolution, their responses
decrease as the frequency of stimulus modulation increases. It has been suggested that
these might specialise in the analysis of form and pattern in a visual scene. They also
exhibit linear spatial summation, this can be assessed using sinusoidally modulated
grating presented with variable spatial phase. X cells exhibit a null point for one phase
value, where they do not respond, excitatory influences derived from one part of the
grating on the receptive field are exactly balanced by inhibitory ones from another part
of the field. Y cells characteristically have larger receptive fields and hence exhibit
peak spatial tuning to lower spatial frequencies. Their spatial summation is non-linear,
they do not exhibit a null-point, when stimulated with a phase-reversing grating they
respond with a tonic increase in firing rate which can be modulated at twice the
reversal frequency. Y cells fire in a transient manner when stimulated and are capable
of following fast moving stimuli. The a-ganglion cell that project to Y cells are spread
more evenly throughout the retina, so unlike X cells which are present in largest
The LGN is not simply a relay point for the retinal signal on its way to the cortex. It
exists within a network of feedforward and feedback projections, and as a
consequence the properties of cells are manipulated by a number of non-retinal
influences. Firstly the excitatory transfer of retinal information to relay cells is shaped
by feedforward inhibitory interactions that originate from intrinsic inhibitory cells.
Other inhibitory cells in the neighbouring perigeniculate nucleus (Lo and Sherman,
1994, Ahlsen et al, 1985 and Houser et al, 1980) mediate feedback inhibition after
having received input from relay cell axons. Both these circuits are themselves subject
to feedback from the cortex (Guillery, 1967, Hollander, 1970, Updyke, 1975).
Cortico-geniculate axons make excitatory synapses on PGN cells, and LGN relay cells
and intrinsic intemeurons (Baughman and Gilbert, 1980 and Fonnum et al, 1981 and
Guillery, 1969, Weber et al, 1989, and Montero, 1991). Cortico-geniculate axons have
been shown to have influences on the stimulus specificity of LGN cell responses
(Murphy and Sillito, 1987 and Sillito et al, 1993) and the ways in which they operate
as networks (Sillito et al, 1994). LGN relay cells characteristically exhibit length
tuned receptive fields. This means that when they are presented with bar stimuli,
which are usually used to probe the structure of cortical receptive fields, at parafoveal
eccentricities, they respond most strongly to bars shorter than 1° in length, when
longer bars are used, response magnitudes are typically reduced by 70% (Cleland et al,
1983 and Jones and Sillito, 1991). This has been reported to be due the antagonistic
surround, which has its origins in the receptive field properties of retinal afferents and
is further enhanced by feedforward inhibition in the LGN and also by contacts made
on intrinsic interneurons by cortico-geniculate layer VI cells (Murphy and Sillito,
1987 and Jones and Sillito, 1994). Such response suppression is also observed when
cells are stimulated with large field of sinusoidal gratings (Sillito et al, 1993), stimuli
to which layer VI cells respond optimally.
The perigeniculate nucleus is a zone of the reticular nucleus which exists within the
network of afferent and efferent connections between the LGN and cortex and
receives input from both. PGN cells themselves are thought to have an inhibitory
function, intracellular recording (Ahlsen et al, 1985) has indicated that there are
inhibitory connections originating from this centre in the LGN, and on the basis of
other recordings a mechanism has been postulated in which PGN cells inhibit the
intrinsic intemeurons of the LGN. It is thought that there are also interconnections
between PGN cells themselves (Ahlsen and Lindstrom, 1982). These observations,
and those discussed above, led to the suggestion that the cortico-geniculate pathway
and the PGN play a role in gating visual signals. Studies using electrical stimulation
of the optic tract or visual cortex, have shown that feedback inhibition in the LGN,
brought about by IPSPs generated by the PGN axons as a result of their cortico-
geniculate excitatory input (by virtue of their latencies) are decreased in amplitude.
Disynaptic feedforward inhibition present in the pathway between ganglion and relay
cells was also decreased by stimulation of the cortex. These observations
demonstrated that the feedback inhibitory pathway from the PGN can suppress the
feedforward inhibitory pathway by inhibiting intrinsic intemeurons, in the LGN. The
receptive fields of PGN cells are significantly larger than those of the LGN (Wrobel
and Tamecki, 1984), and when stimulated by bar stimuli they do not exhibit the length
tuning that characterise geniculate X and Y cells (Jones and Sillito, 1994). When
presented with flashing stimuli they respond with mixed ONNOFF discharges (Dubin
and Cleland, 1977) and can follow stimuli that are temporally modulated. Most PGN
cells receive input from both A laminae in the LGN and so respond to stimulation of
either eye.
Cells in the LGN and PGN and their afferent and feedback inputs are then subject to a
range of other influences which have modulatory effects on their responses. These
arrive from centres such as the basal forebrain, the parabigemminal nucleus, the locus
coemlus and the dorsal raphe nucleus. Acetylcholine is a modulatory neurotransmitter
that has an influence in the LGN. It brings about transitions from sleeping states to
states of arousal. These state changes occur with concomitant changes in the firing
pattems of cells. Cells go from rhythmic bursting states at frequencies below 12 Hz
(Hirsch et al, 1983 and Leresche et al, 1991), to states where they fire single spikes
(McCormick and Prince, 1987 and McCormick, 1991, Rogawski and Aghajanian,
1980). This latter state has been associated with visual function during arousal
periods, and is thought to facilitate faithful transmission of visual information to LGN